- HOME
- BI & Analytics
- How AI Is Transforming Business Intelligence: A Complete Guide
How AI Is Transforming Business Intelligence: A Complete Guide
- Last Updated : March 27, 2026
- 1.4K Views
- 17 Min Read
Business intelligence has always been about converting raw data into decisions. But the way that conversion happens has changed more in the last three years than in the previous three decades.
Traditional BI tools were built to answer one question: What happened? They did it well, through structured reports, scheduled dashboards, and SQL-driven queries. But they required analysts to know what to ask, when to ask it, and how to interpret the results. That model worked when data moved slowly and business questions were predictable. Neither condition holds today.
AI changes the fundamental contract between BI software and its users. Instead of waiting for a human to ask the right question, AI-powered BI systems surface answers proactively, detect anomalies before they become crises, forecast outcomes before they materialize, and let any employee, regardless of technical skill, to interrogate data in plain language. According to McKinsey's State of AI 2025, 88% of organizations now use AI in at least one business function. Separately, Deloitte's 2026 State of AI report found that worker access to AI rose 50% in 2025 alone.
This guide covers how AI has evolved within BI, how it differs from traditional approaches, what capabilities it unlocks, where it faces real implementation challenges, and how tools like Zoho Analytics put these capabilities into practice.
How AI in BI evolved: From static reports to agentic analytics
The history of business intelligence is a story of shrinking the gap between data and decision. Each era made that gap smaller, but also revealed new limitations worth solving.
1960s - 1980s: Static reporting
Early BI began with mainframe-driven reporting systems. Analysts submitted data requests, waited days for output, and received static printouts that were often outdated by the time they arrived. Insights were available only to those with direct access to data systems.
1990s: Data warehousing and OLAP
The introduction of data warehouses and Online Analytical Processing (OLAP) cubes made historical data faster to access. Multidimensional analysis became possible, but building and maintaining these systems required specialized expertise. Most business users still depended entirely on IT or data teams for reports.
2000s: Self-service BI
Drag-and-drop interfaces from tools brought dashboards to non-technical users. Data democratization became a stated goal. The problem: users still needed to know what they were looking for. Self-service BI answered known questions efficiently; it offered little help in discovering unknown ones.
2010s: Machine learning enters the picture
Cloud infrastructure made large-scale machine learning economically viable. Fraud detection, customer segmentation, and demand forecasting became practical BI applications. Natural language processing began to appear in enterprise tools, allowing users to query data conversationally. These were additive capabilities layered on top of existing BI architectures - powerful, but not yet transformative.
2022 - 2024: Generative AI and augmented analytics
The arrival of large language models (LLMs) like GPT-4 accelerated the shift toward augmented analytics. BI tools began generating narrative summaries, auto-creating visualizations, and translating natural language questions directly into database queries. The analyst's role started changing from data translator to oversight function.
2025 - 2026: Agentic AI in BI
The current frontier is agentic analytics. Rather than responding to questions, AI agents in BI systems proactively monitor data streams, identify anomalies, reason through root causes, and deliver finished analysis even sometimes before a human realizes there is a question worth asking. Gartner predicts that 40% of enterprise applications will embed task-specific AI agents by the end of 2026, up from less than 5% in 2025.
The practical consequence: BI is shifting from a system you query to a system that works continuously on your behalf.
AI-Powered BI vs. Traditional BI: Key differences
Understanding what AI adds to BI requires a clear picture of what traditional BI does and where it stops.
Traditional BI is fundamentally descriptive and diagnostic. It answers what happened and, to a degree, why it happened. It relies on structured data, predefined reports, human-written queries, and periodic refresh cycles. Results are visualized as charts and dashboards. The user interprets them.
AI-powered BI adds predictive and prescriptive layers. It answers what is likely to happen and what you should do about it. It processes structured and unstructured data, surfaces insights without being asked, updates in real time, and increasingly takes autonomous action within defined guardrails.
| Dimension | Traditional BI | AI-Powered BI |
| Primary question answered | What happened? | What will happen? What should we do? |
| Data types handled | Structured (tables, databases) | Structured + unstructured (text, signals) |
| Analysis mode | Reactive - triggered by human queries | Proactive - continuous monitoring |
| User interaction | SQL queries, filters, predefined reports | Natural language, conversational queries |
| Reporting cadence | Periodic (daily, weekly, monthly) | Real-time, event-driven |
| Insight generation | Manual. Analyst interprets data | Automated. System surfaces insights |
| Forecasting | Limited; requires separate modeling tools | Built-in predictive models |
| Scalability | Degrades with data volume and complexity | Improves with more data |
| Technical barrier | High. Requires SQL or analyst mediation | Low. Accessible to business users |
“Zia is a great feature that helps us create new reports and is a great starting point. Our customers are delighted with its performance and the intuitive features that allow them to create reports effortlessly.”
Veerendra Kumar
Technical Project Manager, Ubq Technologies
TRY ZOHO ANALYTICS - THE MODERN BI TOOL
The two approaches are not mutually exclusive. AI augments traditional BI infrastructure rather than replacing it. Your data warehouse, ETL pipelines, and governance frameworks remain foundational - AI is the intelligence layer on top.
Core AI capabilities in modern BI tools
- Natural language processing and conversational queries
- AI-powered data preparation and cleansing
- Automated insight generation
- Predictive analytics and forecasting
- Anomaly detection and smart alerts
- AI-enhanced data visualization
- Prescriptive analytics and recommendations
- Agentic AI and autonomous analytics
Natural language processing and conversational queries
Natural language processing (NLP) eliminates the query language barrier that kept non-technical users dependent on analysts. Instead of writing SQL or navigating filter menus, a user types or speaks a question in plain English, and the system returns a chart, a table, or a narrative answer.
Modern NLP engines in BI tools parse questions with multiple conditions, resolve business-specific terminology through semantic layers, understand synonyms (so "revenue," "sales," and "bookings" all map to the same metric), and handle ambiguous phrasing using context from previous queries in the same session.
The practical outcome: a marketing manager can ask "Which campaigns drove the most conversions last quarter in the northeast region?" and receive a ranked visualization in seconds, without involving a data analyst.
AI-powered data preparation and cleansing
Raw data is rarely analysis-ready. Before any insight can be generated, data must be cleaned, deduplicated, formatted, and joined across sources. In traditional BI workflows, this data preparation work is often called ETL (Extract, Transform, Load) and can consume analyst's time.
With AI this process is accelerated and partially automated by detecting and correcting data quality issues, suggesting schema mappings when connecting disparate sources, identifying duplicate records using fuzzy matching, flagging anomalies in incoming data pipelines in real time, and recommending transformations based on the shape of the data.
The result is faster time-to-insight and reduced dependence on data engineering resources for routine preparation tasks.
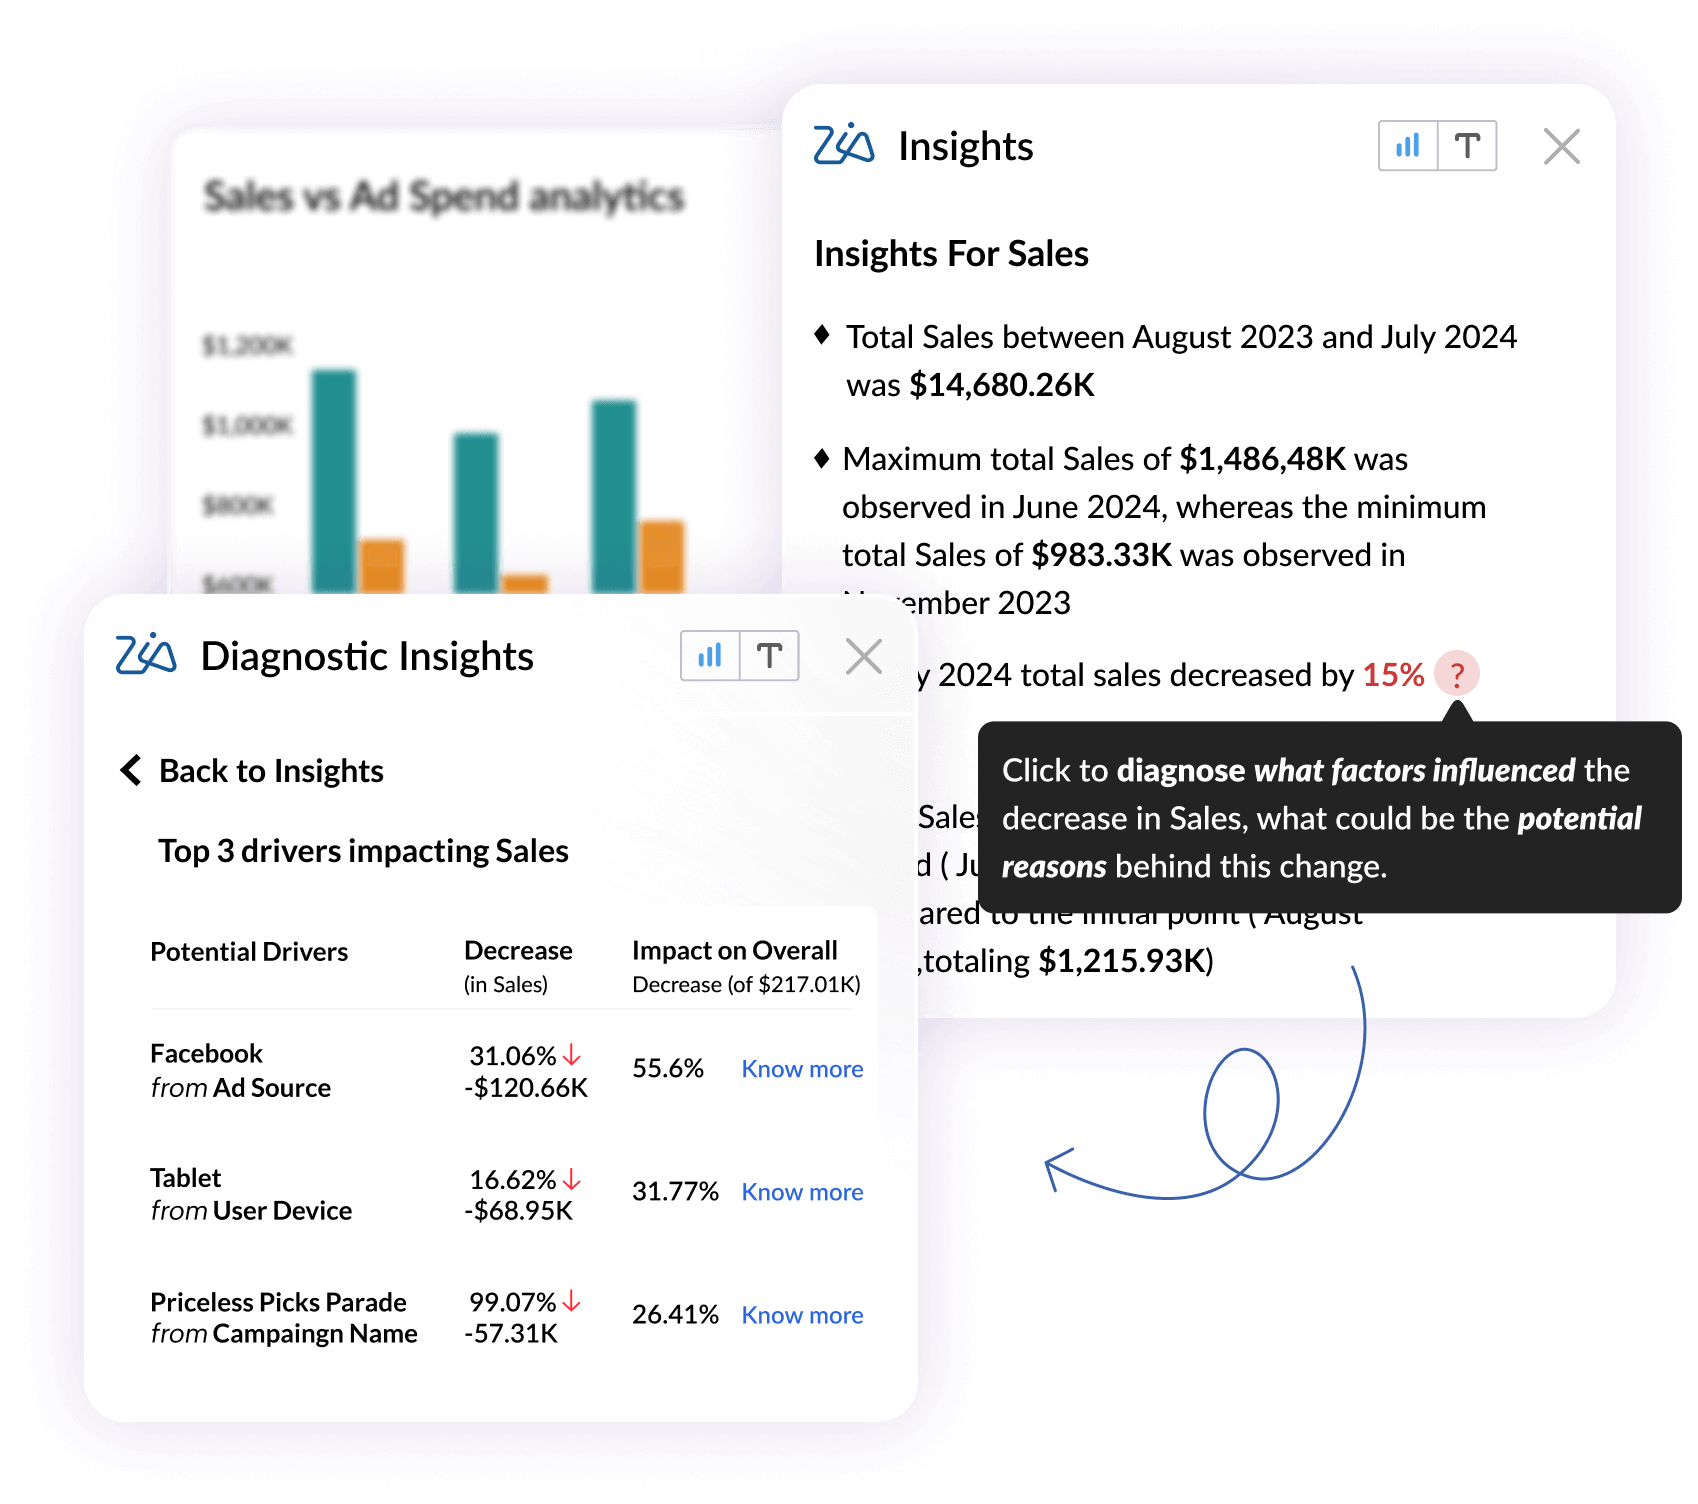
Automated insight generation
Traditional dashboards show you metrics. AI-powered BI explains them.
Automated insight generation means the system continuously scans your data for statistically significant changes like spikes, dips, correlations, trend reversals, and surfaces them in plain language before you think to look. Instead of checking seventeen dashboards manually each morning, you receive a digest of what actually changed and why it matters.
This sophistication of automated insights varies by platform. Basic implementations flag threshold breaches (e.g., "sales dropped below target"). More advanced systems identify contributing factors, compare current performance to historical patterns, and generate narrative summaries at the report and dashboard level.
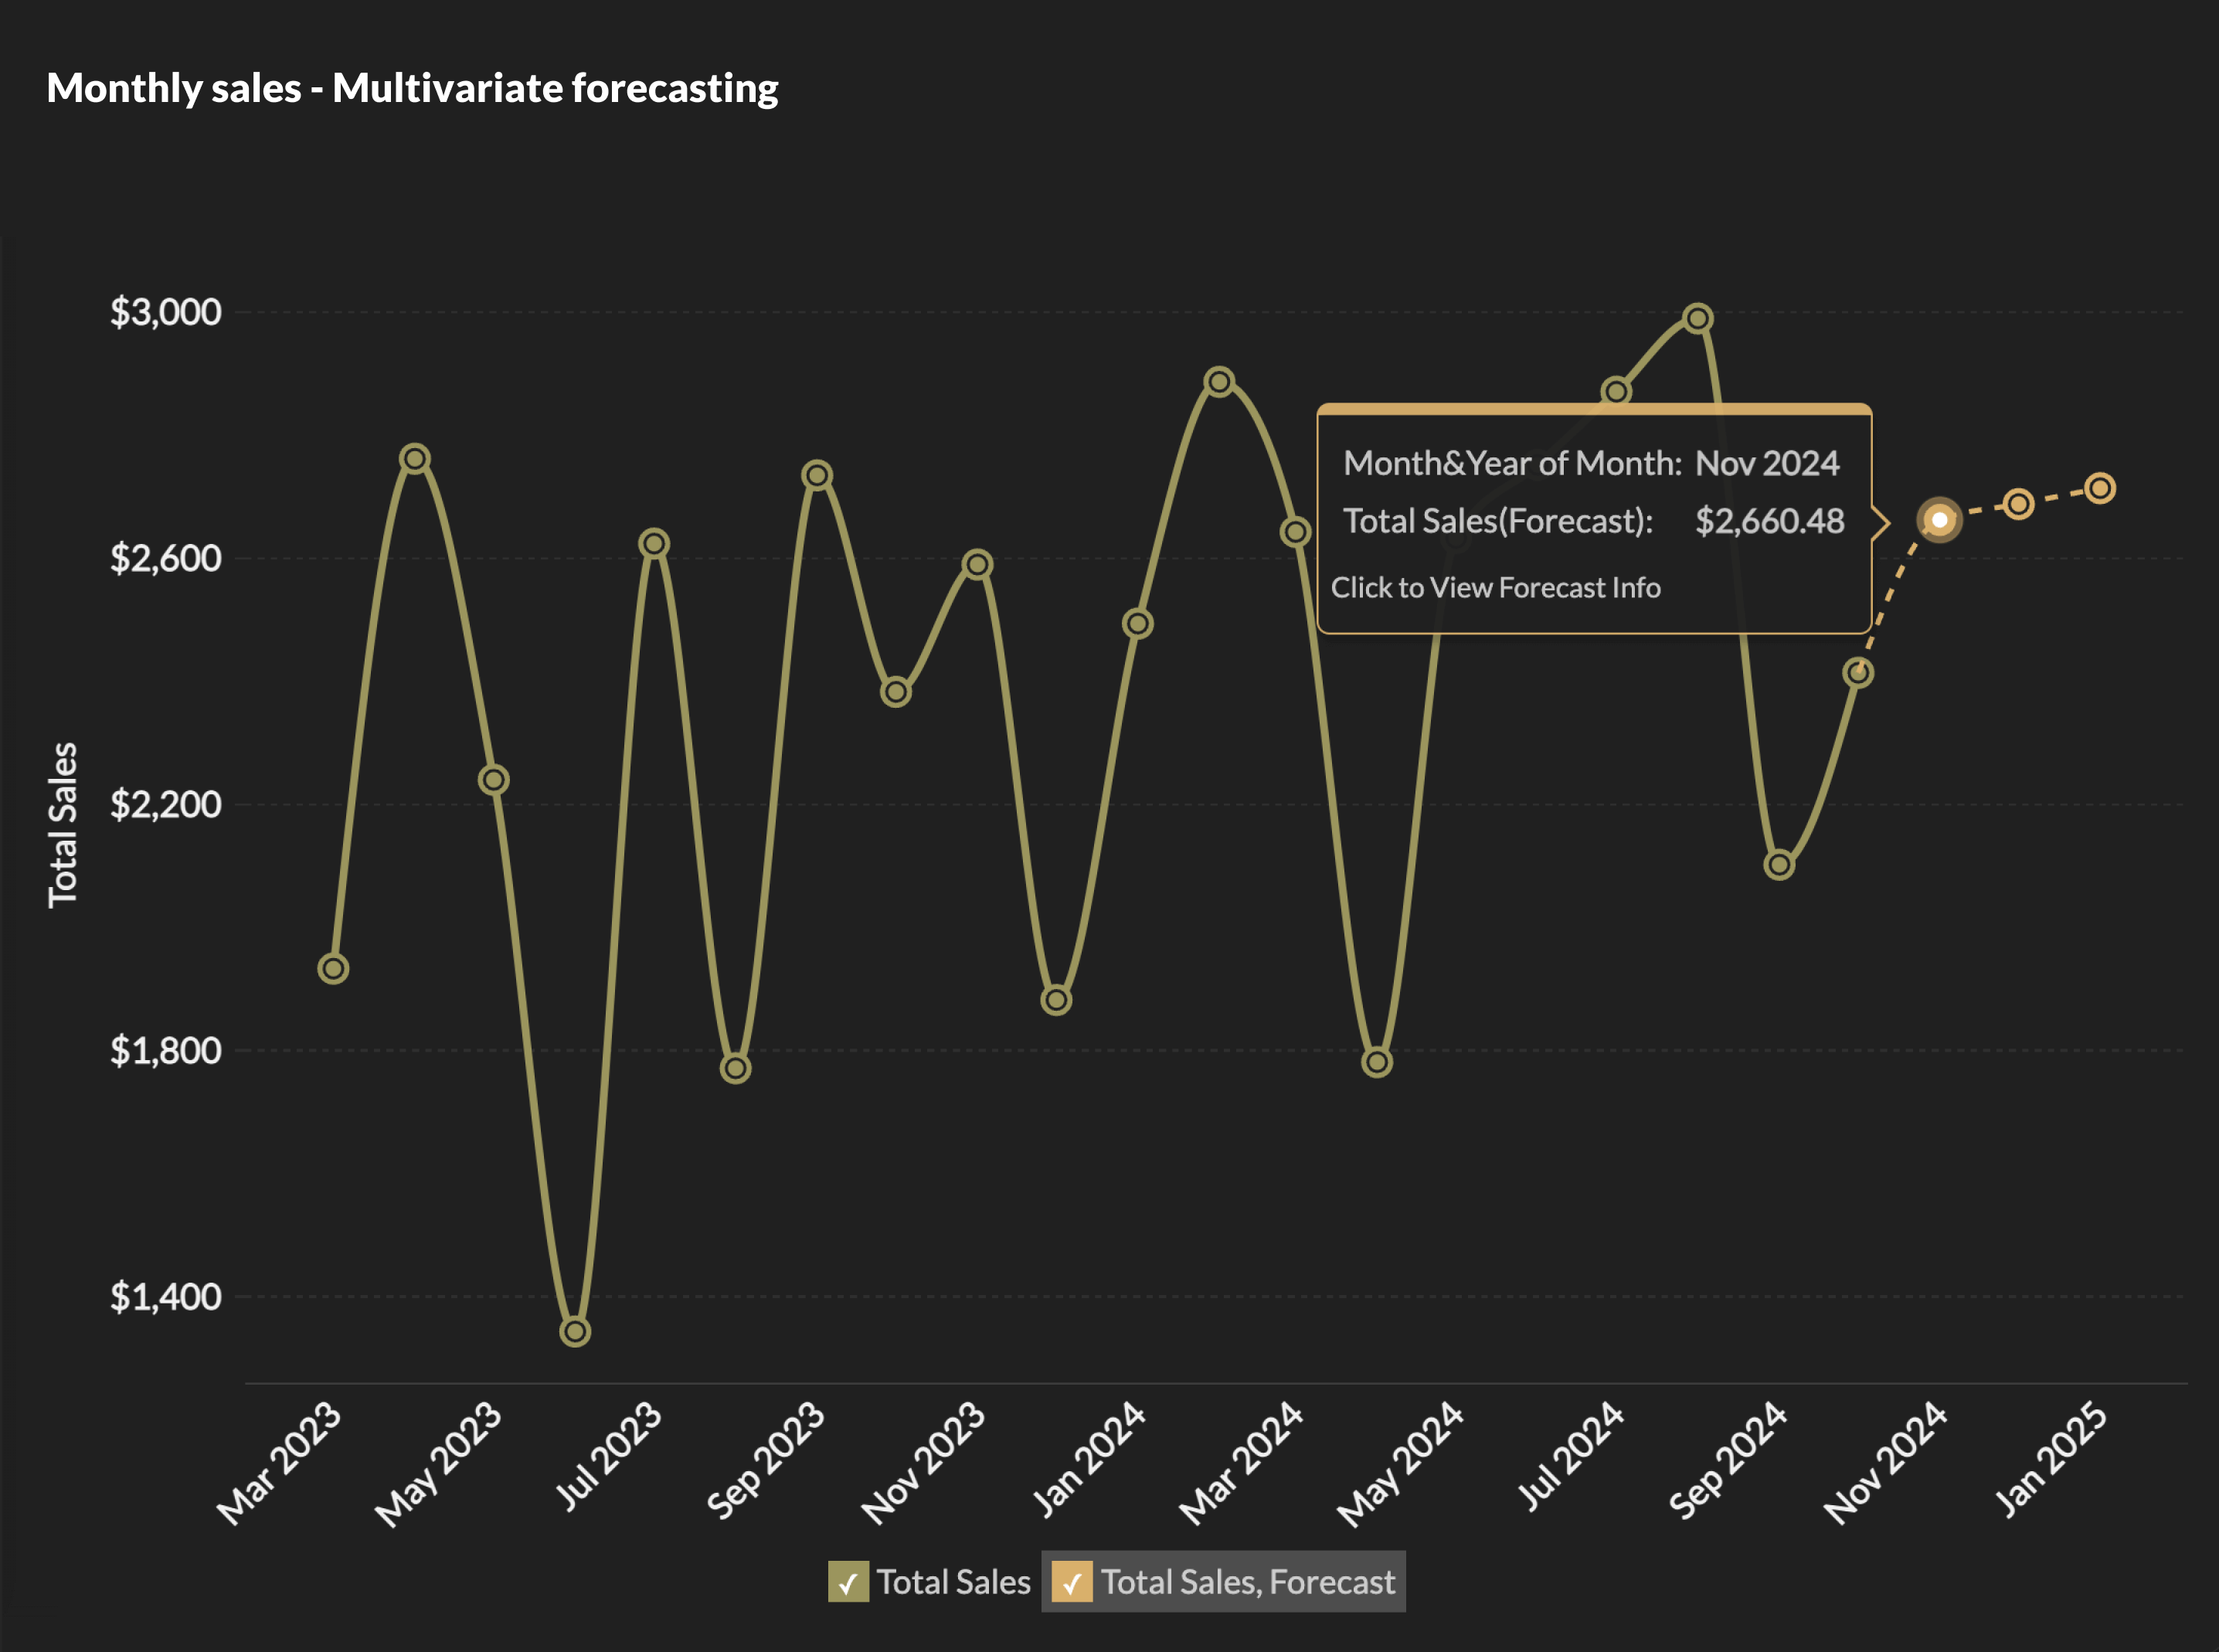
Predictive analytics and forecasting
Predictive analytics uses historical data and machine learning models to estimate future outcomes. In a BI context, this means sales revenue forecasts, customer churn probability scores, demand predictions for inventory planning, risk scores for financial decisions, and equipment failure probability for maintenance scheduling.
Critically, modern BI platforms embed these models directly into dashboards with no separate data science environment required. Business users can select a metric, define a forecast horizon, and receive confidence-interval projections without writing a single line of code.
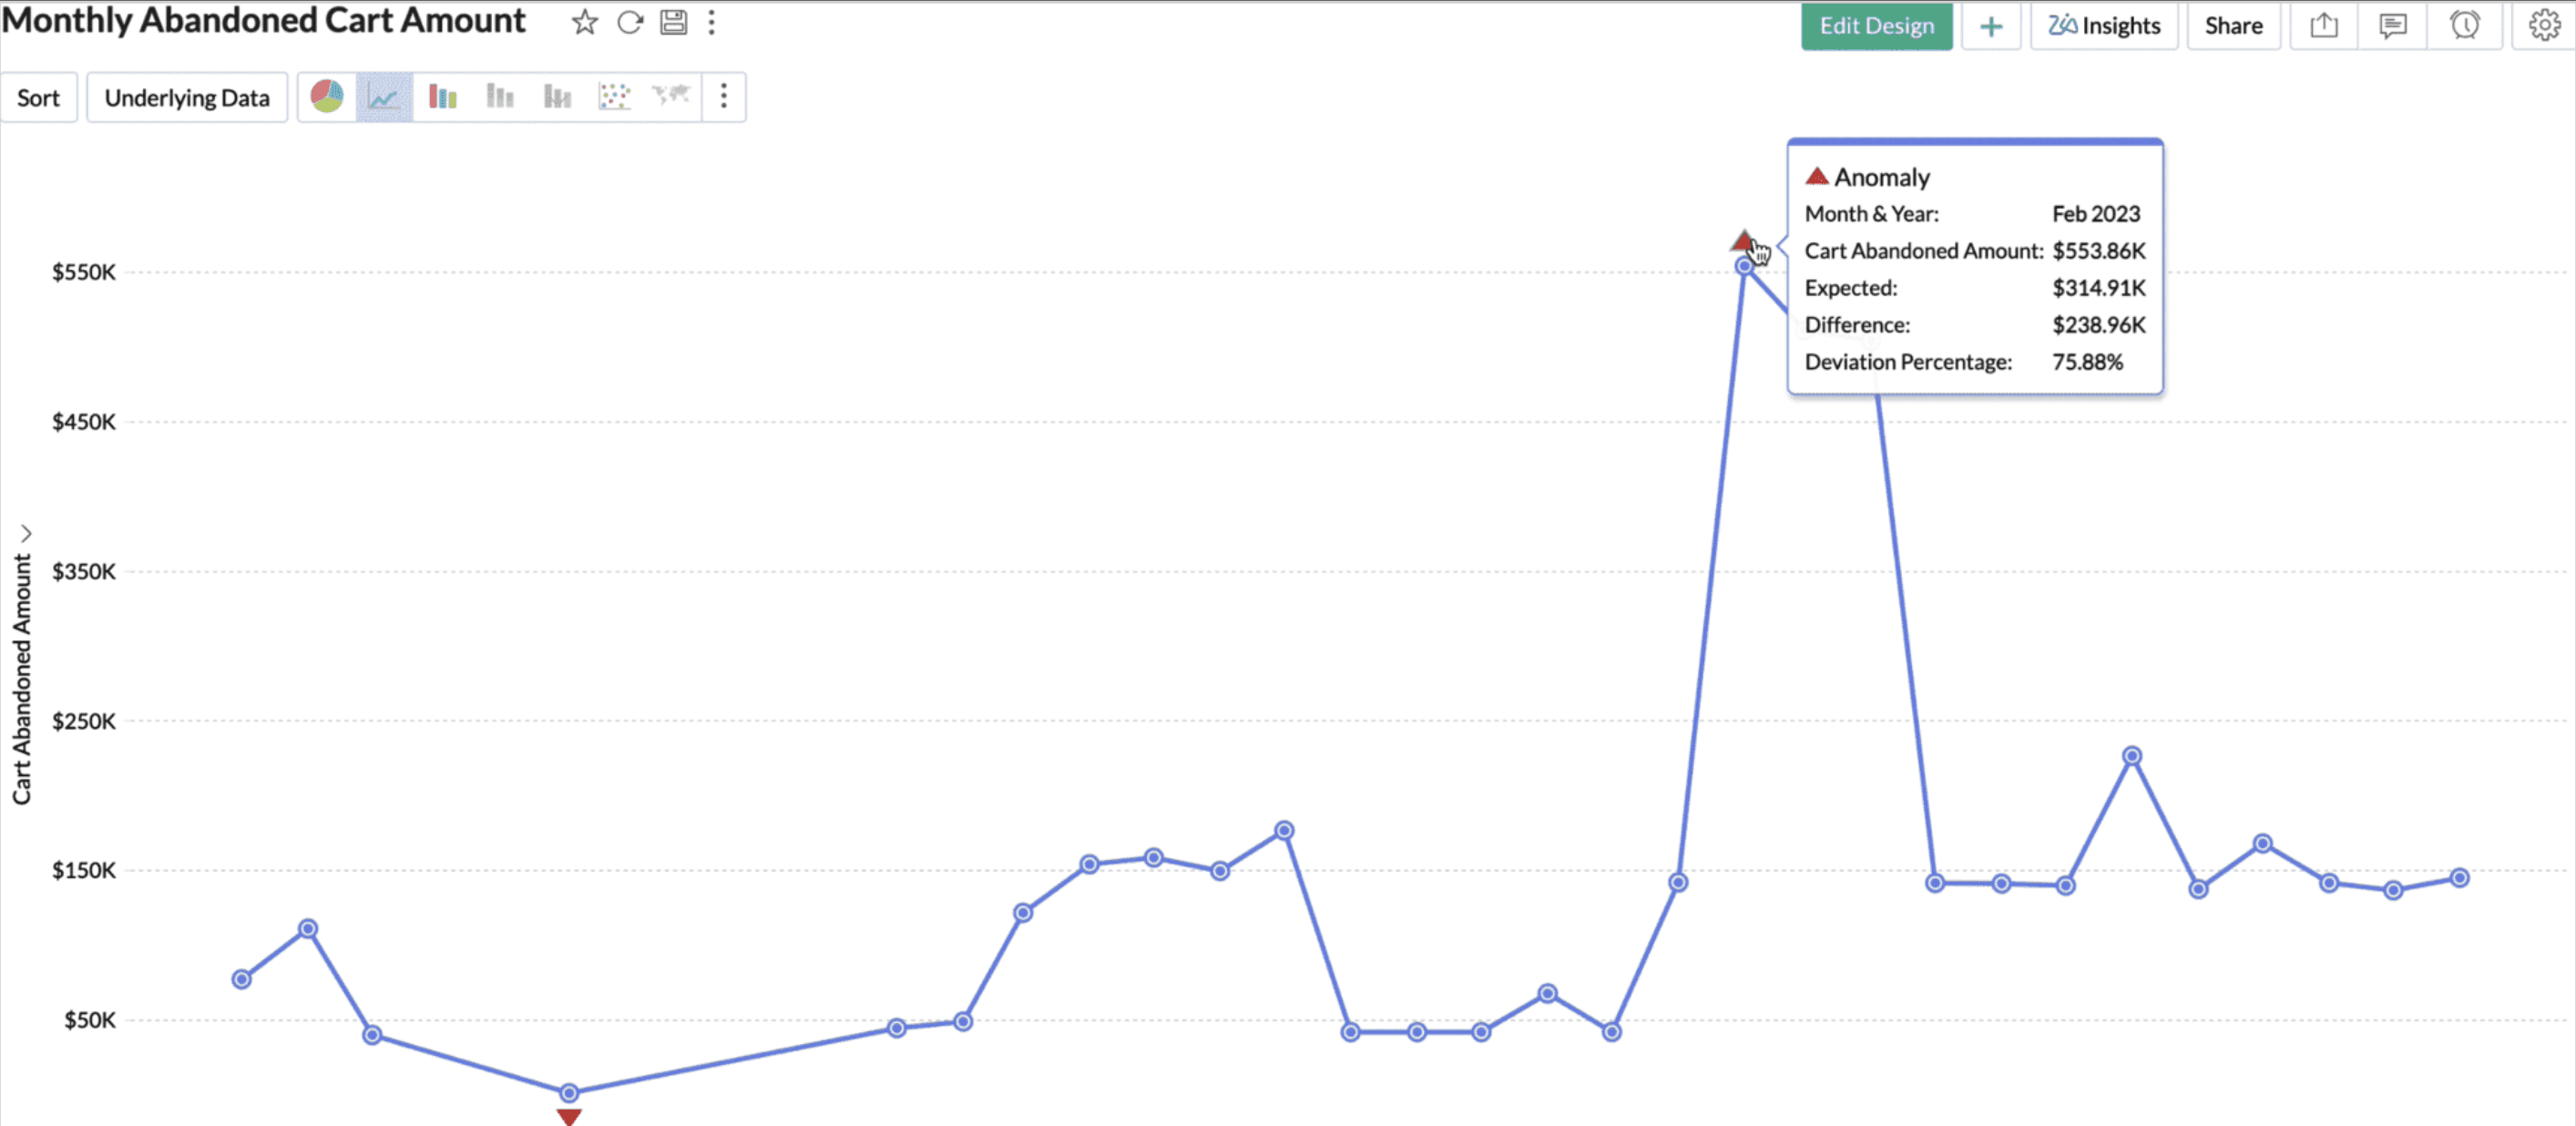
Anomaly detection and smart alerts
Anomaly detection monitors your key metrics continuously and alerts you when something deviates significantly from expected patterns. Unlike static threshold alerts ("notify me if revenue drops below $X"), AI-driven anomaly detection learns normal behavior patterns dynamically and flags deviations that fall outside those patterns, even if no threshold was explicitly configured.
This matters because it catches problems that threshold-based alerts miss: gradual degradation that never crosses a hard cutoff, unusual combinations of metrics that individually look normal, or seasonal anomalies that require historical context to identify.
But with smart alerts, an additional layer is added: instead of notifying you that something changed, they tell you why it changed and what the likely downstream effects are.
AI-enhanced data visualization
AI improves data visualization at two levels. First, it recommends appropriate chart types automatically based on the structure and relationship of the data being queried, which is a useful feature that prevents common mistakes like using bar charts for time-series data or pie charts with too many segments.
Second, AI makes visualizations interactive and explanatory. Clicking on a data point can trigger an automatic decomposition of what drove that result. Dashboards can generate written narratives that explain what a visualization shows in plain terms, making the output accessible to stakeholders who may not be fluent in reading data charts.
Prescriptive analytics and recommendations
Prescriptive analytics goes beyond forecasting to suggest specific actions. Where predictive analytics answers what will happen, prescriptive analytics answers what should we do about it.
In a BI context, this might look like: "Churn risk for this customer segment has increased 23% over the last 30 days. Based on historical intervention data, a targeted retention offer at this stage has a 67% success rate." The system doesn't just surface the insight, it recommends a response.
Agentic AI and autonomous analytics
The most significant development in AI-powered BI is the shift toward agentic systems. An Agentic AI in BI context is a software entity that can interpret questions, analyze data, reason through findings, and take action with minimal human direction.
Unlike passive AI features that respond when queried, agentic BI systems operate continuously. They monitor data streams, identify when KPI changes warrant investigation, run multi-step analysis autonomously, generate executive-ready narratives, and in some configurations, trigger downstream actions like alerting a supply chain team, updating a forecast model, or escalating a risk flag without waiting for a human to log in.
Industry use cases for AI in business intelligence
Retail: Inventory optimization and demand forecasting
Retailers operate across thousands of SKUs, dozens of distribution centers, and seasonal demand patterns that shift with macroeconomic conditions. AI in BI makes it possible to forecast demand at the SKU-store level, optimize replenishment automatically, and detect early signals of stockouts before shelves empty.
A practical example: an AI-powered BI system monitoring a retailer's supply chain detects that a specific product category in the southeast region is trending toward a 12-day stockout well before any threshold alert would fire. It correlates the trend with upstream supplier lead times, flags the risk to the procurement team, and suggests reorder quantities based on current demand velocity. The team acts before the stockout occurs.
Beyond inventory, AI in retail BI supports customer segmentation for targeted promotions, price optimization modeling, and basket analysis to identify cross-sell opportunities.
Healthcare: Patient outcomes and operational efficiency
Healthcare organizations use AI in BI to predict patient readmission risk, optimize staffing based on admission forecasts, identify care gaps in patient populations, and monitor quality metrics across facilities in real time.
Predicting which patients are likely to be readmitted within 30 days of discharge is a high-value use case. By analyzing clinical histories, medication adherence patterns, and social determinants of health, AI models can flag high-risk patients at the point of discharge, enabling care teams to arrange follow-up interventions before a preventable readmission occurs. Healthcare is now deploying AI at 2.2 times the rate of the broader economy, according to a 2026 Menlo Ventures report.
Operationally, AI in healthcare BI helps administrators understand length-of-stay patterns, identify bottlenecks in emergency department workflows, and allocate resources more precisely.
Marketing: Campaign performance and attribution
Marketing data is fragmented and spread across ad platforms, CRM systems, web analytics tools, email marketing platforms, and offline channels. AI in BI makes it possible to unify these sources, attribute revenue across the full customer journey, identify which channel combinations drive the highest-value customers, and optimize budget allocation in near real-time.
With AI-powered anomaly detection in marketing problems are caught early. For example, a campaign with an unexpected spike in bounce rate or an email sequence with a sharp drop in open rates on a specific segment or a conversion path where users consistently drop off at a particular step. These signals surface automatically rather than waiting for an analyst's next scheduled review.
Predictive modeling adds a forward-looking layer, estimating customer lifetime value from early behavioral signals, forecasting the revenue impact of budget changes before they are made, and identifying audiences most likely to respond to a given offer.
Supply chain: Visibility and risk mitigation
Supply chains generate enormous volumes of data across suppliers, logistics partners, customs systems, and inventory locations. AI in BI makes it possible to build real-time visibility across this network and identify disruption risks before they escalate.
Use cases include supplier risk scoring based on financial health, delivery reliability, and geopolitical exposure; dynamic routing optimization based on current logistics conditions; demand sensing that integrates external signals (weather, events, economic indicators) alongside internal sales data; and automated root-cause analysis when a delivery schedule deviation occurs.
The shift from reactive to proactive supply chain management is knowing about a disruption before it impacts production rather than after, is one of the clearest demonstrations of what AI-powered BI makes possible.
Benefits of AI-powered business intelligence
Faster time from data to decision
The traditional BI workflow: analyst receives a request, pulls data, builds a report, delivers it, introduces delays that compound across an organization. AI compresses this cycle dramatically. Automated insight generation, natural language querying, and pre-built predictive models mean that business users can get answers in seconds rather than waiting hours or days for analyst output.
Broader access to analytics
Before AI-powered BI, data analysis required either technical skills (SQL, Python, statistics) or access to an analyst who had them. This created a bottleneck. Data teams were overloaded with report requests, while business stakeholders waited for insights they could have acted on immediately.
And with Natural language querying, this bottleneck is removed. A sales manager, a finance director, a regional operations lead, any of them can ask questions directly and receive answers, without routing through a data team. This is not just a convenience improvement; it changes the organizational dynamic around how data is used in decisions.
Proactive rather than reactive insights
Traditional BI is inherently reactive. You must know to ask. AI-powered BI is proactive. It tells you what you should be asking, even when you haven't thought to look.
This continuous monitoring and automated anomaly detection mean that significant changes in your data surface to the relevant stakeholder immediately, rather than waiting to be discovered in the next scheduled report review. This shifts the mode of operation from monitoring dashboards to receiving intelligence, with meaningful implications for response time and decision quality.
Reduced analyst time on low-value work
Data cleaning, report formatting, ad-hoc query execution, and routine dashboard maintenance consume significant analyst capacity. AI automation reduces the time spent on these tasks, freeing analysts to work on more complex modeling, strategic analysis, and insight communication.
This is not about replacing analysts, it is about reorienting their work toward higher-value activities that require judgment, domain knowledge, and business context that AI cannot replicate.
Challenges and limitations of AI in BI
Implementing AI in BI is not without friction. Organizations that approach it without understanding the real challenges tend to stall in pilot mode or generate results that erode rather than build confidence in AI-driven insights.
Data quality problems undermine AI effectiveness
AI models are only as reliable as the data they are trained on. Inconsistent data entry, missing records, conflicting definitions across departments, and outdated information in legacy systems all degrade model performance. According to Gartner, only 4% of IT leaders consider their data truly AI-ready.
The consequence of poor data quality is not just inaccurate predictions. It is compounded error, because AI systems can amplify data quality issues at scale. A model trained on biased or incomplete data produces biased outputs confidently, which is worse than producing no output at all.
Skills gaps limit adoption
AI-powered BI tools have lowered the technical barrier for analysis significantly, but implementation still requires expertise. Data engineers need to build and maintain the pipelines that feed AI models. IT teams need to manage integrations and governance. Business users need enough data literacy to evaluate AI-generated insights critically rather than accepting them uncritically.
And, organizations frequently underestimate the training investment required to get genuine value from AI BI deployments. Role-specific training programs - not generic AI literacy courses, but practical programs tied to specific tools and workflows are necessary for adoption at scale.
Ethical concerns require active management
AI systems can replicate biases present in historical training data, producing recommendations that are systematically unfair to certain customer segments, employee groups, or geographic regions. These biases can be difficult to detect because the model's outputs appear numerically confident even when the underlying patterns are problematic.
Active bias management requires regular model auditing, diverse training datasets, clear ethical guidelines that define acceptable and unacceptable use cases, and governance structures that include accountability for AI-driven decisions at the organizational level.
Integration complexity
Most organizations have fragmented data infrastructure. Data in cloud warehouses, legacy on-premise systems, SaaS applications, and spreadsheets. Connecting AI-powered BI to all of these sources, maintaining data freshness, and managing the governance implications of cross-system data flows is technically demanding.
Platform selection should account for integration breadth like how many data connectors are available, what the typical integration complexity looks like, and whether the vendor has documented experience with your existing stack.
How to implement AI in your BI strategy
- Step 1: Audit your data foundation
- Step 2: Define specific business problems
- Step 3: Select tools aligned to your maturity level
- Step 4: Build governance and trust mechanisms
- Step 5: Train users in context
- Step 6: Measure and iterate
Step 1: Audit your data foundation
Before selecting tools or defining use cases, assess the quality, completeness, and accessibility of your existing data. Identify where data is siloed, where definitions are inconsistent, and where ownership is unclear. AI amplifies existing data quality issues and solving them first is a prerequisite for success.
Step 2: Define specific business problems
Avoid implementing AI in BI as a general infrastructure initiative. Instead, identify two or three specific business problems where AI-generated insights would have a measurable impact. Common starting points include: reducing analyst time spent on recurring report requests, improving forecast accuracy for a specific revenue or cost driver, or detecting a category of operational issue faster than the current process allows.
Specific problems make it possible to define success metrics before deployment, which is essential for demonstrating ROI and building organizational confidence in AI-powered insights.
Step 3: Select tools aligned to your maturity level
AI BI platforms vary significantly in their AI depth, ease of implementation, and the technical resources required to operate them. Organizations early in their AI journey should prioritize platforms with strong natural language querying, automated insight generation, and built-in predictive models that do not require data science resources to configure. More mature organizations may need platforms that support custom ML models, advanced governance controls, and embedded analytics for customer-facing applications.
Evaluate platforms on integration breadth, AI explainability, governance capabilities, and total cost of ownership - not just headline AI features.
Step 4: Build governance and trust mechanisms
Define how AI-generated insights will be validated, who has authority to act on automated recommendations, and what human oversight is required for different categories of decisions. High-frequency, low-stakes decisions (automated alerts, report summaries) can move quickly. High-stakes decisions (resource allocation, pricing changes, risk assessments) should retain meaningful human review.
Document these governance policies and communicate them clearly. Users who understand how AI works and where the guardrails are placed are significantly more likely to adopt and trust AI-powered tools.
Step 5: Train users in context
Generic AI literacy training has limited impact on tool adoption. Role-specific training like showing a supply chain manager exactly how to use AI anomaly detection in their specific dashboards, or walking a finance analyst through how to interpret AI-generated forecast confidence intervals drives meaningful behavior change.
Step 6: Measure and iterate
Track the metrics you defined in Step 2. Be willing to adjust model parameters, retrain on updated data, and revisit governance policies as you learn. AI BI implementation is not a one-time project, it is an ongoing practice of refinement.
How Zoho Analytics delivers AI-powered BI
Zoho Analytics is an Agentic AI-powered, self-service BI and analytics platform. It is recognized in the Gartner 2025 Magic Quadrant for Analytics and BI, and is built to make advanced analytics accessible to organizations of all sizes - from growing startups to global enterprises, without requiring data science expertise.
Ask Zia - Conversational analytics
Zia is Zoho Analytics' AI assistant. With Ask Zia, users type questions in plain English and receive answers as visual reports or text summaries. Zia understands your data's business context, terminology, metric definitions, relationships between tables, and translates questions into precise queries without requiring SQL knowledge. A sales head asking "What were our top five accounts by revenue last quarter, and how did they trend month over month?" receives an immediate answer.
“Whenever I have a new client meeting, I demonstrate the Ask Zia feature of Zoho Analytics with a question like "what was my income last month?" It's quick reply or a visual fascinates my clients and they say, 'This is what we want'.”
Craig Roxby
Managing Director, Magnifi
Zia Insights - Automated narrative generation
Zia Insights reads your dashboards and reports and generates plain-language summaries of what the data shows. Instead of asking stakeholders to interpret charts themselves, Zia surfaces key trends, notable changes, and significant outliers in written form, making analytics consumption faster and more inclusive across the organization.
Predictive analytics
Zia's predictive analytics capabilities allow users to build and apply forecasting models directly within business dashboards. Select a metric, define your forecast window, and Zia generates projections with confidence intervals, covering revenue forecasts, churn prediction, inventory demand planning, and more. No coding or statistical background is required.
Anomaly detection
Zia continuously monitors your key metrics and alerts you when values deviate from expected patterns. Unlike static threshold alerts, Zia's anomaly detection learns normal behavior dynamically and flags deviations that fall outside learned ranges, catching gradual degradations, unusual combinations, and context-dependent anomalies that rule-based alerting misses.
Automated alerts
Smart alerts in Zoho Analytics notify you when a KPI dashboard crosses a configured condition, like a conversion rate drop, a support ticket spike, a budget overrun. Alerts can be delivered via email, in-app, or integrated with collaboration tools, ensuring that the right people are informed immediately when metrics require attention.
AI-assisted data preparation
Zia assists with data cleaning and enrichment during the import and modeling process. It suggests transformations, identifies data quality issues, and helps connect disparate sources, reducing the manual effort required to get data into an analysis-ready state.
What-If analysis
Zoho Analytics includes What-If analysis tools that let users model hypothetical scenarios by adjusting pricing, marketing spend, headcount, or other variables, and see the projected impact on downstream metrics before committing to a decision. This bridges the gap between prediction and planning.
DSML Studio
For organizations that need custom machine learning models, Zoho Analytics includes a no-code DSML Studio. Users can build, train, and deploy ML models against their data without writing code, then surface model outputs directly in dashboards and reports.
Beyond its AI features, Zoho Analytics offers transparent and affordable pricing, enterprise-grade security and governance, support for both SMBs and large enterprises, embedded and white-label analytics capabilities, and connectivity to over 500 data sources. Zoho Analytics also earned a place in Gartner's 2025 Magic Quadrant for Analytics and Business Intelligence Platforms.
FAQ
Can small businesses use AI in business intelligence?
Yes. Modern AI-powered BI tools, including Zoho Analytics, are designed to be accessible without data science teams or large IT budgets. Small businesses can start with natural language querying and automated alerts, scaling into predictive analytics and anomaly detection as their data maturity grows.
Which industries benefit most from AI-powered business intelligence?
Retail, financial services, healthcare, marketing, and supply chain operations see particularly strong returns from AI in BI, given the volume, velocity, and complexity of their data. However, any industry with recurring reporting needs, forecasting requirements, or large datasets can benefit from AI-powered analytics.
What are the main challenges of implementing AI in business intelligence?
The most common challenges are data quality issues (which undermine model performance), skills gaps in both technical and business roles, difficulty building organizational trust in AI-generated insights, and integration complexity when connecting AI tools to fragmented data infrastructure.
What is the difference between AI and traditional business intelligence?
Traditional BI is descriptive and reactive. It shows what happened in response to human queries. AI-powered BI is predictive, prescriptive, and increasingly proactive. It forecasts future outcomes, recommends actions, and surfaces insights without waiting to be asked. The two approaches are complementary rather than competing.
How does AI improve data analysis in BI tools?
AI improves data analysis by automating pattern recognition at scales humans cannot match, enabling natural language interaction that removes technical barriers, generating forecasts and anomaly alerts continuously, and producing plain-language explanations of what the data means — reducing the time from data to decision for both technical and non-technical users.
 Vinisha
Vinisha is a Marketing Analyst at Zoho Analytics with a strong passion for both marketing and data. She’s naturally curious about trends and loves diving into data to uncover what drives effective campaigns. She has a knack for simplifying complex information and presents insights in a relatable and engaging way that connects with audiences. Outside of work, she enjoys exploring the creative side of digital marketing.