How to Build Financial Reporting Dashboards for QuickBooks (Online and Desktop)
- Last Updated : July 21, 2026
- 340 Views
- 5 Min Read
QuickBooks records every invoice, payment, and expense neatly. What it doesn't do well is help you see the story those numbers are telling. Ask it which customers drive your profit, or what cash looks like over the next 60 days, and you'll end up running three or four built-in reports, exporting to a spreadsheet, stitching them together by hand, and starting over next month.
A financial dashboard fixes that. It pulls your QuickBooks data into one live view, refreshes on its own, and lets anyone on your team read the numbers without logging into QuickBooks. This guide covers what a good one contains, the realistic ways to build it from QuickBooks Online or Desktop, and a step-by-step walkthrough.
What belongs on a QuickBooks financial dashboard
Get clear on what you're building before you pick a tool. Most businesses running on QuickBooks need four views.
1. Profit and loss. Revenue, COGS, gross profit, operating expenses, and net income shown as a monthly trend. A single column tells you nothing. The trend is the point.
2. Cash flow. Cash in versus cash out, operating cash flow, and your cash position over time. Add a short projection from open invoices and upcoming bills to this list.
3. AR and AP aging. Who owes you, what you owe, sorted by how overdue. Pair the AR view with days sales outstanding so you can see whether collections are getting slower.
4. Revenue and expense breakdown. Revenue by customer, by product or service, and by period. Expense by category and vendor. This is where the real decisions come from and usually where the surprises live.
Put four or five headline KPIs at the top: gross margin, net margin, DSO, burn rate. That's the at-a-glance read a CFO or owner wants before they look at anything else.
The three realistic ways to build it
1. Native QuickBooks reports. Both QuickBooks Online and Desktop ship with built-in reports and a snapshot screen. They're free, already connected to your data, and fine for the basics. Customization is shallow, as you can't blend in data from outside QuickBooks. Sharing with people who don't have a login is awkward. If your reporting needs are simple and stay inside QuickBooks, this may be enough.
2. Spreadsheets. Export to Excel or Google Sheets and build charts there. Full control, no new tools to learn. The catch is that every refresh is manual, formulas break when export formats shift, and version control gets messy fast. Useful as a prototype, but hard to sustain.
3. A BI tool connected to QuickBooks. This is the route that scales. A BI platform connects to QuickBooks on a schedule, pulls the data automatically, and lets you build dashboards once. You can blend QuickBooks data with your CRM, ad spend, or operations data, and share a live link with people who never touch QuickBooks.
The rest of this guide uses Zoho Analytics for the walkthrough. It connects to both QuickBooks Online and Desktop, includes more than 50 prebuilt financial reports so you're not starting from a blank canvas, and has a free plan.
Building a QuickBooks financial dashboard in Zoho Analytics
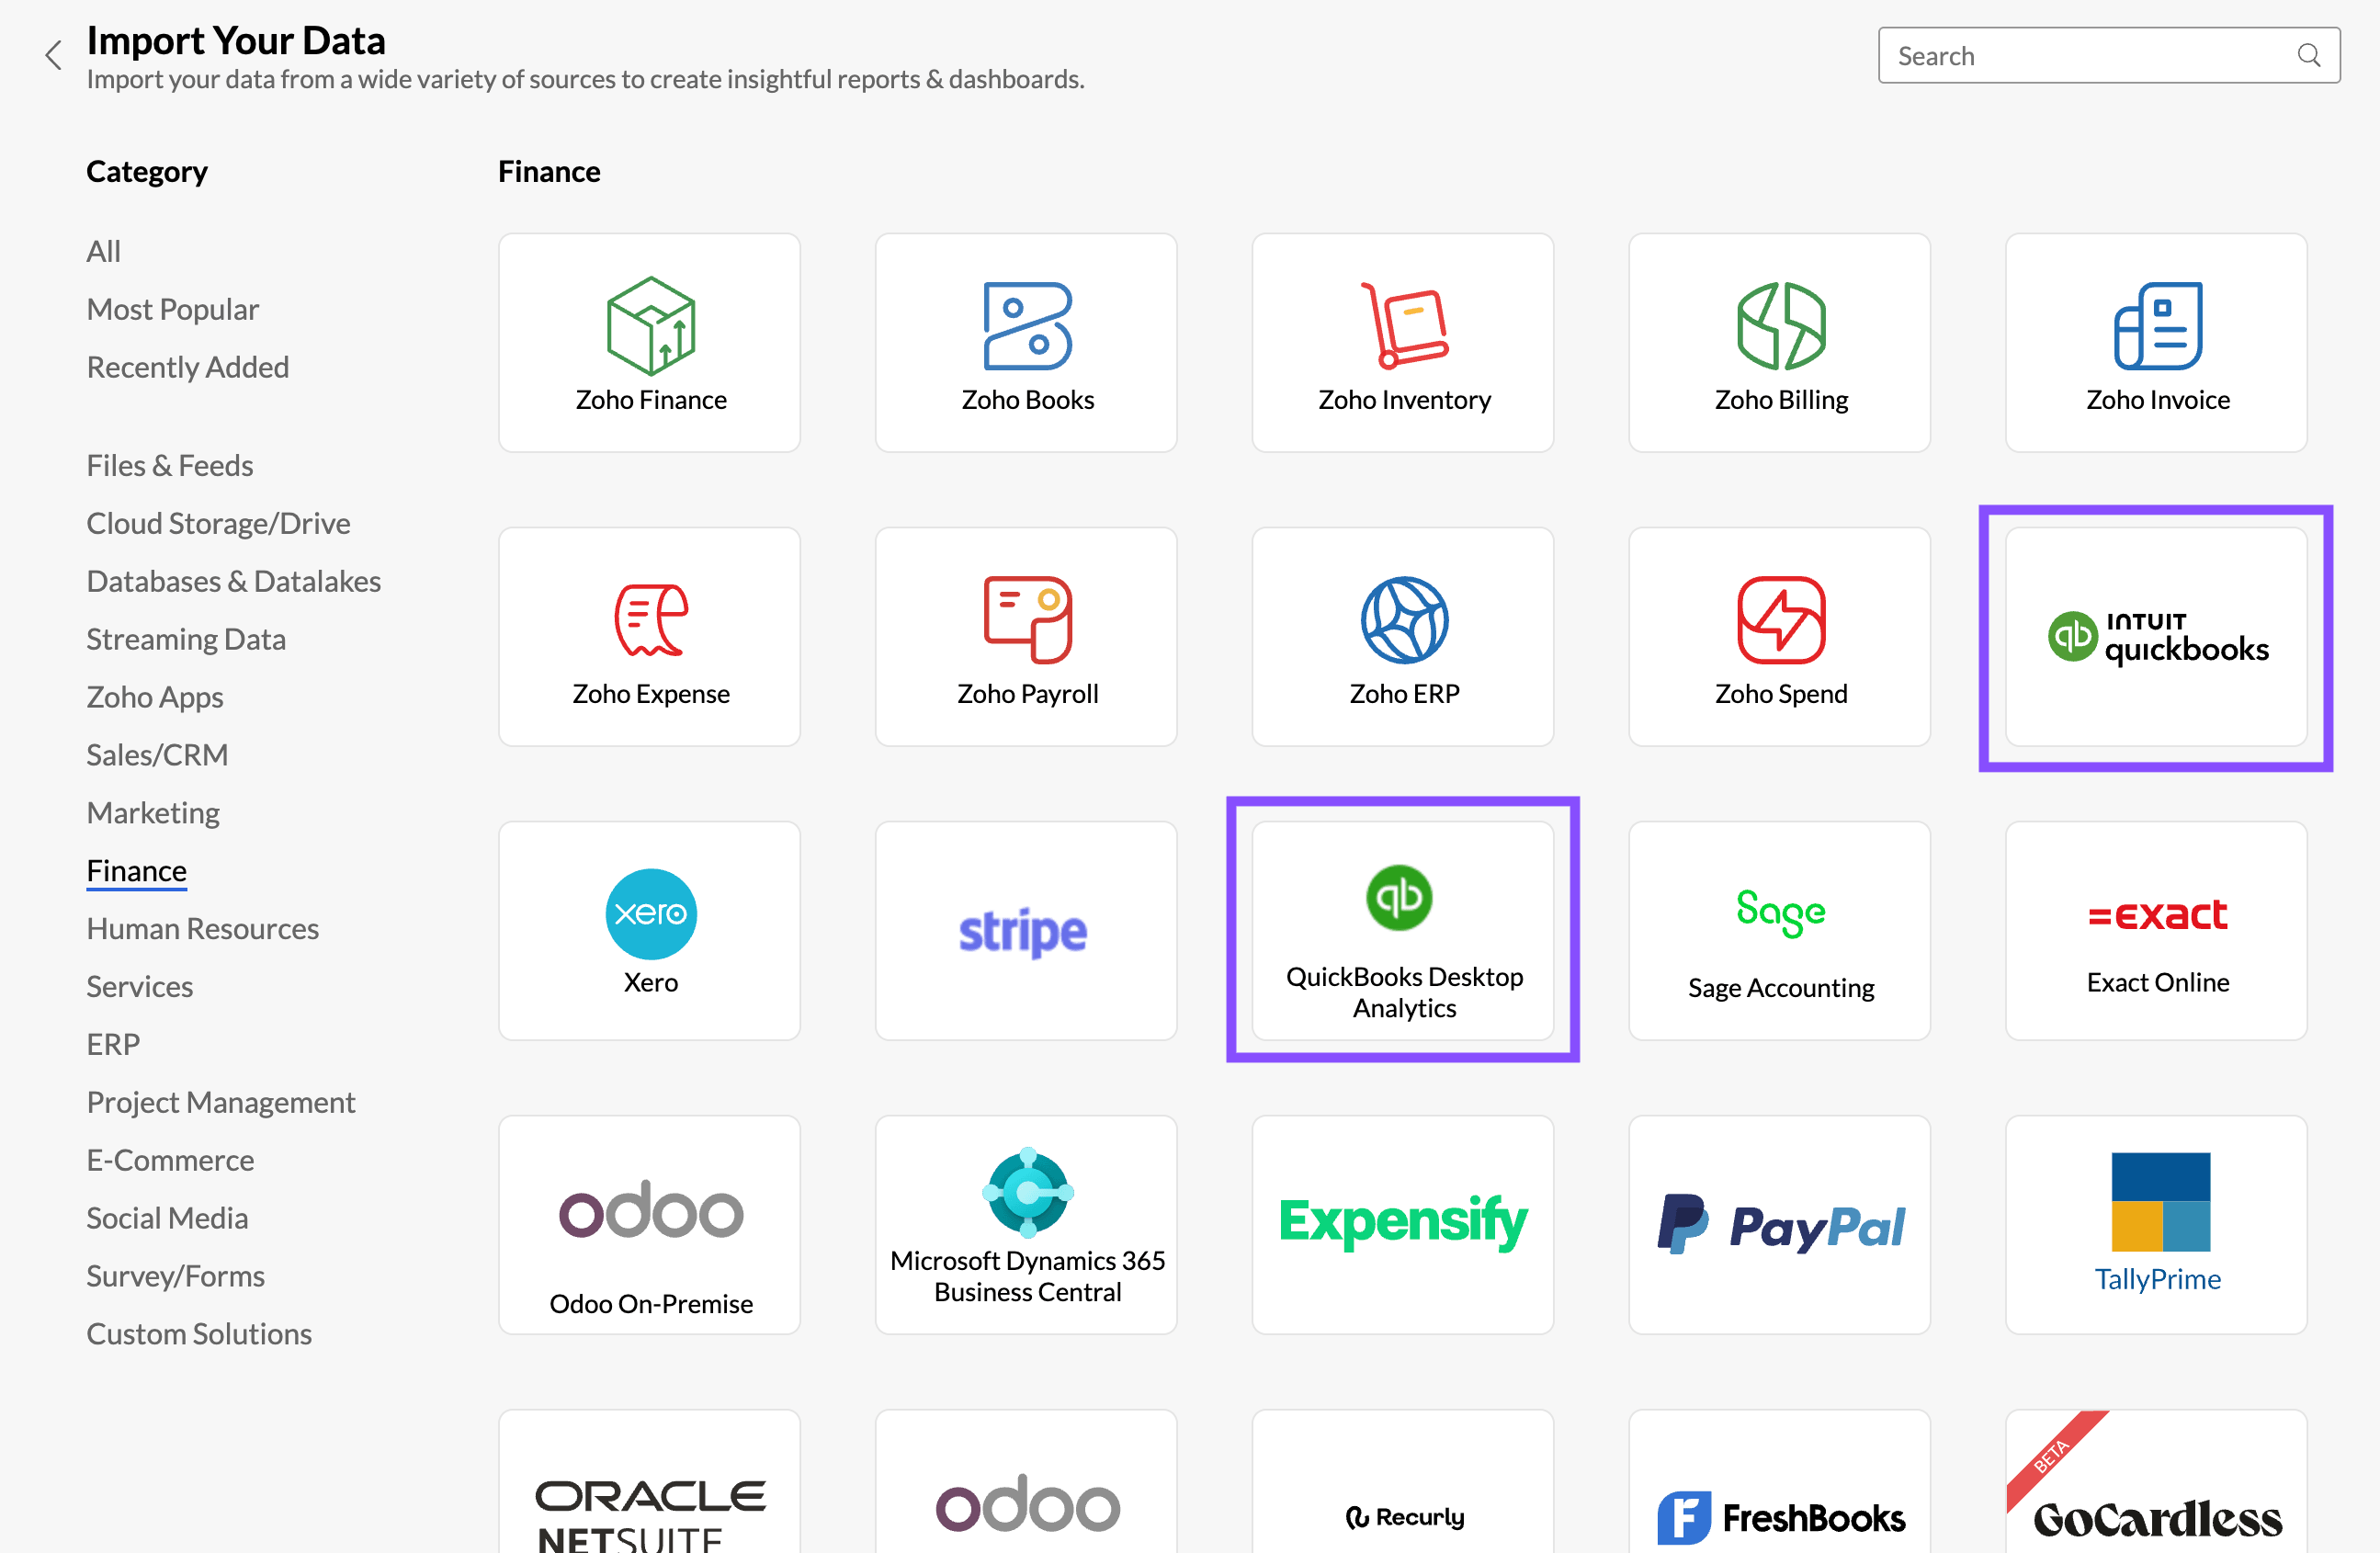
1. Connect QuickBooks. Create a new workspace in Zoho Analytics and choose the QuickBooks connector (Online or Desktop). Authorize access to your account, and select the data to bring in: invoices, bills, customers, line items, expenses, purchase orders, vendors etc. The connector sets up a sync schedule, so the data refreshes without manual exports.
2. Open the prebuilt reports first. Once the data syncs, you get more than 50 ready-made reports and dashboards covering invoices, profit and loss, purchases, and accounting performance. Open them before you build anything. In most cases, the dashboard you planned to build already exists.
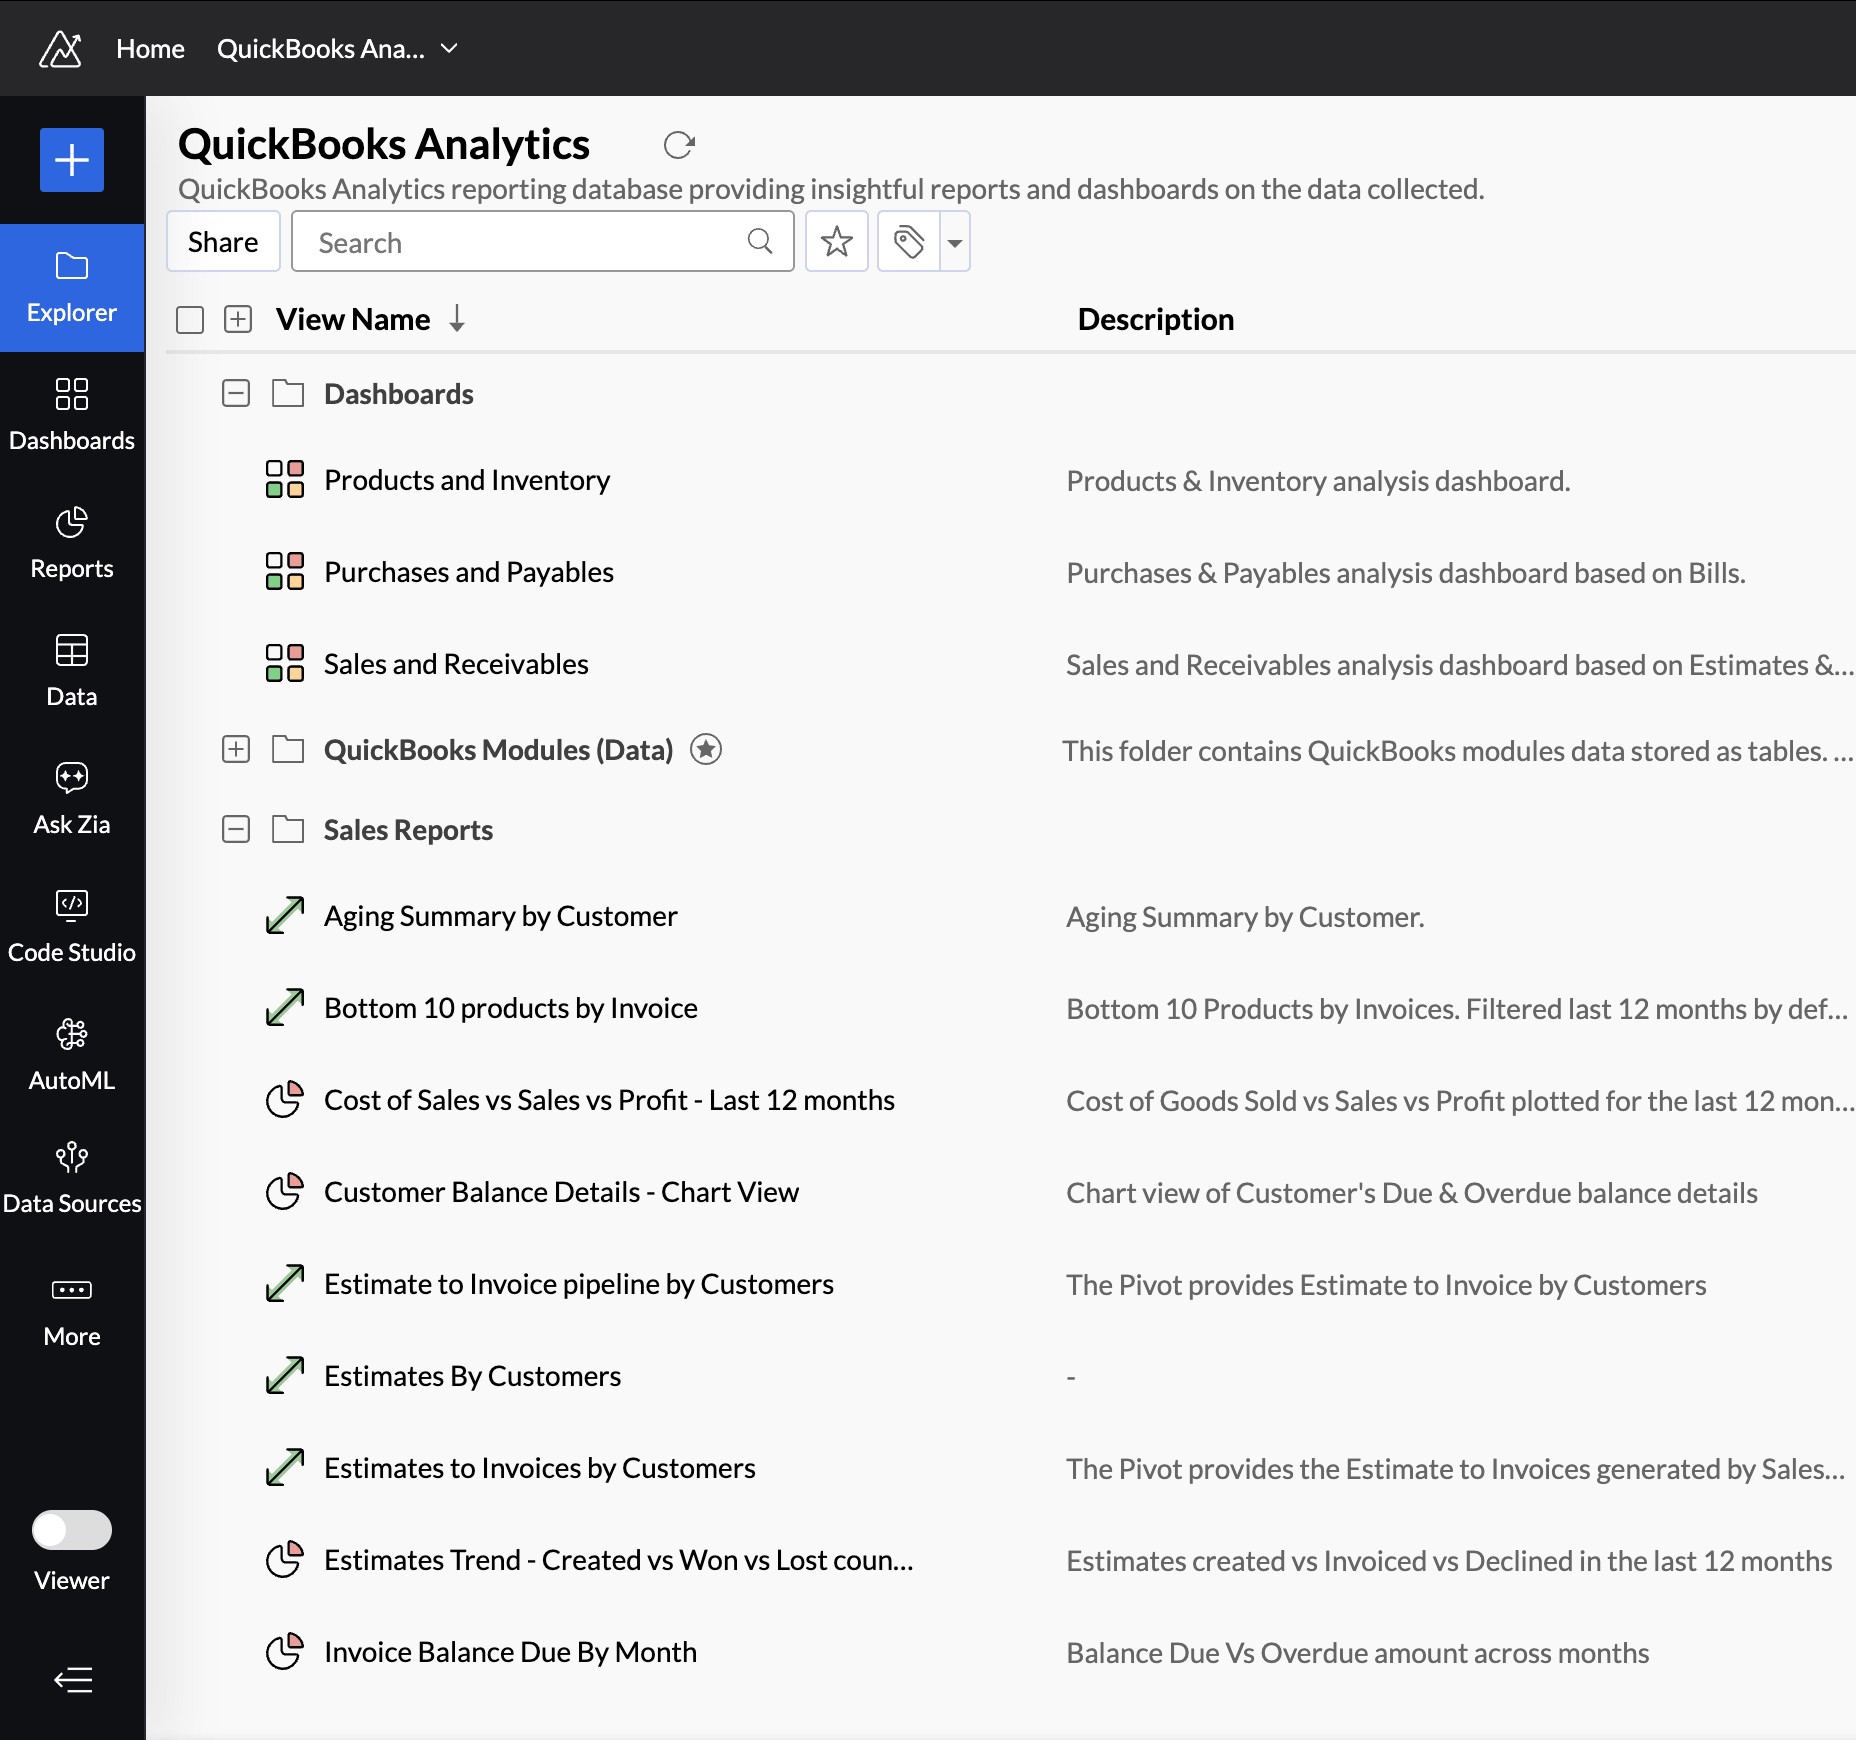
The Zoho Analytics QuickBooks connector comes with a default set of reports and dashboards
3. Customize to your question. Take a report you need and reshape it. Add a month-over-month trend, a gross margin percentage, and a filter for the period you care about. The builder is drag and drop, and you can include or exclude the required columns (fields).
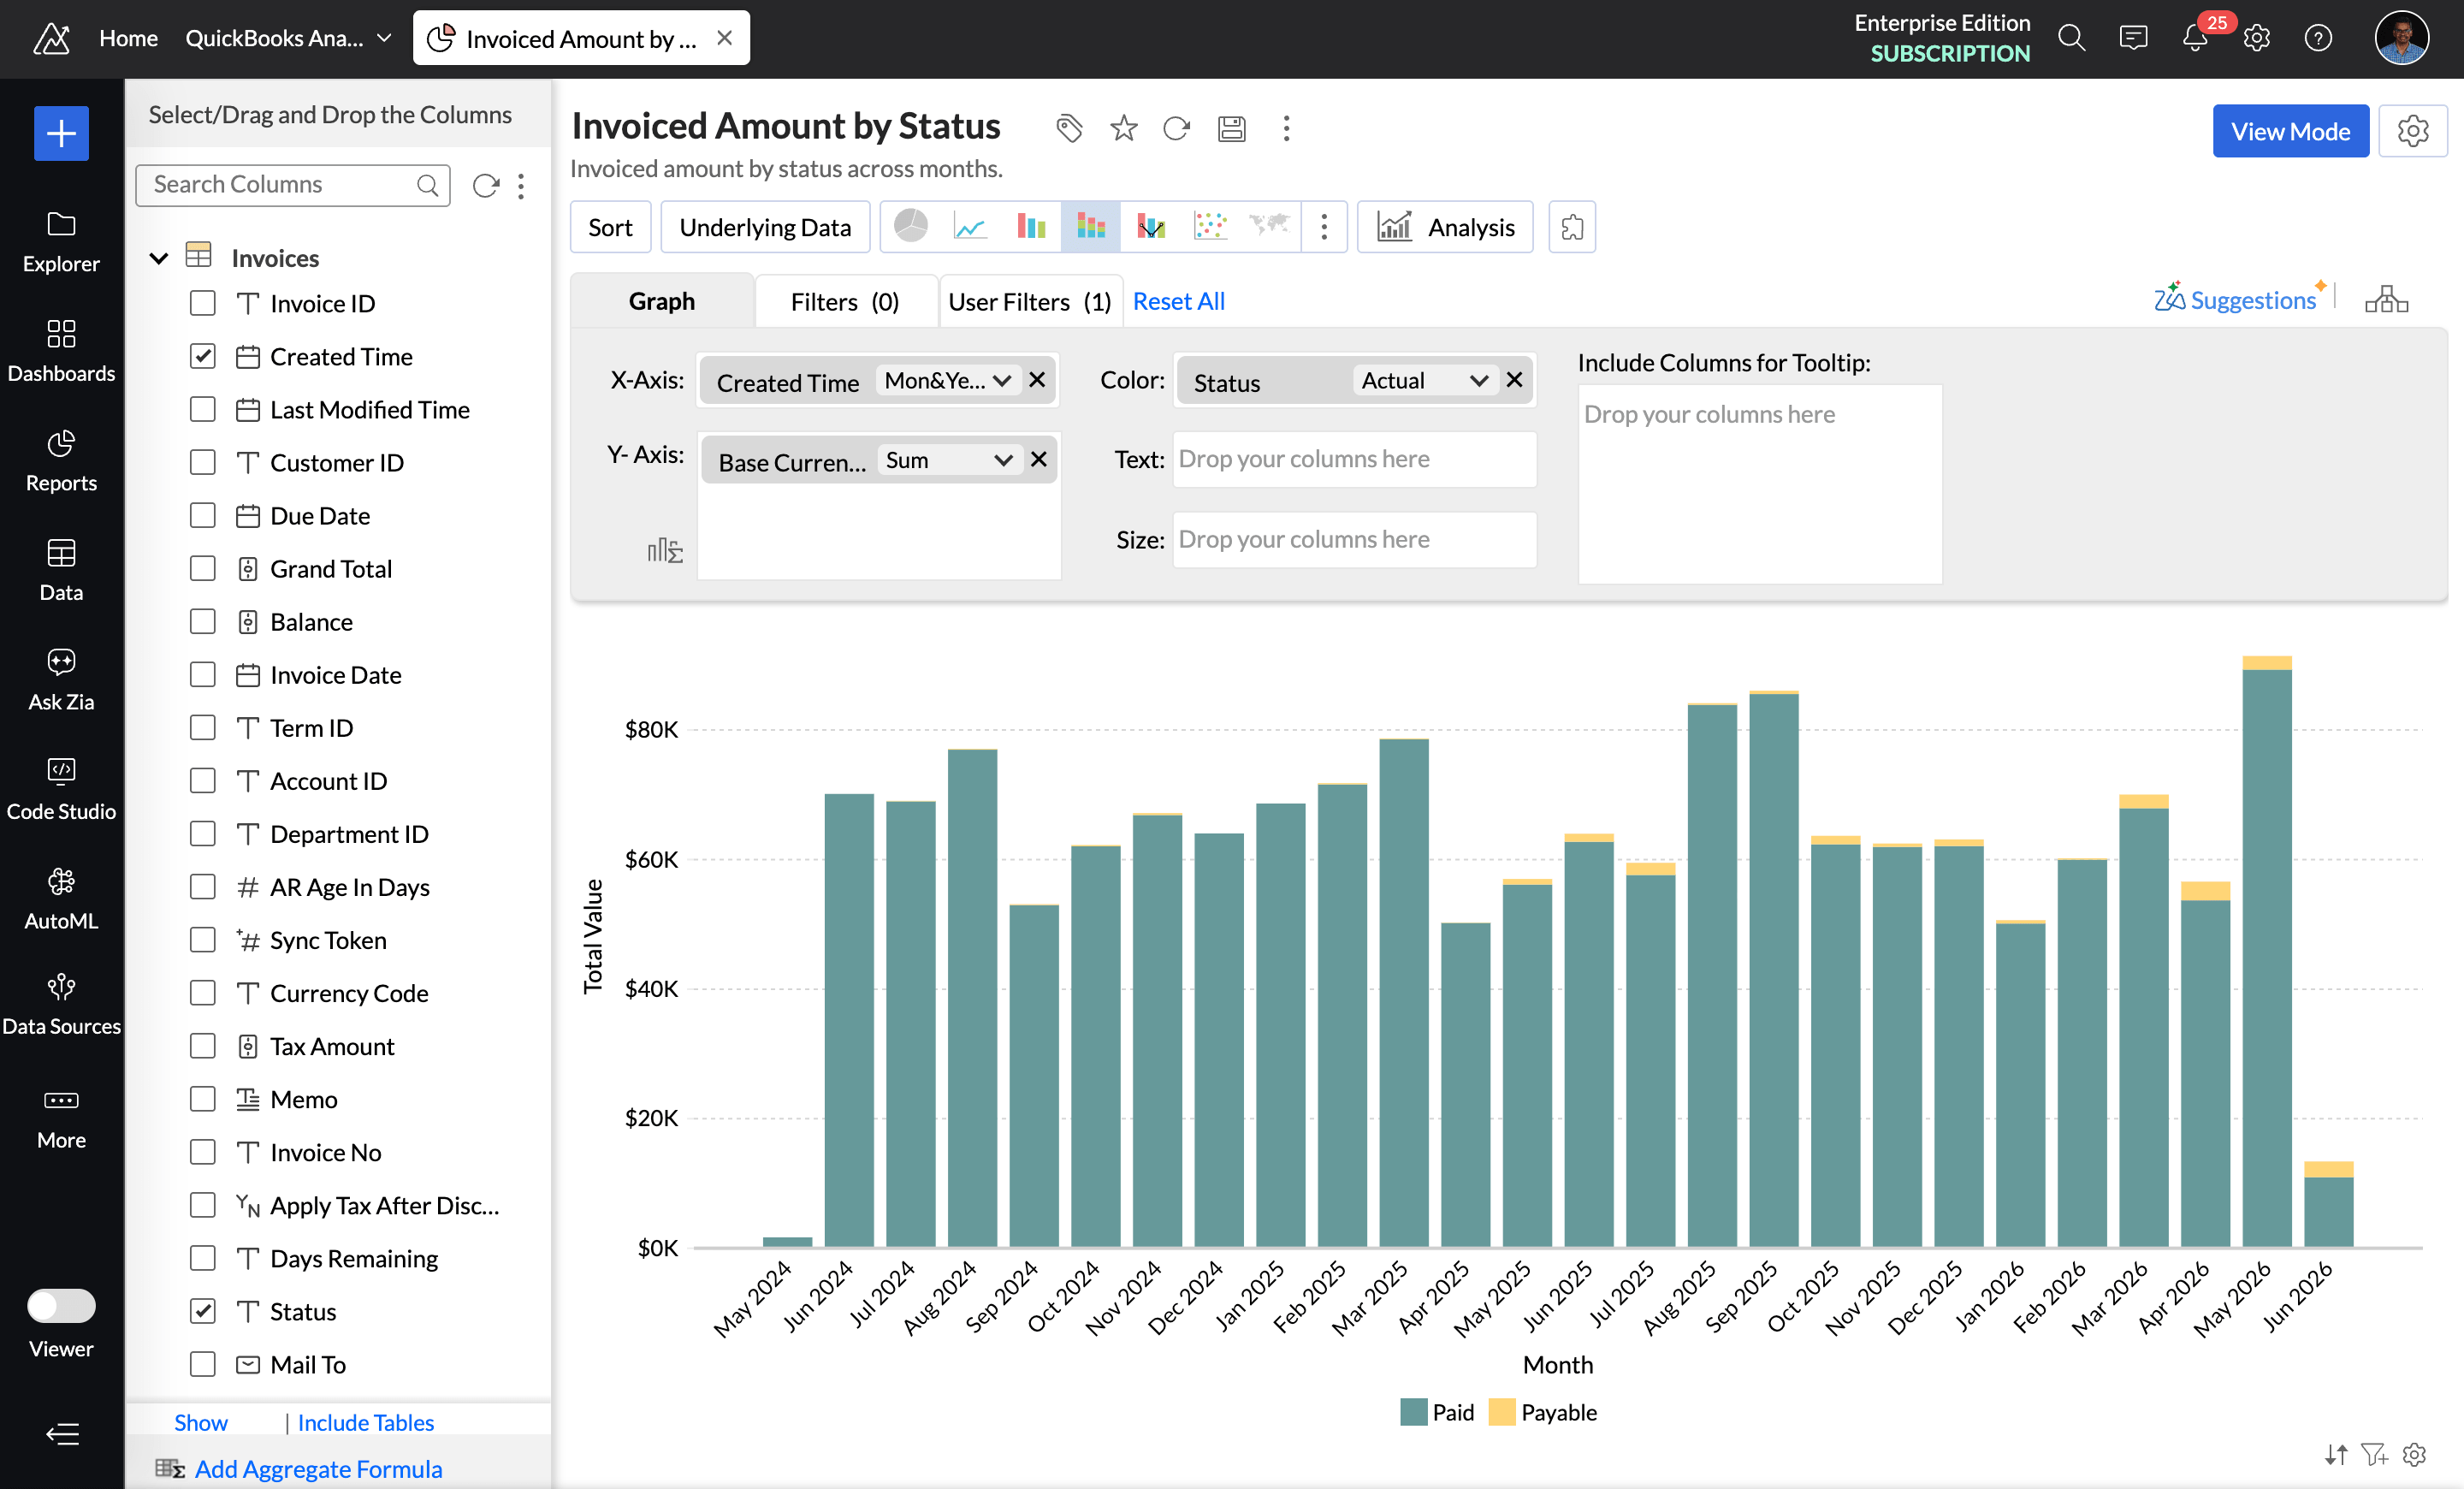
Drag-and-drop report builder in Zoho Analytics
4. Assemble the dashboard. Pull your saved views onto one dashboard: P&L trend, cash position, AR aging, top customers by revenue, and a row of KPIs across the top. Arrange them so the most important number is the first thing a reader sees. Think of it as a short story: summary at the top, and details below.
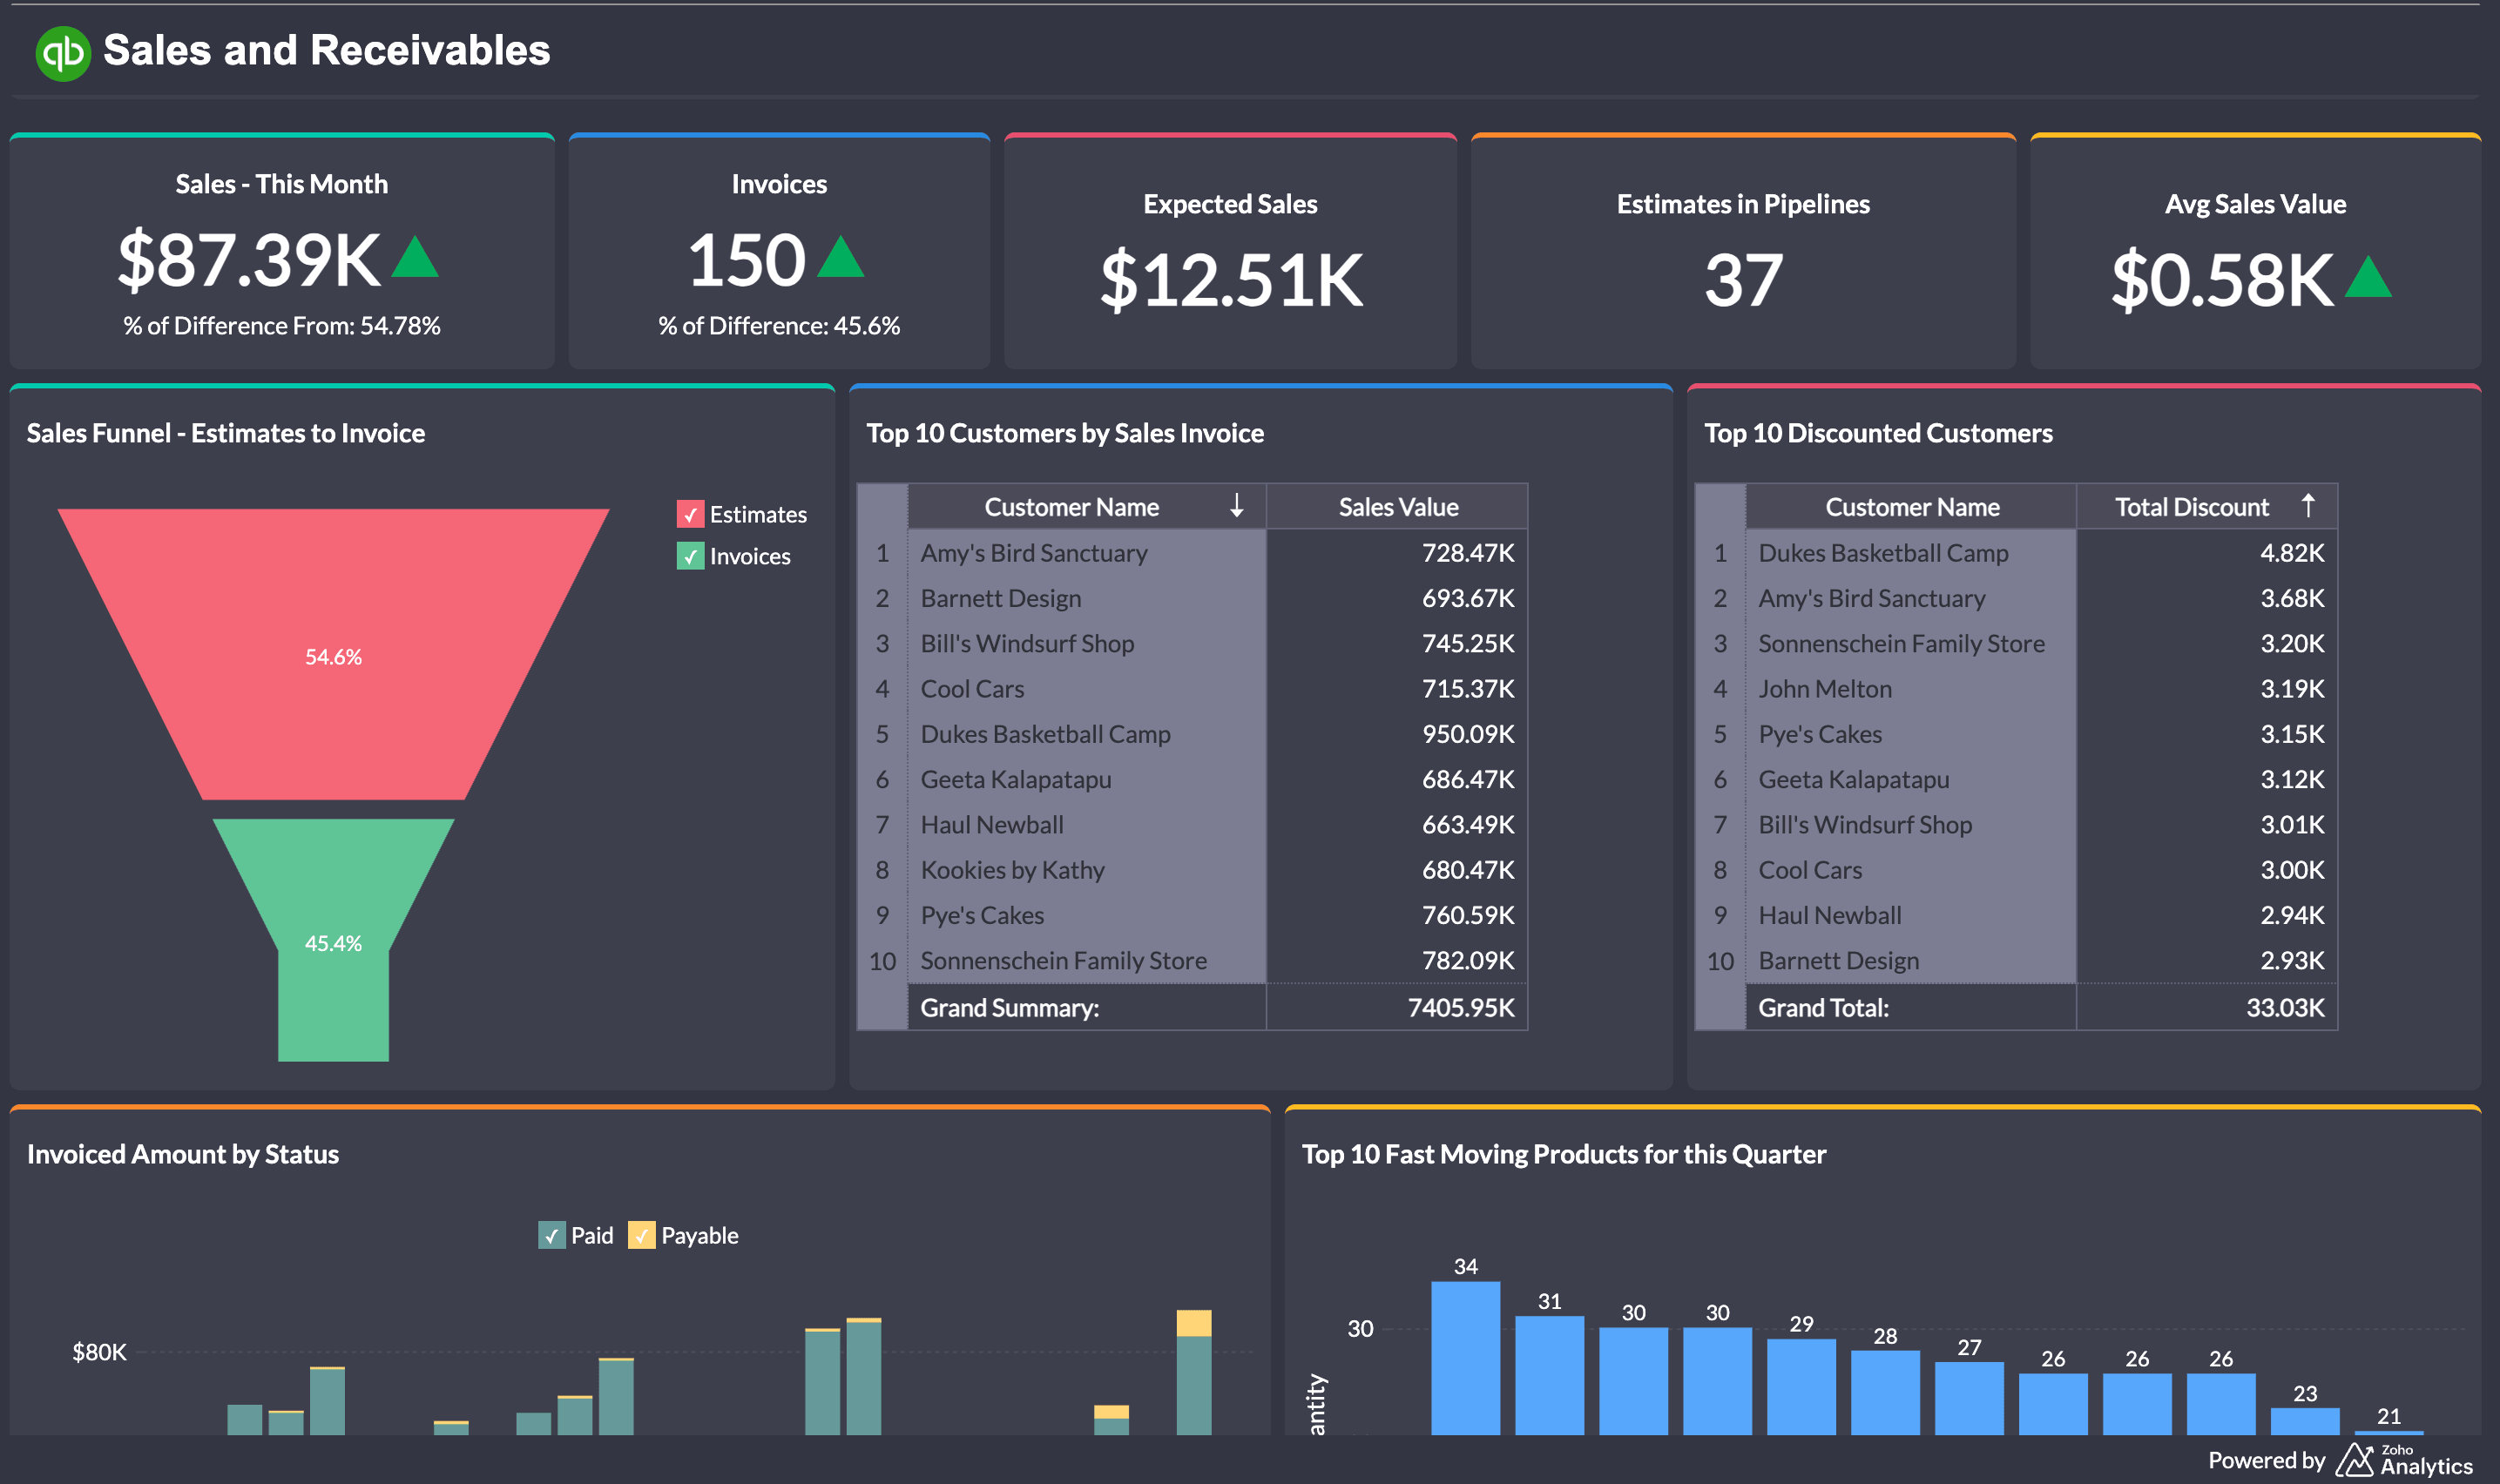
A sample QuickBooks dashboard created in Zoho Analytics
5. Ask questions in plain language. If you'd rather not build a chart from scratch, type your question into Zia, the built-in AI assistant. "What was my revenue by customer last quarter?" returns a chart. It's faster than hunting for the right fields and a good way to explore before committing a view to the dashboard.
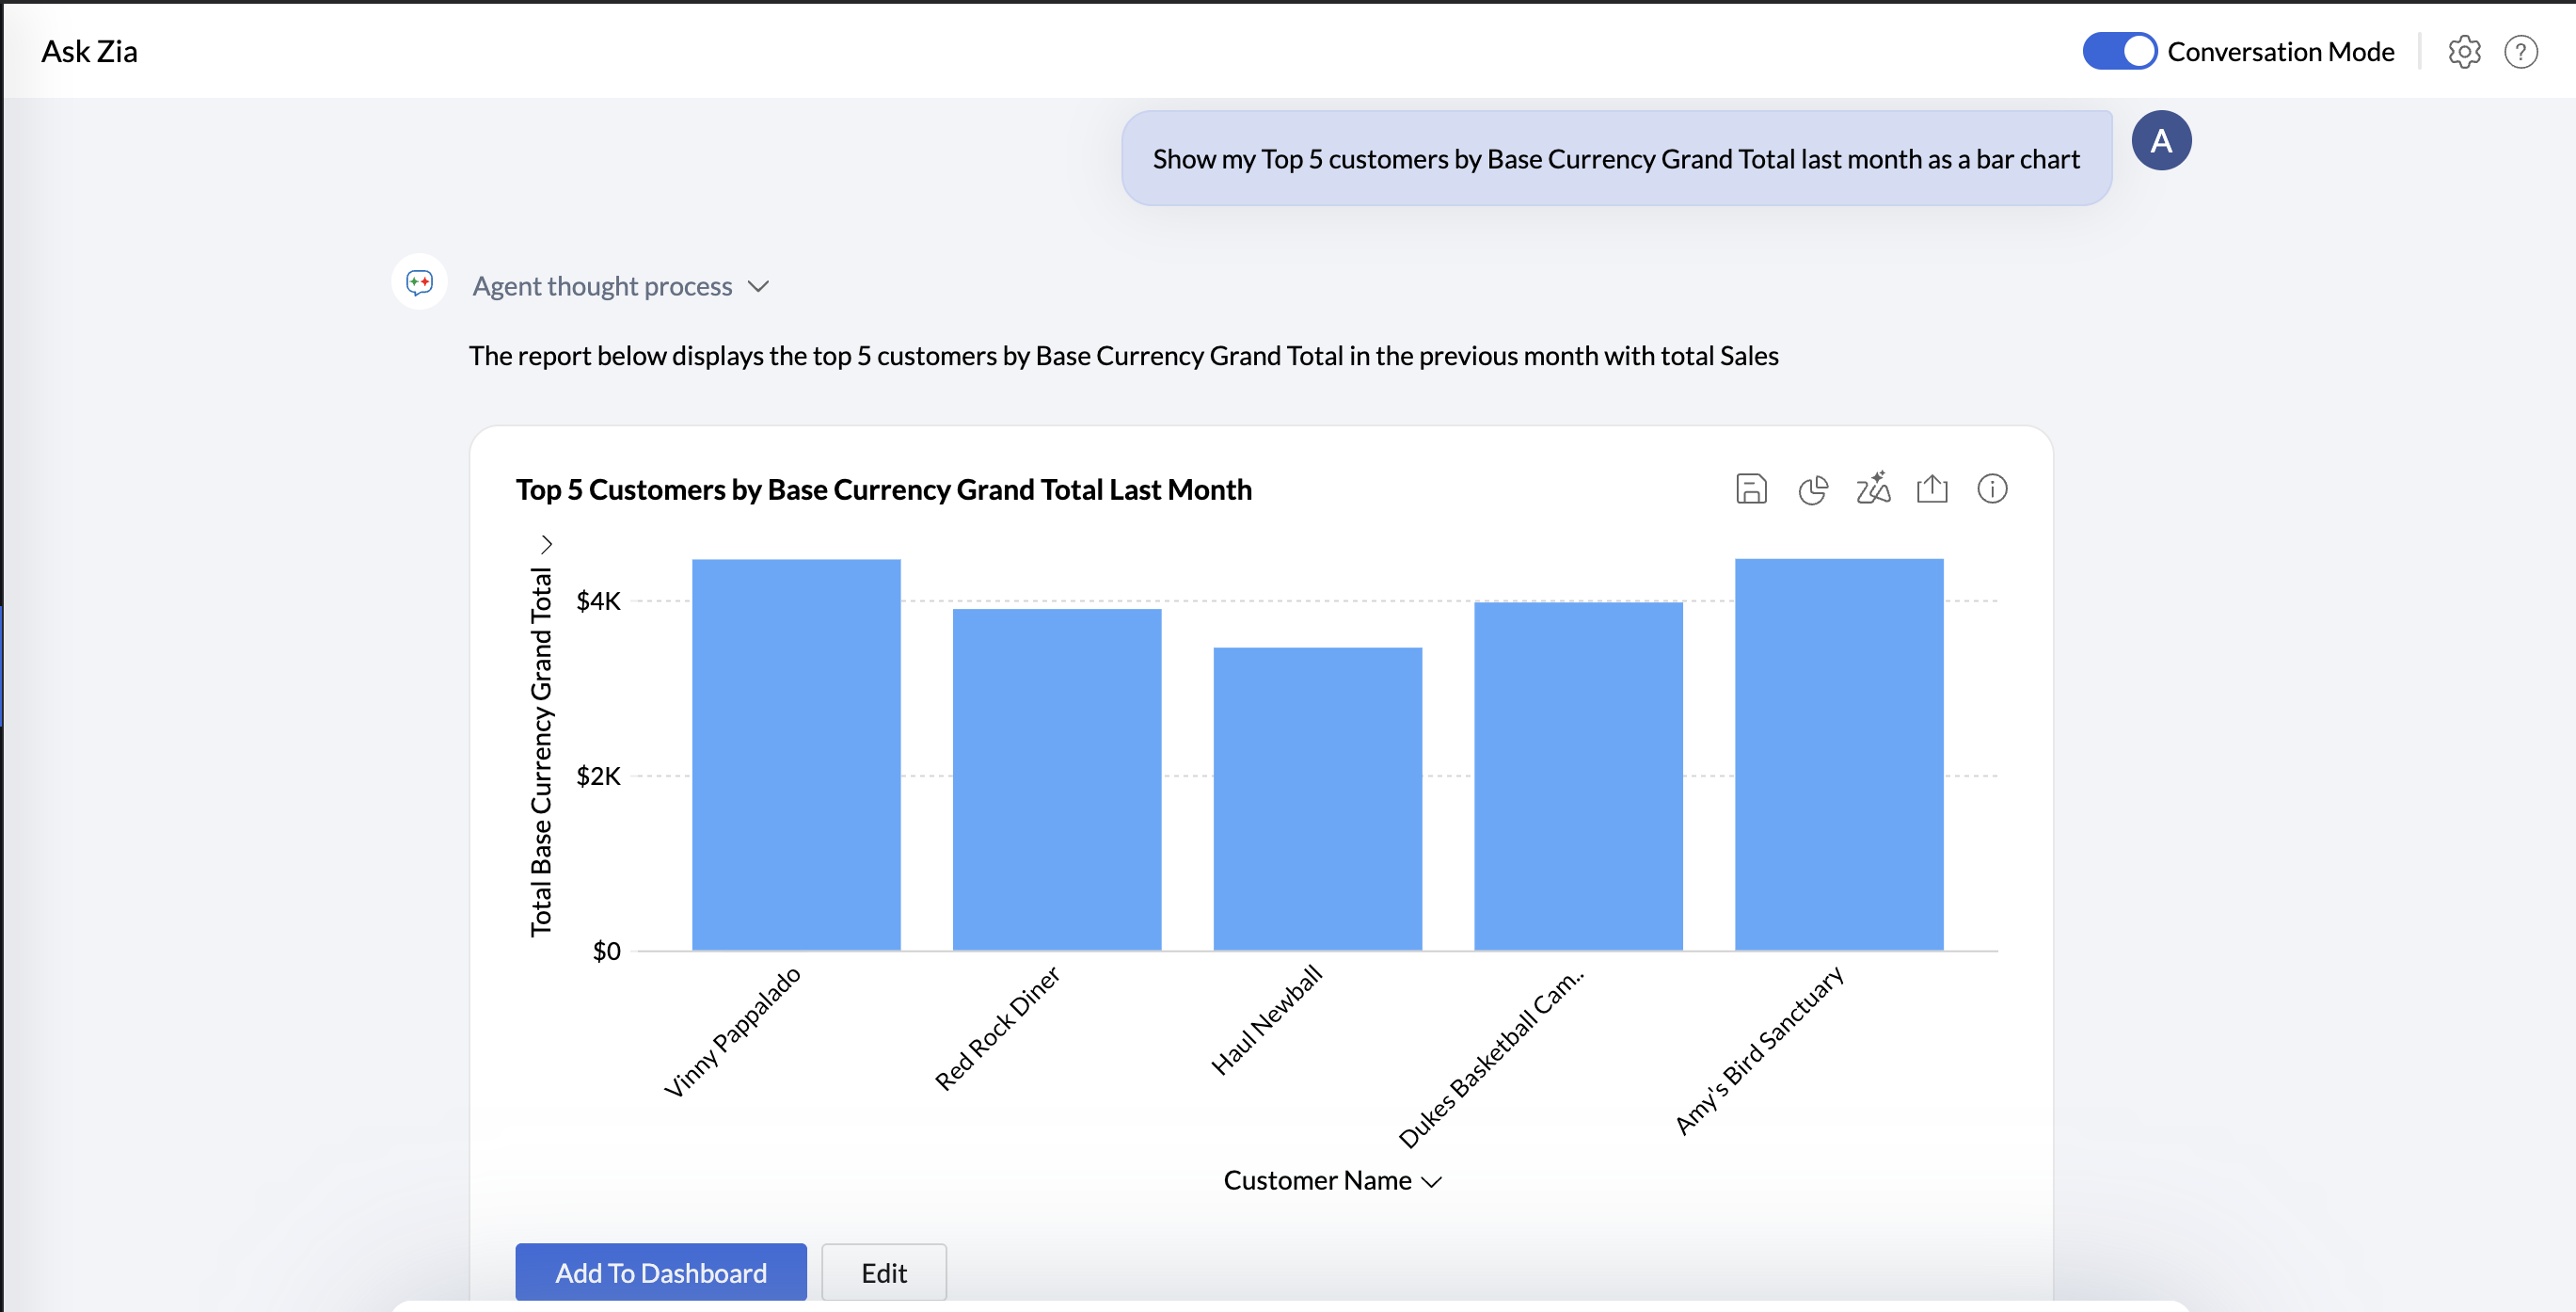
You can ask questions to Zia and get appropriate responses
6. Set the refresh, alerts, and sharing. Daily sync is enough for most finance teams. Set alerts on the numbers that matter (e.g., a cash dip, overdue invoices etc) so you hear about them without checking manually. Share a scheduled email, a private link, or an embed in another tool. Readers never need a QuickBooks login.
The four dashboards to build first
If you want a short list rather than a blank page:
- P&L dashboard. Monthly revenue, expense, and net income trend plus gross and net margin. Your overall health check.
- Cash flow dashboard. Cash in versus out, operating cash flow, cash position over time. Add a short projection from open invoices and bills if you can.
- AR dashboard. Aging breakdown and days sales outstanding. Shows who's overdue and whether your collection speed is slipping.
- Revenue analysis dashboard. Revenue by customer and by product or service. This one usually surfaces that a single customer accounts for more of your income than you realized.
Build those four, get them refreshing on their own, and you've replaced most of the manual work that eats the end of every month.
Not sure which chart type to use for each view? Here's a guide to financial data visualization types and when to use them.
Keeping the dashboard useful
Pick a review cadence and stick to it. Weekly or monthly, whatever fits based on how your team works. Label everything in plain language, so that a sales manager or owner without a finance background can read it. And keep it short: six clear views beats thirty that nobody can take in at a glance.
The bigger payoff of building this on top of QuickBooks rather than inside it: your reporting is no longer trapped in the accounting system. You can put QuickBooks revenue next to your CRM pipeline or ad spend and see how the parts of the business connect. That's a question QuickBooks was never built to answer on its own.
Get started
You can build all of this on the free trial plan of Zoho Analytics and see your own QuickBooks data in a dashboard in under an hour. Start free with Zoho Analytics and connect your QuickBooks account, or see how the QuickBooks connector works first.
 Aravind
Aravind leads content and inbound marketing for Zoho Analytics, where he's focused on the embedded analytics and ISV segment. He's been writing about business intelligence, SaaS, and data products for Zoho since 2005, making him one of the longest-running voices in the Indian B2B SaaS content space. Connect with him on LinkedIn.