Track Business KPIs with KPI Dashboard Software
Track the metrics that matter most with powerful KPI dashboards. Gain real-time visibility into business performance, make faster decisions, and keep your teams aligned.
Sign up in less than 60 seconds
KPI tracking tool that empowers your business
With KPI dashboards, you can access, analyze, and monitor all your KPIs from one place. They also allow you to track business progress towards goals set.
-
Track business performance
Measure and monitor your organization's performance with powerful data visualizations and ensure it's on the right path in real-time.
-
Predict problems earlier
Forecast business' progress and growth with the help of advanced technologies such as AI, and find out problems that may arise in the future.
-
Make decisions at the right time
By using insights and predictions collected, make the right decisions and plan or revisit your strategies.
Want to see sample KPI dashboards before getting started with your own? We've prepared a list of KPI dashboards based on multiple use cases.
See KPI Dashboard ExamplesCreate KPI dashboards in 3 simple steps
-
Step 1: Import your data
Connect and import data from business apps, databases, files, cloud drives, and live feeds.
-
Step 2: Build KPI reports
Create insightful KPI reports using charts, widgets, pivot tables, summaries, and visual analytics tools.
-
Step 3: Create and share KPI dashboards
Combine reports into interactive KPI dashboards and securely share them with your team in real time.
Create your first KPI dashboard with Zoho Analytics
Sign up for freeKPI dashboard tool features for insightful reports
Make use of a variety of charts, widgets, pivot, summary and tabular views, and create insightful KPI reports and dashboards with our KPI software.
Easy-to-build dashboards
Combine multiple reports into tabbed BI dashboards, using a drag-and-drop designer. Insert images, formatted text, widgets, and web components in a flexible designer layout. Make it easier for your executives and users to track KPIs (Key Performance Indicators) effectively.
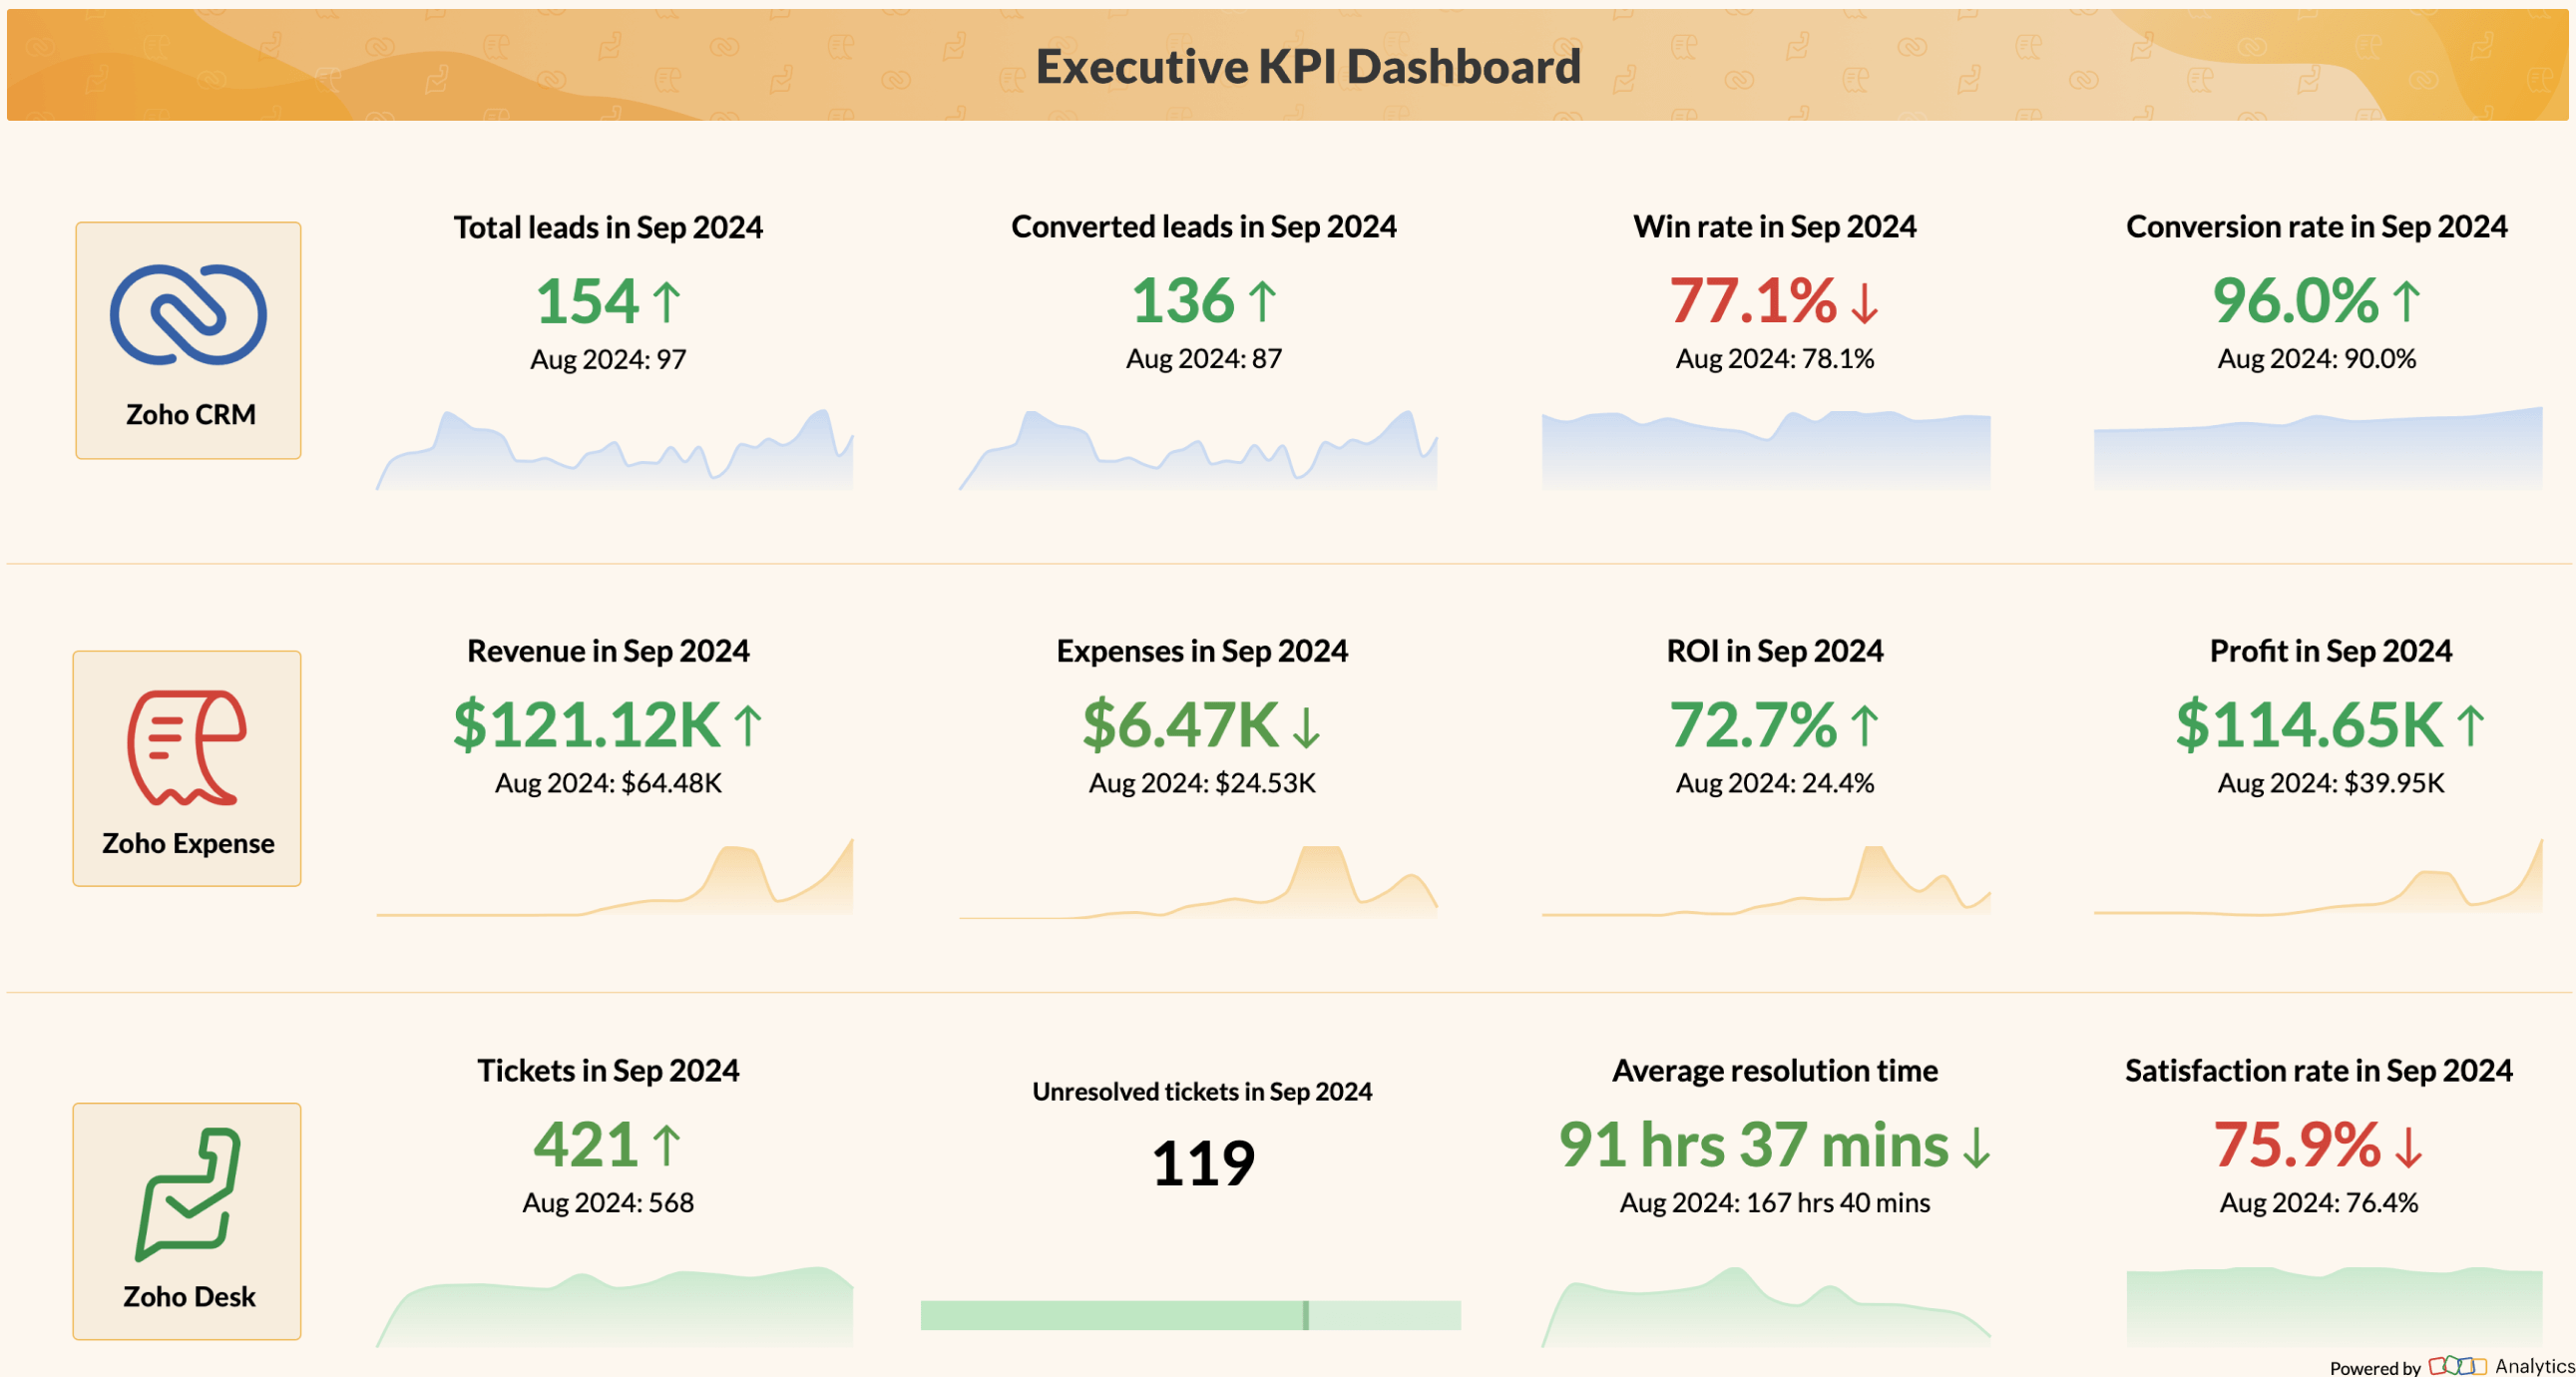
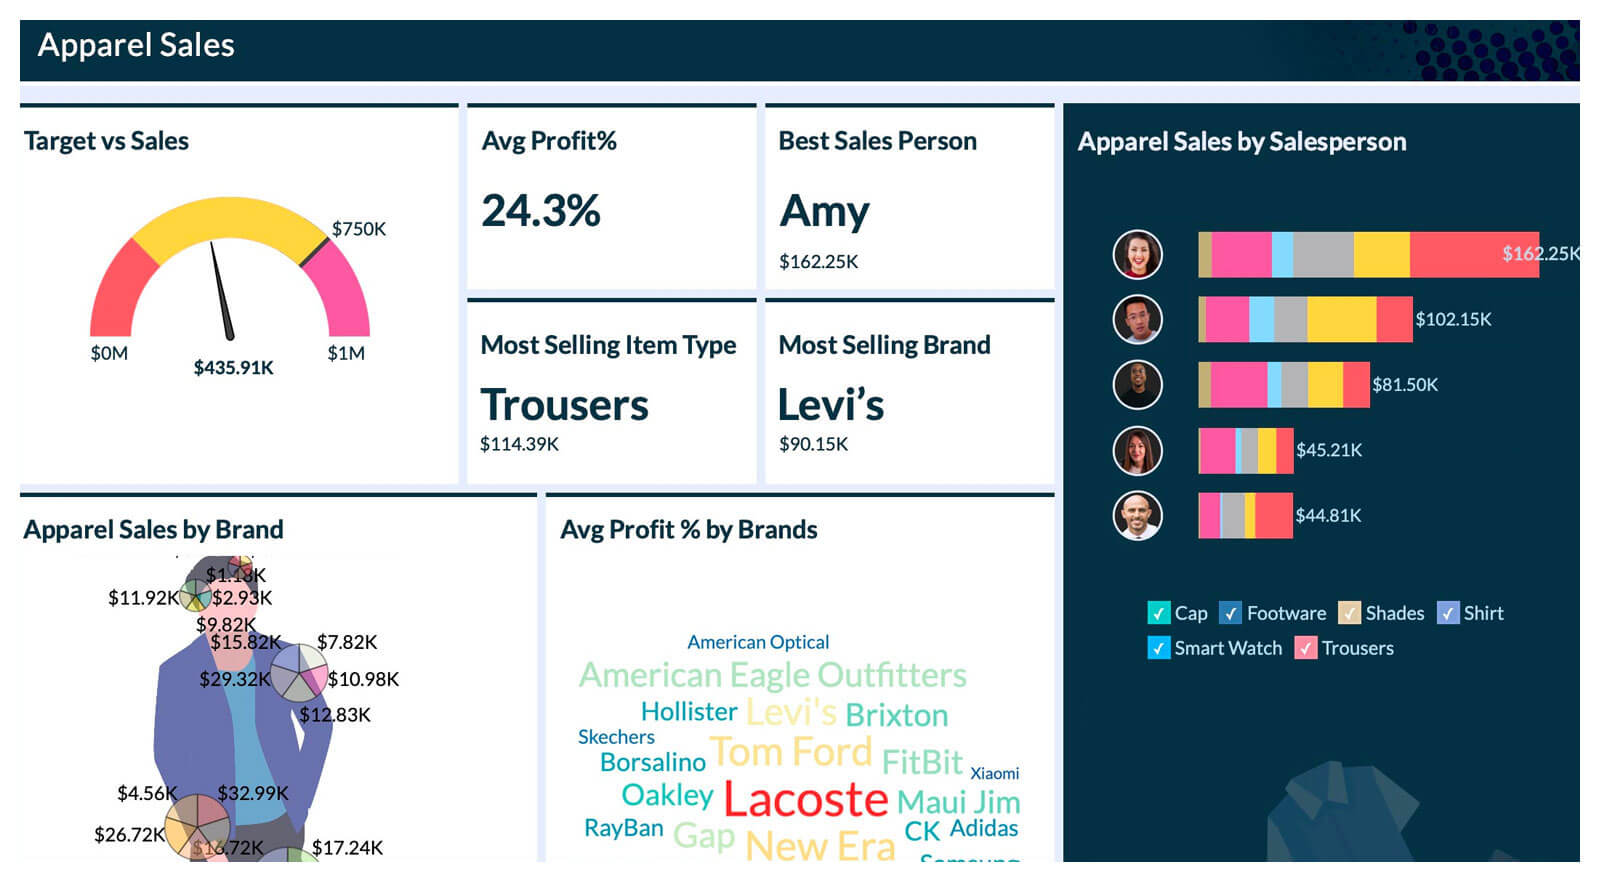
Image-based visualizations
Plot location data spread over custom image boundaries like basketball courts, city parking lots, roads etc. Include creative image visuals in your KPI dashboards to enhance visual appeal and readability.
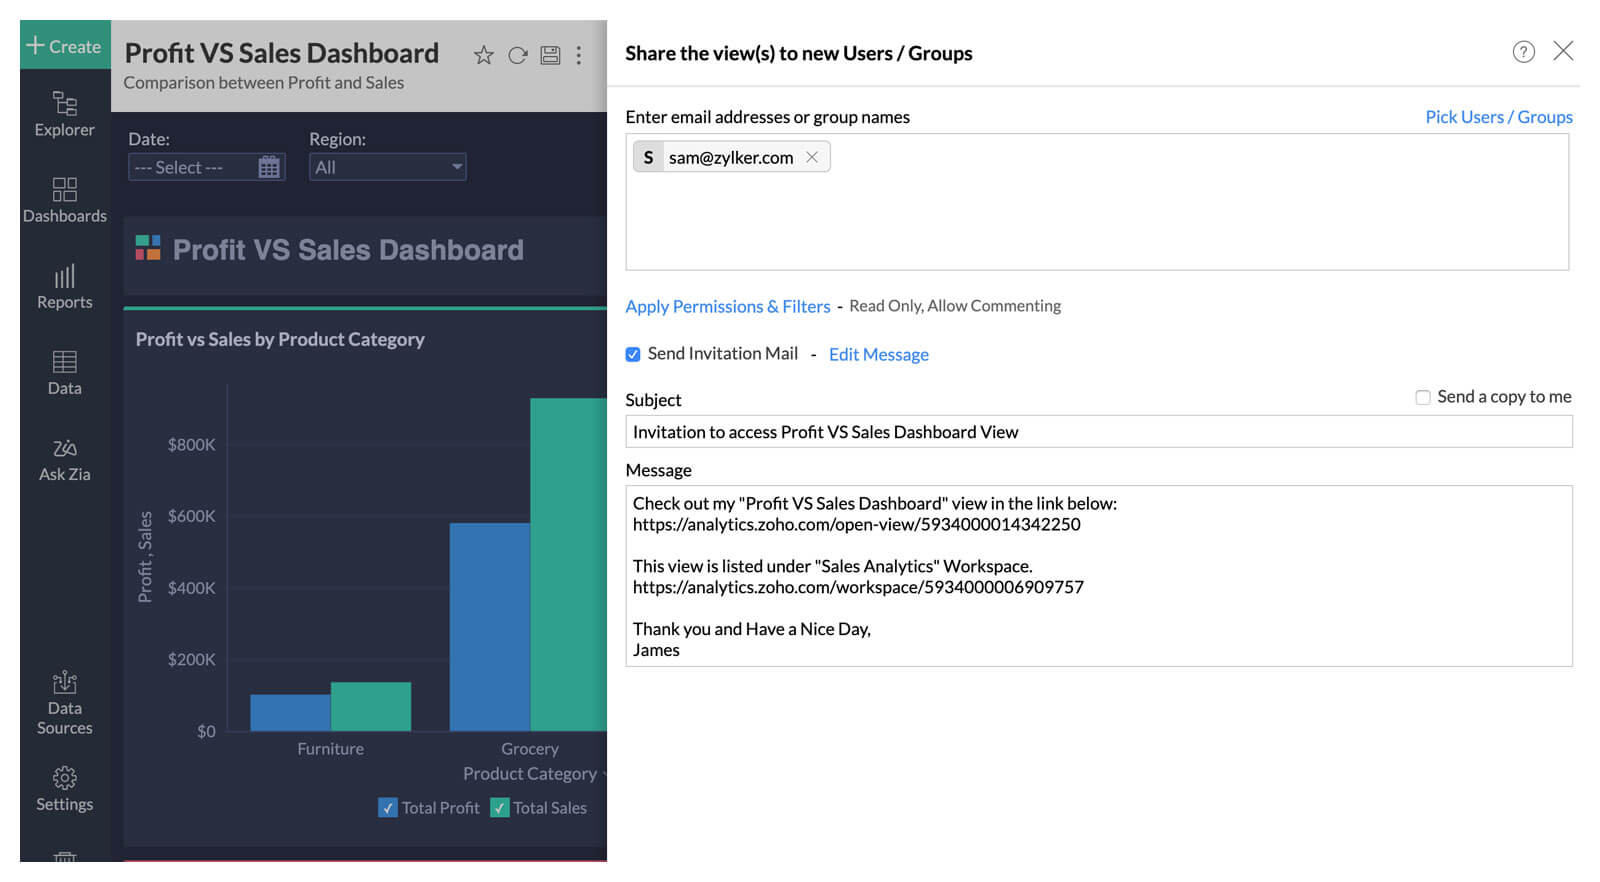
Fine-grained access control
Have full control over what your colleagues or clients can see and do with the dashboards you share. Avail fine-grained access control with specific options like read-only, read-write, report authoring, drill-down, export and much more.
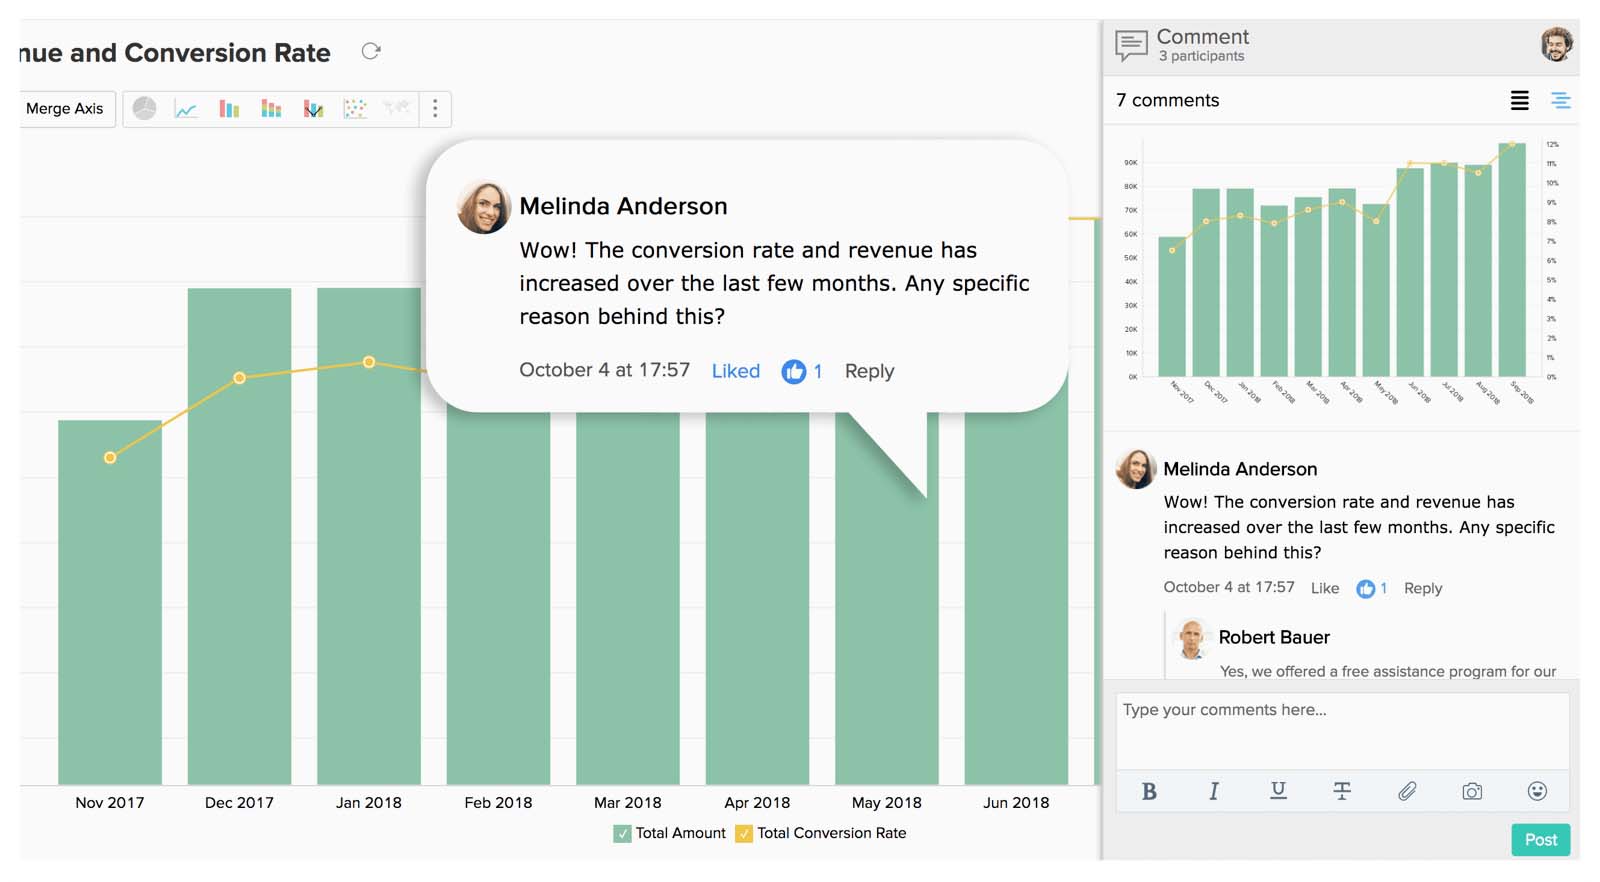
Effective Collaboration
Start a contextual comment thread from inside your KPI dashboards and instantly collaborate with your peers. Add and annotate images, and see the entire comment history anytime, anywhere.
Publishing and embedding
Publish your KPI dashboards and make them accessible to users with/without logins. Embed reports and dashboards across websites, intranets, blogs and applications for wider consumption.

What users say about our KPI dashboarding
"Zoho Analytics enabled us to create KPIs with complex business logics built-in. It's easy enough but at the same time quite powerful for a marketer to use. Personally, it's my number one tool for reporting."

"The ability to blend data, filter, and build so many KPIs with ease is a key aspect in Zoho Analytics. Its interactive charts are awesome. I can now select or unselect certain parameters to slice and dice the data for each line of my business, and show its performance to our partners."

"With Zoho Analytics, the time spent in creating charts, reports and dashboards went down by 50%. More importantly, our software expenses were reduced by 30%."

Build your own KPI dashboards now with Zoho Analytics.
Sign up for freeFrequently asked questions on KPI Dashboards
What are KPI dashboards?
- KPI dashboards are tools that enable you to conveniently monitor your business's overall performance by consolidating essential key performance indicators (KPIs) from various data sources. It offers valuable insights to managers, allowing them to assess the health of the business and track its performance effectively.
How to create an effective KPI dashboard?
- To create an effective KPI dashboard, follow these steps:
- Define the purpose of the dashboard and identify the intended audience.
- Select the most suitable KPI dashboard software for your needs.
- Visualize your data using appropriate charts and graphs.
- Arrange the KPI widgets and reports in a cohesive manner.
- Compile the components to create a comprehensive dashboard.
Why should I create KPI dashboards?
- KPI dashboards enable you to uncover performance trends and insights from a large amount of data—everything from one place. With these insights, businesses can make data-driven decisions and improve their performance without spending much time on data analysis.
What are the KPIs I can track in a dashboard?
- You can track KPIs across sales, marketing, finance, operations, HR, and customer support. Common examples include revenue, pipeline value, campaign ROI, churn rate, inventory levels, SLA compliance, and employee productivity. Most dashboards support both high-level and detailed KPIs.
How can I track the KPIs?
- You can track KPIs by connecting your data sources to a dashboard tool like Zoho Analytics, selecting the metrics that matter, and visualizing them through charts, scorecards, and trend views. Automated refresh, alerts, and drill-downs help you monitor performance continuously and take action quickly.
What are the recommendations for free KPI dashboard tools?
- Popular free KPI dashboard tools include Zoho Analytics, Google Looker Studio, and Microsoft Power BI Desktop. These options offer essential visualizations, data connectors, and sharing features, making them ideal for small teams or individuals starting with KPI tracking.
What to include in KPI dashboards?
- When creating KPI dashboards, it's essential to focus on presenting relevant and actionable
information. Here are some key elements to include in KPI dashboards:
- Targets and Thresholds
- Trends and Historical Data
- Real-Time Updates
- Data Filters and Drill-Downs
- Data Context
Why should you choose Zoho Analytics to create KPI dashboards?
- With Zoho Analytics, you can effortlessly import data from various sources, seamlessly visualize data, and create dynamic KPI widgets. Whether you need finance dashboard software to track budget performance, sales dashboard software to monitor pipeline and revenue, or a broader KPI dashboard software solution for your entire organization, Zoho Analytics covers it all. Furthermore, you can enhance your analysis through the integration of artificial intelligence capabilities. Collaborative work becomes hassle-free as you can easily share KPI dashboards with your team. Experience these benefits and much more by selecting Zoho Analytics for your KPI dashboard needs.