
In this article
- Why businesses should be using cloud reporting tools?
- How we evaluated these cloud reporting tools?
- Best cloud reporting tools: A detailed comparison
- Cloud reporting tools: Side-by-side comparison
- Core capabilities: What to look for in a cloud reporting tool?
- Final thoughts: Choosing the right cloud reporting tool
Key takeaways
- Cloud reporting tools centralize fragmented data and give teams real-time access to insights from any device.
- Connecting data from multiple systems remains one of the biggest reporting challenges. Platforms with extensive connector libraries reduce manual work and speed up deployment.
- Self-service capabilities let business users create interactive dashboards and reports without involving IT.
- AI-powered features like anomaly detection and natural language querying separate modern cloud reporting tools from traditional reporting software.
- Deployment flexibility varies widely. Some vendors focus on cloud-only deployments, while others support on-premise and hybrid environments.
- Learning curve matters. The best BI platform is one that both technical and business users can adopt successfully.
- Transparent, all-inclusive pricing matters as much as features. Total cost of ownership matters more than the entry price.
Why businesses should be using cloud reporting tools?
Most organizations use multiple systems such as CRM, marketing platforms, finance tools, and product analytics. Without a unified reporting layer, this data stays spread across tools. It's harder to use and slower to act on. Cloud reporting tools bring this data into one place, so teams can work with a single version instead of piecing together information from multiple sources. This shift reduces time spent preparing reports and gives teams quicker access to the numbers they need.
Here's why:
- Fragmented data costs more than you think
- Poor visibility drives real financial loss
- Faster decisions give teams an edge
- Teams need self-service reporting
Fragmented data is costing more than you think
Most organizations rely on multiple systems such as CRM platforms, marketing tools, finance software, and operational databases. Each of these systems captures valuable data, but without a centralized reporting layer, this information remains siloed.
As data gets distributed across tools and teams, inconsistencies appear. Different teams work with different numbers, and decision-makers spend time validating data before any analysis can begin. This makes it difficult to get a clear picture of overall business performance.
Poor visibility is driving real financial loss
When organizations do not have a clear, unified view of their data, inefficiencies go unnoticed. Costs increase gradually, and by the time they are identified, the impact is already significant.
According to Flexera:
- 84% of organizations struggle to manage cloud spend
- Cloud budgets exceed limits by approximately 17% on average
- Nearly 29% of cloud spend is wasted due to underutilized resources
These numbers point to a common issue. Without proper visibility, organizations are unable to track how resources are used, which leads to avoidable waste and rising operational costs. To fix this, teams need a way to track performance consistently across systems without manual effort.
Faster decisions now define competitive advantage
How quickly teams can turn data into action determines the advantage. Organizations are increasingly shifting their focus from cost tracking to value creation. In fact, according to Flexera, 64% of organizations now measure cloud success based on the business value it delivers rather than just cost efficiency. This shift depends on how quickly insights can be generated and used. Without cloud reporting tools, teams often depend on analysts to prepare reports, which introduces delays and limits responsiveness.
When insights are not available in real time, opportunities are missed and decisions are made based on outdated information.
Teams need self-service reporting
As organizations grow, relying on a central team to generate every report becomes unsustainable. Each request adds to the backlog, and analysts spend more time preparing data than analyzing it. This creates a bottleneck where even simple questions take time to answer, and decision-making slows down across departments.
Cloud reporting tools solve this by giving teams direct access to data. Teams can explore dashboards, track key metrics, and generate insights on their own, without waiting for manual intervention.
What this looks like in the real world
In this Reddit discussion , users describe challenges such as idle resources running continuously, increasing costs without clear explanations, and difficulty tracking usage across systems. When organizations lack real-time visibility, inefficiencies are harder to detect and resolve. Over time, this leads to higher costs, slower decisions, and reduced operational clarity.
How we evaluated these cloud reporting tools?
| Criteria | Weight | Why it matters |
|---|---|---|
| Implementation speed | 25% | Faster adoption leads to quicker ROI and less operational disruption |
| AI capabilities | 25% | Separates modern cloud platforms from traditional BI reporting tool |
| Integrations | 20% | Strong connectivity eliminates silos and removes manual data consolidation |
| Reporting and collaboration | 15% | Gives teams across the organization better data to decide with |
| Support and enablement | 10% | Critical during onboarding, migration, and scaling stages |
| Security and governance | 5% | Covers compliance, access control, and data protection |
Our scoring methodology
Each tool received a score of 1-5 for each criterion:
- 5 = Industry leading: Best-in-class, nothing better exists on the market
- 4 = Strong: Exceeds expectations, minor gaps only
- 3 = Adequate: Meets needs, some notable limitations
- 2 = Developing: Basic functionality present, significant gaps
- 1 = Weak: Missing or poorly executed
Best cloud reporting tools: A detailed comparison
Choosing the right cloud reporting tool goes beyond comparing dashboards. Organizations need to assess data integration depth, AI-driven analytics , ease of use, scalability, and total cost of ownership. The platforms below are the most widely used cloud reporting software in 2026. Each has a distinct area of strength.
- 1. Zoho Analytics - End-to-end cloud reporting and analytics platform
- 2. Microsoft Power BI - Enterprise reporting with deep Microsoft integration
- 3. Tableau - Advanced visual analytics and storytelling
- 4. Google Looker - Semantic data modeling and GCP-native reporting
- 5. Domo - Cloud BI with embedded analytics and workflow automation
Zoho Analytics - End-to-end cloud reporting and analytics platform
Zoho Analytics is a comprehensive cloud reporting and business intelligence platform built for businesses of all sizes. Zoho Analytics is a complete BI environment where business users, analysts, and decision-makers collaborate on data analysis and performance reporting without relying on IT. Its AI assistant, Zia, lets anyone ask questions in plain English and get instant, chart-ready answers.
Key strengths
- 1. 500+ native data connectors
- 2. In-built data preparation tool
- 3. Advanced AI-powered analytics with Zia
- 4. Interactive data visualization and dashboards
- 5. Simple collaboration and sharing
- 6. Embedded and white-label analytics
- 7. Flexible deployment and enterprise-grade security
500+ native data connectors
Zoho Analytics connects to your entire stack. No wrestling with APIs or custom integrations.
- Business applications: Zoho CRM, Salesforce, HubSpot, Google Ads, Facebook Ads, QuickBooks, Freshdesk, and more.
- Databases and data warehouses: MySQL, PostgreSQL, Oracle, Amazon Redshift, Snowflake, BigQuery.
- Cloud storage and files: Google Drive, Dropbox, Excel, CSV, JSON.
- Custom integrations: REST API support for any web service; webhooks for real-time data pushes.
In-built data preparation and modeling
Zoho Analytics includes a powerful built-in data preparation tool that eliminates the need for separate ETL tools or data engineering teams, because raw data is rarely analysis-ready.
- Data cleaning: Removes duplicates, fills missing values, standardizes formats, detects outliers.
- Data transformation: Merge/join tables visually, pivot and unpivot data, split columns, create calculated fields.
- Data modeling: Define table relationships, create hierarchies, build aggregation tables for performance.

"With Zoho DataPrep, we're now looking to streamline our ETL processes and move towards a leaner ETL framework. We're very happy with Zoho's capability."
Connor NobertDirector of Analytics and Technology, Pulse LLCAdvanced AI-powered analytics
Zia, Zoho's AI assistant, lets anyone in your organization access insights using natural language. No SQL, no analyst ticket required.
- Ask questions in plain English. Zia understands context and generates visualizations automatically.
- Anomaly detection flags unexpected pattern changes and unusual metric spikes, then notifies the right people.
- Forecasting covers revenue, inventory demand, and customer behavior using built in predictive models.
"We have embedded Zoho Analytics within our internally developed financial services software. Whenever I have a new client meeting, I demonstrate the Ask Zia feature of Zoho Analytics with a question like "what was my income last month?" It's quick reply or a visual fascinates my clients and they say, 'This is what we want'. It allows me to show them that we are a forward thinking company partnered with a global company like Zoho."
Craig RoxbyManaging Director, MagnifiInteractive data visualization and dashboards
Create interactive data visualizations and dashboards with Zoho Analytics in minutes.
- No coding or design skills needed. The report builder is drag-and-drop.
- 50+ visualization types: charts, heat maps, tree maps, bubble charts, KPI widgets, and pivot tables.
- Ready-to-use dashboard templates with customizable color schemes and themes.
Simple collaboration and sharing
Zoho Analytics makes sharing and collaboration simple while keeping data secure.
- Share privately, with user groups, via public links, or embedded in websites and portals.
- Email reports on custom schedules in PDF, Excel, or CSV.
- Assign roles as admin, developer, analyst, or viewer. Each role has defined view and edit permissions.
Embedded and white-label analytics
Zoho Analytics has fully-branded dashboards that can be embedded directly into your applications, products, or client portals.
- SaaS platforms: Give customers real-time analytics and performance metrics as a native product feature.
- Client portals: Let clients view project status, budget utilization, and deliverable timelines.
- Education platforms: Track student progress and assessment results.
"Zoho Analytics seamlessly generated reports and dashboards that are embedded within our ERP system, offering robust functions that democratized access to insights across our organization."
Ravi KumarHead of Finance and IT Operations, AQUAGROUPDeployment and security
Zoho Analytics adapts to your infrastructure and compliance requirements, whether you're a startup needing quick cloud deployment or an enterprise with strict data residency rules.
- Cloud: Hosted on AWS and Azure, with automatic updates and a 99.9% uptime SLA.
- On-premise: Install on your own servers. Data never leaves your network.
- Hybrid: Sensitive data stays on-premise. The cloud analytics layer connects via an encrypted tunnel.
- Security: SOC 2 Type II, ISO/IEC 27001, GDPR, HIPAA, and CCPA compliant.
"We chose Zoho Analytics because we could access the app from anywhere, security features such as two factor authentication, and the ability to tie in to databases or load data via CSV and Excel."
Alex RyanCTO, Evantec CorporationLimitations to consider
- Some large enterprises may require additional configuration or IT support for complex multi-source data modeling.
- While documentation is extensive, some advanced use cases may require community or support engagement to resolve.
Who should choose Zoho Analytics?
- Small to mid-sized businesses needing all-in-one cloud reporting software
- Enterprises that need power and cost control without complexity
- SaaS companies integrating analytics directly into their products
- Teams with both technical and non-technical users
- Organizations looking for lower total cost of ownership
Pricing
Zoho Analytics has a transparent, predictable pricing model. Organizations can scale without unexpected cost increases. The entry-level plan includes most core capabilities, so teams do not have to rely on multiple upgrades to access essential features. Unlike many platforms, data connectors, data preparation, AI-powered analytics, and collaboration are included in standard plans. This helps avoid cost increases that occur as usage grows.
Zoho Analytics also reduces operational overhead. Both technical and non-technical users can build and manage reports. This reduces reliance on specialized resources. Pricing scales predictably, so teams can grow usage without budget surprises.
START YOUR 15-DAY FREE TRIAL
Microsoft Power BI - Enterprise reporting with deep microsoft integration
Microsoft Power BI is one of the most widely adopted cloud reporting platforms, particularly among organizations already invested in the Microsoft ecosystem. Its tight integration with Microsoft 365, Azure, and Excel makes it a strong choice for enterprise teams that rely on Microsoft tools for everyday work.
Key strengths
- Tightly integrated within the Microsoft ecosystem and works smoothly with Excel, Azure, Teams, and SharePoint.
- Strong data modeling capabilities with DAX queries for advanced calculations and enterprise-grade analytics.
- Competitive pricing for Microsoft 365 users already in the ecosystem.
- AI features including Copilot integration, Quick Insights, and Azure Machine Learning connectivity.
- Paginated reports for pixel-perfect, print-ready financial and operational documents.
Limitations to consider
- Non-technical users often find DAX formulas and the Power Query model challenging to learn.
- Large dataset handling, governance, and AI features are tied to higher-tier plans like Premium.
- The platform is primarily designed for the Microsoft ecosystem; connecting non- Microsoft systems often requires extra setup.
- Report authoring requires the Power BI Desktop app. This creates a split workflow between report creation and cloud publishing.
Who should choose Power BI?
- Organizations already deeply invested in the Microsoft ecosystem
- Data teams comfortable with DAX and data modeling
- Mid-sized to large enterprises on Azure
- Finance teams needing paginated, print-ready reports
Pricing
Microsoft Power BI is often perceived as a cost-effective option, especially for organizations already using Microsoft 365. The entry pricing is relatively low, which makes it appealing during initial evaluation. As usage grows, additional costs begin to surface. Advanced capabilities such as large dataset handling, enterprise-grade governance, and AI features are tied to higher-tier plans like Premium. These upgrades can significantly increase overall costs, particularly for larger teams.
There is also an indirect cost to consider. Power BI requires the use of its Desktop application for report creation, which introduces a split workflow between development and sharing. This can increase operational overhead and slow down collaboration across teams.

Source: Power BI
Tableau - Advanced visual analytics and storytelling
Tableau stands out in visual analytics, known for advanced data exploration and compelling data storytelling. It lets users build interactive reports with layered insights and responsive designs that help stakeholders understand complex datasets quickly. Organizations already using Salesforce benefit from native CRM data integration under the unified Salesforce licensing model.
Key strengths
- Industry-leading data visualization capabilities with 100+ chart types and interactive dashboards.
- Strong data exploration tools ideal for analysts and data professionals.
- Handles large datasets in enterprise settings.
- Tableau Pulse delivers AI-generated metric digests directly to Slack or email.
- Mature product with a broad industry adoption base and large developer community.
Limitations to consider
- Higher pricing compared to most competitors; Creator licenses add significantly to total cost.
- Steep learning curve for non-technical users. Best suited for dedicated analysts.
- Non-Salesforce data source connectivity requires additional configuration effort.
Who should choose Tableau?
- Large enterprises with dedicated analytics teams
- Industries like finance, healthcare, and consulting focused on data storytelling
- Salesforce-heavy organizations seeking native CRM reporting
Pricing
Tableau is positioned as a premium analytics platform, and its pricing reflects that. Viewer-level access is less expensive, but most organizations require Creator or Explorer licenses to build and manage reports. As more users need authoring capabilities, licensing costs increase quickly. Organizations often need dedicated resources to manage data preparation and dashboard development due to the platform's learning curve. This makes Tableau a strong option for organizations with dedicated analytics teams, but it can become expensive for companies looking to scale reporting across non-technical users.

Source: Tableau
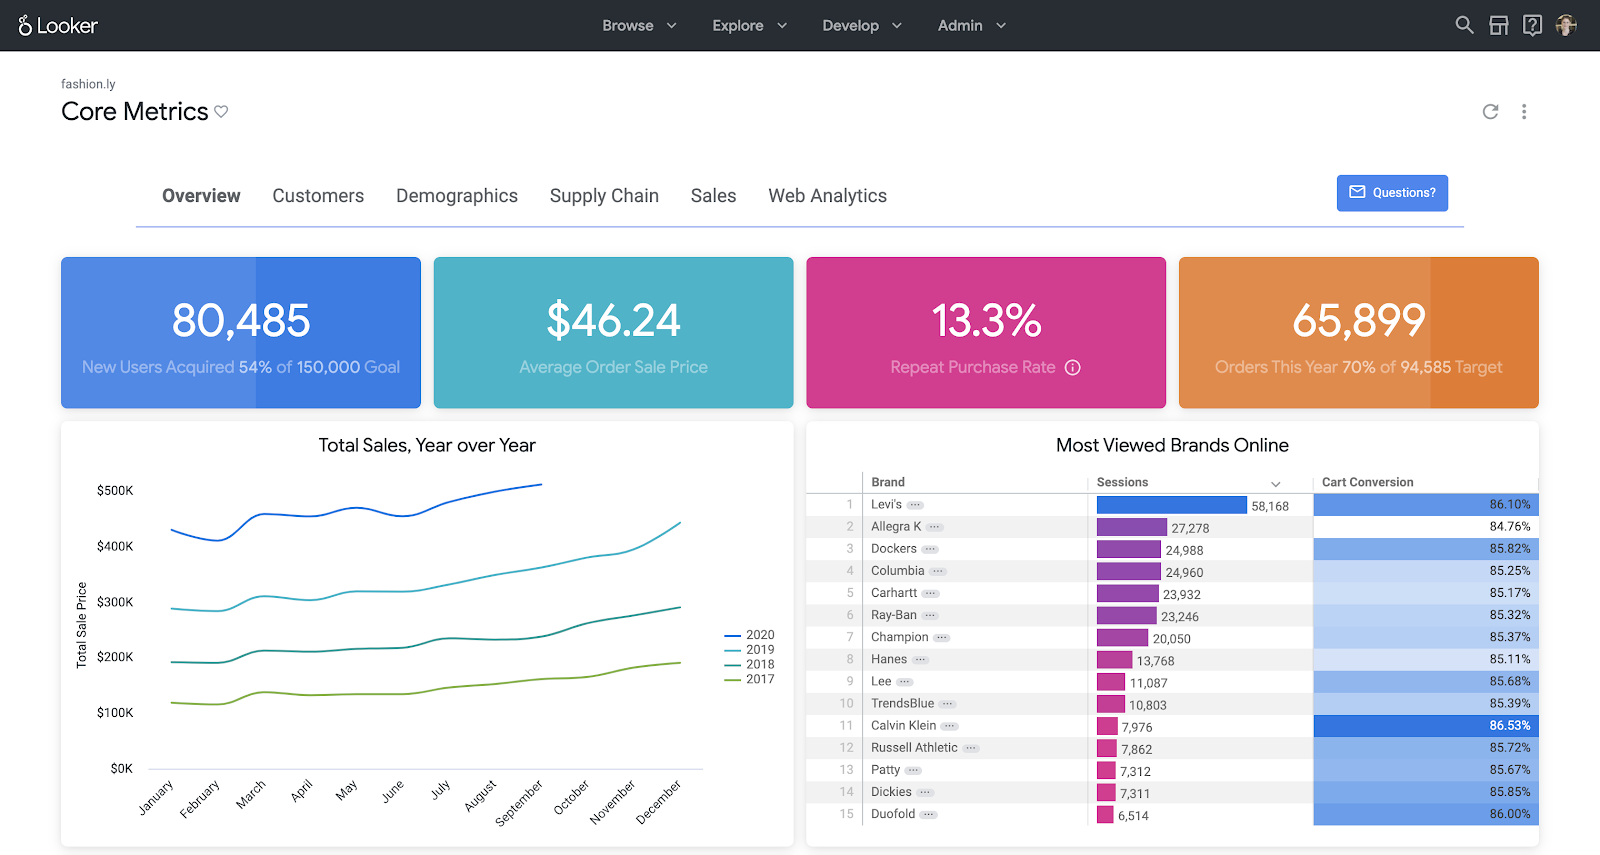
Google Looker - Semantic data modeling and GCP-native reporting
Google Looker is built around a semantic modeling layer called LookML where analysts define business metrics once, and all reports across the organization share the same consistent definitions. This makes it powerful for large teams where metric consistency across departments is a non-negotiable business requirement.
Key strengths
- LookML semantic layer enforces a single source of truth for metrics organization-wide.
- Deep BigQuery integration with near-zero query latency for GCP data warehouse users.
- Looker Explore enables self-service data exploration without SQL knowledge.
- API-first architecture supports custom embedded analytics use cases at scale.
Limitations to consider
- Custom pricing is opaque and typically positions Looker as a higher-cost enterprise option.
- LookML has a steep learning curve and requires data engineering resources to build and maintain models.
- Dashboard aesthetics are functional but less visually polished than Tableau or Zoho Analytics.
Who should choose Google Looker?
- Enterprises with GCP or BigQuery as their primary data warehouse
- Organizations where metric consistency across departments is a critical requirement
- Product teams building custom embedded analytics at scale
Pricing
Google Looker follows an enterprise pricing model, which means costs are not publicly listed and are typically customized based on usage and scale. This lack of transparency can make it difficult for organizations to estimate total cost upfront. In many cases, pricing typically depends on query volume, data warehouse usage, and contract size. Building and maintaining the LookML semantic layer often requires dedicated data engineering resources. This provides consistency at scale. It also adds to the overall cost of ownership.
Source: Google Looker
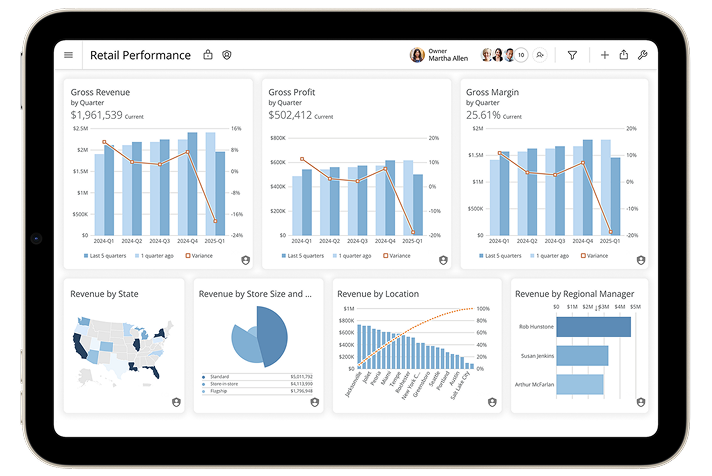
Domo - Cloud BI with embedded analytics and workflow automation
Domo is a cloud-native, all-in-one business intelligence platform built for enterprises that need to centralize data from across their organization and act on it in real time. It combines data integration, transformation, visualization, and collaboration in a single platform. Domo is designed for business users and executives who need live access to metrics, alongside data teams that manage complex pipelines and governance.
Key strengths
- 1,000+ prebuilt connectors covering cloud apps, databases, social media, and enterprise systems.
- Magic ETL provides a drag-and-drop data transformation environment without requiring SQL or scripting.
- Real-time dashboards with live data refresh, KPI cards, and mobile access for on-the-go decision-making.
- Built-in collaboration features including in-dashboard chat, alerts, and user mentions.
Limitations to consider
- Pricing is not publicly listed and is typically negotiated per contract. Enterprise deployments can be significantly expensive compared to alternatives.
- Domo is a cloud-only platform. Organizations with strict on-premise or data residency requirements will need to evaluate compatibility carefully.
- Some AI and machine learning capabilities depend on external integrations such as Amazon SageMaker or OpenAI rather than a fully native AI layer.
- The platform's depth and feature breadth can create a learning curve for smaller teams or organizations without dedicated BI resources.
Who should choose Domo?
- Large enterprises that need a unified, cloud-based BI platform with extensive data connectivity
- Organizations managing complex operational data across multiple departments and systems
- Teams that want built-in collaboration and workflow automation alongside reporting
- Companies comfortable with enterprise-level investment and contract-based pricing
Pricing
Domo does not publish pricing publicly. Costs are customized based on user count, data volume, and feature tiers. Based on available market data, plans typically start at $83 per user per month under annual contracts, with enterprise deployments costing significantly more.
The platform's breadth of features is a strength, but the consumption-based model means costs can scale quickly as data usage, user count, and integrations grow. Organizations evaluating Domo should request a full breakdown of included features per tier, as advanced capabilities such as governance, AI integrations, and higher-volume data processing may require premium contracts. For teams that need predictable, all-inclusive pricing, Domo's model can be difficult to forecast over time.
Source: Domo
Cloud reporting tools: Side-by-side comparison
| Tool | Best For | AI Strength | Data Integration | Deployment | Ease of Use | Starting Price |
|---|---|---|---|---|---|---|
| Zoho Analytics | Businesses of all sizes | Built-in AI assistant (Zia), NL querying, forecasting, anomaly detection | 500+ native connectors | Cloud, On-Premise, Hybrid | User-friendly, drag-and-drop | $30/month (2 users) |
| Microsoft Power BI | Microsoft ecosystem orgs | Copilot + Azure AI for insights | 400+ connectors (strong Microsoft) | Cloud, Desktop, Server | Moderate (DAX learning curve) | $14/user/month (Pro) |
| Tableau | Visual analytics, Salesforce orgs | Ask Data, Explain Data, Tableau Pulse | 100+ connectors | Cloud, Server | Steep learning curve | $15/user/month (Viewer) |
| Google Looker | GCP/BigQuery, enterprise modeling | Looker AI, Vertex AI integration | All GCP sources + 60+ connectors | Multi-cloud (GCP-native) | Requires LookML expertise | Custom pricing |
| Domo | Operational analytics and business teams | Domo AI, natural language querying, AI-powered insights | 1,000+ pre-built connectors | Cloud | Easy to moderate | Custom pricing |
Core capabilities: What to look for in a cloud reporting tool?
Choosing the right cloud reporting solution requires a clear understanding of the capabilities that directly influence usability and how fast teams can act. A modern cloud reporting tool handles the full workflow, from data integration to final report. Whether you're evaluating a cloud BI tool or a self-service reporting platform, the following capabilities matter most.
- 1. Data connectivity across all business systems
- 2. Strong data preparation capabilities for accurate analysis
- 3. Interactive data visualizations and dashboards
- 4. Advanced analytics and AI for predictive insights
- 5. Smooth collaboration and secure insight sharing
- 6. Flexible deployment and strong security
- 7. Embedded analytics within business applications
- 8. Real-time decision-making through mobile accessibility
- 9. Transparent pricing and scalable architecture
"Zoho Analytics is the only product with the right mix of cost and value—with features like data visualization, integration, data blending, collaboration, user filters, drag and drop, geomaps, and much more at an affordable price"
Ben SmithAdvisor and former COO of SugarfinaData connectivity across all business systems
A marketing team might pull campaign data from Google Ads and revenue numbers from a finance tool, then spend hours combining everything in spreadsheets. At a small scale, this feels manageable. But as more tools are added and data volumes grow, inconsistencies appear. Different teams begin working with slightly different numbers, and before any real analysis can happen, someone has to step in just to validate what's correct. Most reporting setups break down before analysis, when data is still scattered across systems.
A reporting tool should connect directly to your stack and keep data in sync automatically, so teams aren't repeatedly exporting and merging data by hand. That's the gap Zoho Analytics is designed to close. With 500+ native connectors and automated data sync, it brings data together into a single, consistent view, so teams get to analysis faster.
View all connectorsStrong data preparation capabilities for accurate analysis
Most reporting delays happen before dashboards are built, when teams are still trying to make the data usable. Raw data is rarely clean. There are duplicates, missing values, inconsistent formats, and structural issues that need to be fixed before any meaningful analysis can begin. When this preparation happens across separate tools or manual workflows, it slows things down and increases the chance of errors. Over time, data preparation and analysis become disconnected. Consistent reporting gets harder.
Modern reporting tools handle cleaning, transformation, and modeling in the same environment as analysis, so teams move from raw data to insights without switching contexts. Zoho Analytics addresses this by embedding data preparation directly into the platform. Teams can clean, transform, and structure their data in one place. This reduces handoffs and speeds up reporting.
Interactive data visualizations and dashboards for faster decisions
When a metric drops, the useful question is how quickly someone can figure out what's causing it. In many teams, that process still involves requesting a report and waiting on an analyst before arriving at an answer. This creates delays that add up over time, especially when decisions need to be made quickly. Teams need the ability to explore data independently. That's why modern reporting tools focus heavily on interactivity. These tools let users drill down into charts and apply filters on their own, without needing technical support for every question.
Zoho Analytics is built around this idea. Its drag-and-drop interface and drill-down capabilities make it easy for users to move from a high-level view to detailed insights in seconds, which means decisions don't get delayed waiting on someone else.
Here's how you can create interactive data visualizations and dashboards using Zoho Analytics.
"Data visualization is important for any BI tool. It's great to present data in a way that is meaningful to the audience, helping them quickly grasp the content. That's where Zoho Analytics is very strong. We now analyze our sales, operations, and finance using Zoho Analytics."
ED LevisHead of IT, NYC NavigatorAdvanced analytics and AI for predictive, intelligent insights
Reporting has traditionally focused on answering one question: what happened? As data grows more complex and decision cycles shorten, teams also need to understand why something happened and what is likely to happen next. Without these capabilities, analysis stays reactive.Teams spend time investigating changes after they occur. Early patterns get missed.
AI-powered insights become a core part of modern reporting here. Modern tools detect anomalies and generate forecasts automatically, without manual analysis. This reduces the effort required to interpret data and helps teams move faster from observation to action.
Zoho Analytics brings this into everyday workflows through Zia, its AI assistant. Zia lets users ask questions in natural language, detect unusual patterns, and generate forecasts without manual modeling. Teams act on data before problems compound. This reduces the effort to interpret data and speeds up the path from observation to action.
Smooth collaboration and sharing
In many organizations, reports are still shared as files. Someone exports a dashboard, sends it over email, and within a few days, multiple versions start circulating across teams. As updates are made and numbers change, it becomes harder to track which version is actually correct. This slows down decision-making. Teams spend time reconciling data instead of acting on it. Teams work from a shared, live dashboard where data is always up to date. Access is controlled centrally, and discussions happen in the context of the data itself.
Zoho Analytics supports this by turning dashboards into collaborative workspaces. Role- based access, scheduled sharing, and in-platform comments keep everyone on the same data. Decisions get faster.
"The amount of time it takes to generate a report in SAP Business Objects is very long and SAP does not even support collaboration of reports across multiple devices and smartphones. On the other hand, Zoho Analytics is a simple, quick, intuitive tool that allows easy collaboration across devices. Now we can check reports on the go."
Víctor Hugo Garcia BarbosaIT Manager, FANDELIFlexible deployment and strong security
Choosing a reporting tool often comes down to whether it fits existing infrastructure and security requirements. For many organizations, especially at the enterprise level, data residency rules and compliance standards determine what can actually be adopted. This is why deployment flexibility matters. Teams need to choose how and where data is handled, whether cloud, on-premise, or hybrid, without losing performance or control.
Zoho Analytics is built to accommodate these needs. By supporting multiple deployment options along with enterprise-grade security standards, it allows organizations to adopt modern reporting without having to rework their existing infrastructure.
Embedded analytics within business applications
For many SaaS products, analytics is part of the user experience. Customers expect to log in and immediately see insights about their usage and performance. When analytics is handled outside the product, the experience feels disconnected. Reporting needs to be embedded directly into the product. Dashboards should feel native, carry the same branding, and scale across users. Data stays secure and isolated.
Zoho Analytics enables this by allowing teams to embed fully white-labeled reporting dashboards into their applications. Analytics becomes part of the product experience.
Mobile accessibility
Access to data doesn't always happen in a controlled environment. A manager might need to check performance between meetings, or a sales leader might notice a sudden change while on the move. In these situations, waiting to get back to a desktop can delay the response. Over time, these small delays add up and affect how quickly teams can act on information. Mobile accessibility gives teams full access to insights wherever decisions are being made.
Zoho Analytics extends its reporting capabilities to mobile. Users can explore dashboards, receive alerts, and respond to changes in real time. Decision-making doesn't stop when someone leaves their desk.
Transparent pricing
Many platforms appear affordable initially. As usage grows, additional costs appear: connectors, advanced features, higher data limits, or support tiers. What initially seemed like a simple pricing model gradually becomes more complex, and predicting long-term costs gets harder. Evaluating a tool based only on its entry price can be misleading. The more useful question is how pricing scales over time and whether core capabilities are included or cost extra.
Zoho Analytics takes a more predictable approach by including data connectors, AI capabilities, and collaboration are in standard plans. This reduces unexpected cost increases and makes it easier for teams to scale without constantly reassessing their budget.
Final thoughts: Choosing the right cloud reporting tool
Cloud reporting is no longer optional for teams that rely on data regularly. It directly affects how quickly teams can access and act on information. The right platform connects your data and makes analysis easier across teams. Whether you're a growing team or a large enterprise, choosing a tool that your team can actually use at scale matters just as much as features.
Among the platforms reviewed, Zoho Analytics combines data integration from 500+ sources, user-friendly dashboards, AI-powered analytics, and transparent pricing in a single platform accessible to businesses of all sizes.
Frequently Asked Questions
What are cloud reporting tools?
Cloud reporting tools are web-based platforms that connect to your data sources, process data on remote servers, and deliver interactive reports and dashboards through a browser with no local software installation required. They update automatically and are accessible from any device by multiple users. Most modern platforms also include scheduled report delivery and role-based access controls.
How do cloud reporting tools work?
Cloud reporting tools connect to data sources like databases, SaaS applications, spreadsheets, and data warehouses. They sync data on a configured schedule (or in real time) and allow users to build reports and dashboards through a visual interface. Reports are shared via links, scheduled email exports, or embedded iframes in your own application, all without local software or manual file distribution.
What are some examples of cloud reporting tools?
Popular cloud reporting tools include Zoho Analytics, Microsoft Power BI Service, Tableau Cloud, Google Looker, and Domo Cloud. Each has a distinct strength: Zoho Analytics for all-in-one ease of use and value; Power BI for Microsoft ecosystem integration; Tableau for visual storytelling; Looker for semantic modeling; and Domo for developer-friendly self-service reporting.
What is the purpose of a cloud reporting tool?
The purpose of a cloud reporting tool is to convert raw business data into accessible, shareable insights that speed up and improve decision-making. It reduces manual reporting effort, increases data visibility across departments, improves forecast accuracy, and gives every team member (technical or not) access to the data they need when they need it.
How much does a cloud reporting tool typically cost?
Costs vary significantly based on features, user count, deployment model, and data volume. Entry-level plans start as low as $8-$14 per user per month for platforms like Zoho Analytics and Power BI Pro. Mid-market tools run $30-$75 per user per month. Enterprise platforms like Looker and Domo use custom pricing. Always evaluate total cost of ownership, since connector fees, AI features, and support tiers can substantially increase the advertised base price.
Are cloud reporting tools secure for sensitive business data?
Yes, when you select a platform with the appropriate certifications. Look for SOC 2 Type II compliance as a baseline, along with GDPR, ISO/IEC 27001, and HIPAA if your industry requires it. Look for row-level security (RLS) to control what individual users can see, role-based access control (RBAC) to manage editing and admin privileges, and AES-256 encryption for data at rest. Zoho Analytics, Power BI, Tableau, and Looker all meet enterprise-grade security standards.
What is the difference between a cloud reporting tool and BI software?
Cloud reporting tools focus on structured report creation, scheduled distribution, and dashboard sharing through a browser. BI software covers this but typically goes further, including data modeling and deeper exploratory analysis. Many modern platforms blur this line. Zoho Analytics, for example, combines full cloud reporting with enterprise BI capabilities in one platform, the distinction matters less for most use cases.
Is embedded analytics suitable for startups?
Yes. Embedded analytics is well-suited for SaaS startups and product-led companies that want to deliver analytics as a feature inside their product instead of sending users to a third-party tool. Choose a platform with flexible APIs and low development overhead so the integration stays affordable during early growth. Zoho Analytics offer accessible embedded analytics options at the startup tier.