What will I learn?
- What is Business Intelligence reporting?
- Benefits of Business Intelligence Reporting
- What Are the Different Types of Business Intelligence Reports?
- BI reporting Examples and Templates
- Core Components of BI Reporting
- Best practices of Business Intelligence reporting
- Common BI reporting challenges and considerations
- Zoho Analytics for BI Reporting in Your Workflow
- FAQs
Business Intelligence Reporting: Examples & Best Practices
Teams that use their data well tend to see faster decisions and fewer blind spots. Business intelligence reporting is how those teams turn raw numbers into something leadership can act on.
What is business intelligence reporting?
Business Intelligence (BI) reporting is the work of collecting data, analyzing it, and presenting what you find in a form people can use. A good BI report shows where the business stands today, calls out trends and patterns, and gives decision-makers– a clear basis for their next move.

"SysGroup enables data-driven reporting with Zoho Analytics"
Mark SpearHead of Business Transformation, SysGroupBenefits of Business Intelligence Reporting
BI reporting matters to most organizations for a few concrete reasons:
- Strategic Planning: BI reporting gives you a clear view of key performance indicators and business trends. That view helps teams shape and adjust strategy based on what is actually happening in the business.
- Performance Monitoring: Real-time BI reporting facilitates monitoring of key performance metrics to track progress, identify areas of improvement, and tweak strategies wherever necessary.
- Operational Efficiency: BI reporting helps you find bottlenecks, allocate resources more deliberately, and keep day-to-day operations running with less friction.
- Competitive Advantage: With BI reporting, organizations can stay current on customer behavior, market demand, and other signals that inform where to invest effort next.
BI reporting tools also do work that is hard to replicate with spreadsheets alone. Here is what they add:
- Data Consolidation: BI reporting tools gather data from files and feeds, databases, business applications, external systems, and more. You get one place to analyze and report on data that used to live in separate systems.
- Data Analysis and Exploration: BI reporting tools let users build interactive visualizations through data visualization software, run ad-hoc reporting, and apply filters to find patterns and trends.
- Efficiency and Automation: BI reporting tools can automate data collection, preparation, analysis, and report creation. That cuts manual work, reduces errors, and keeps reporting consistent.
- Ad Hoc Reporting: Modern BI tools let users build reports on demand through visual builders, AI-analytics, and similar features.
- Scalability: Today's AI-powered BI tools can handle larger data volumes as business needs grow.
What Are the Different Types of Business Intelligence Reports?
BI reporting shows up at every level of an organization. Reports and dashboards usually fall into four types:
- Strategic BI reports and dashboards track long-term objectives and outcomes through high-level metrics.
- Operational reports monitor day-to-day processes through performance metrics, often updated in real time.
- Analytical reports answer a specific question and include the detail stakeholders need to act on it.
- Tactical BI reports help middle managers track department or function performance over standard periods like daily, monthly, or yearly.
BI reporting Examples and Templates
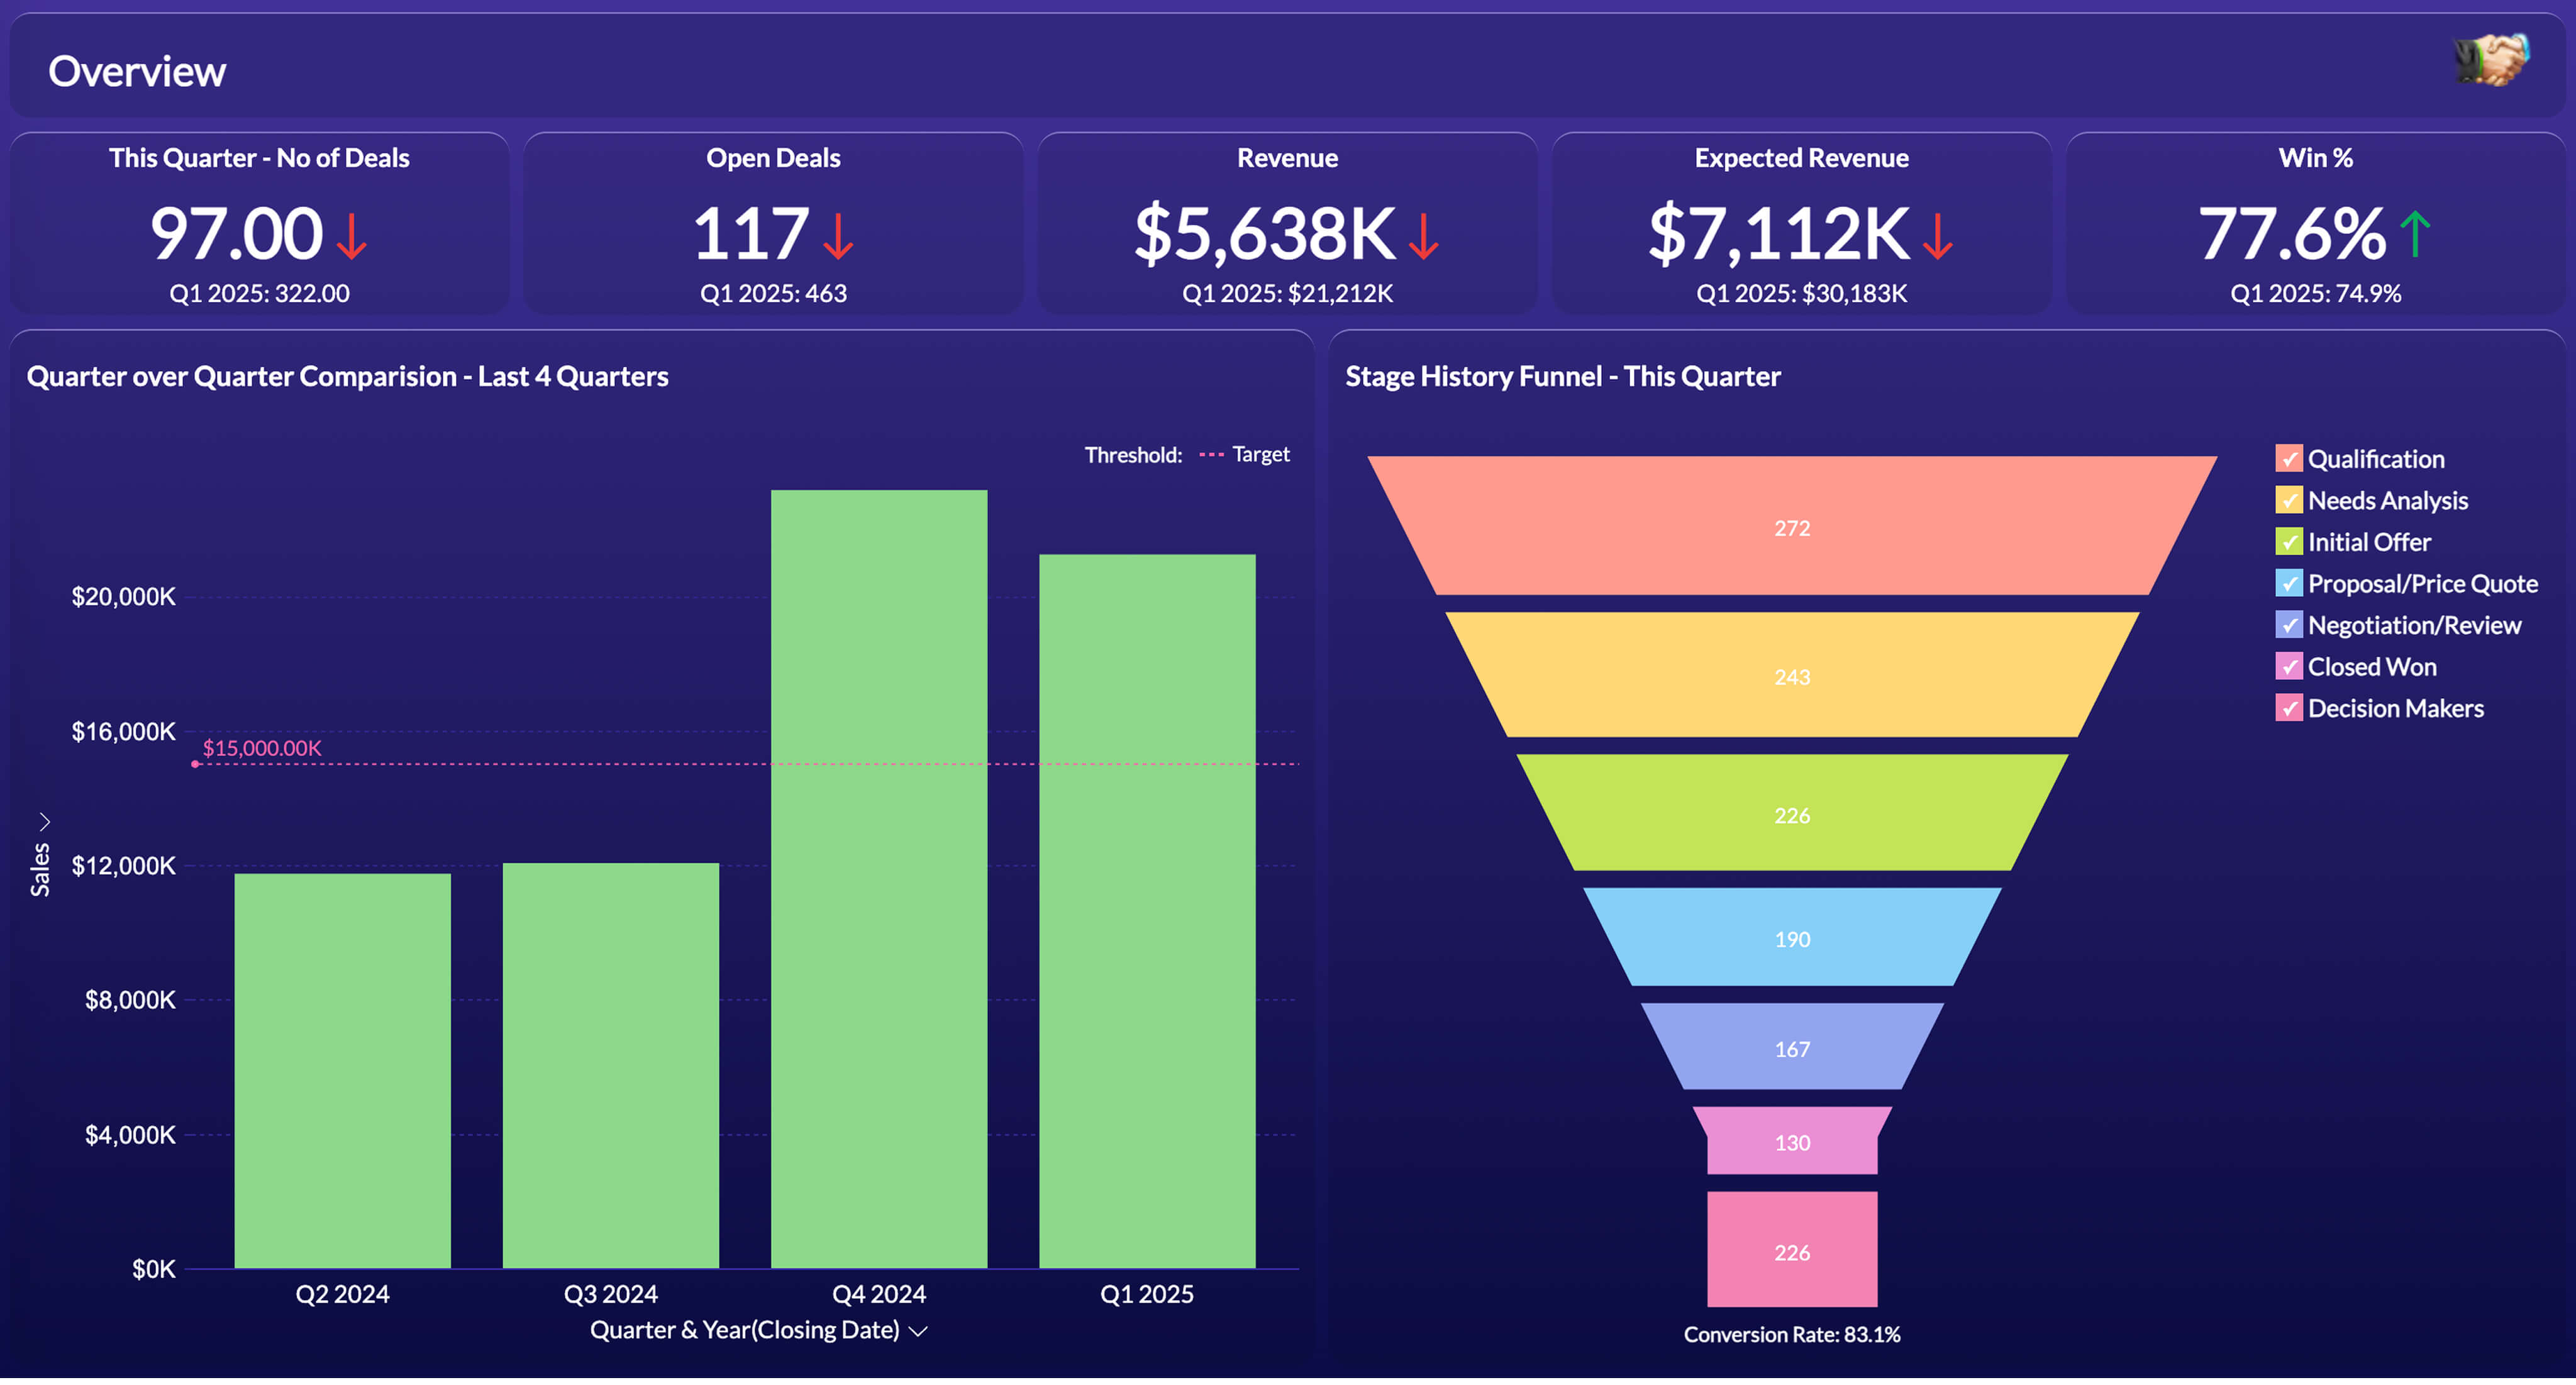
Sales
BI reporting with sales analytics tools can show the full prospect journey from first interest to final purchase. Behavior and preference data help teams build targeted campaigns with messaging that fits each audience.
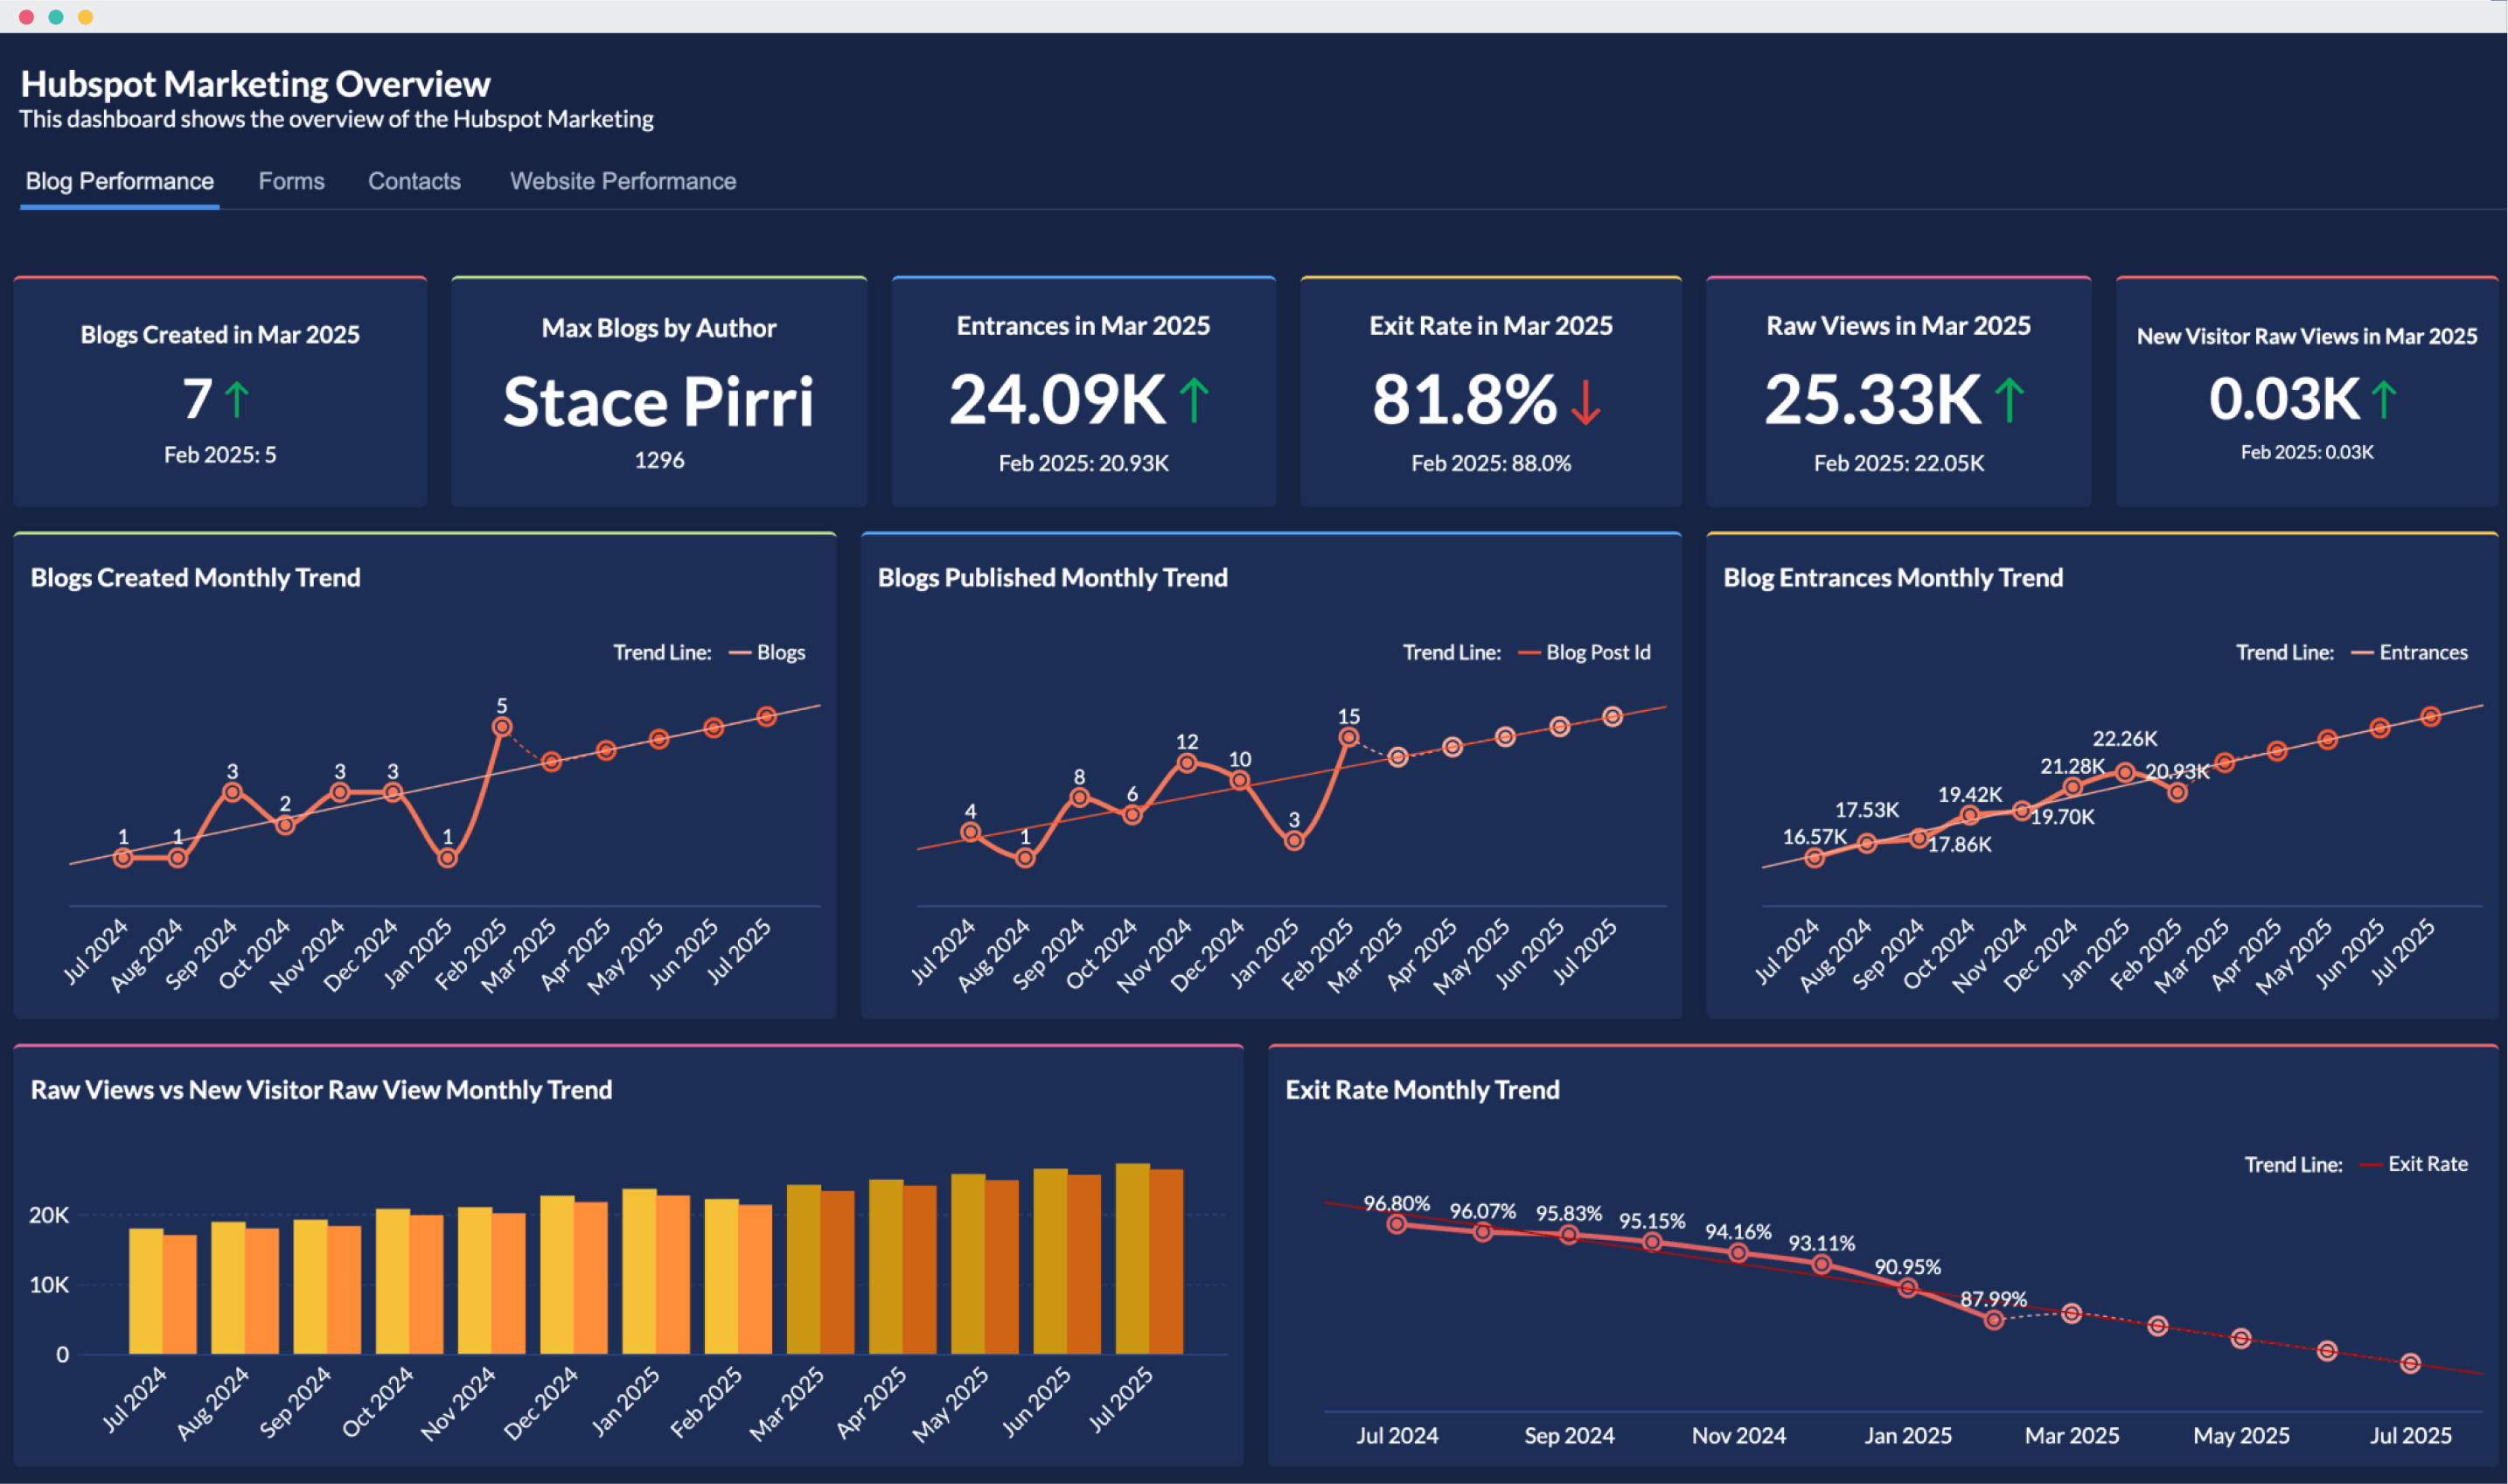
Marketing
Track reach, engagement, and conversion rates for your marketing initiatives with BI reporting and marketing analytics software. Share the numbers stakeholders need for awareness, monitoring, and decision-making.
Create your first report with Zoho Analytics
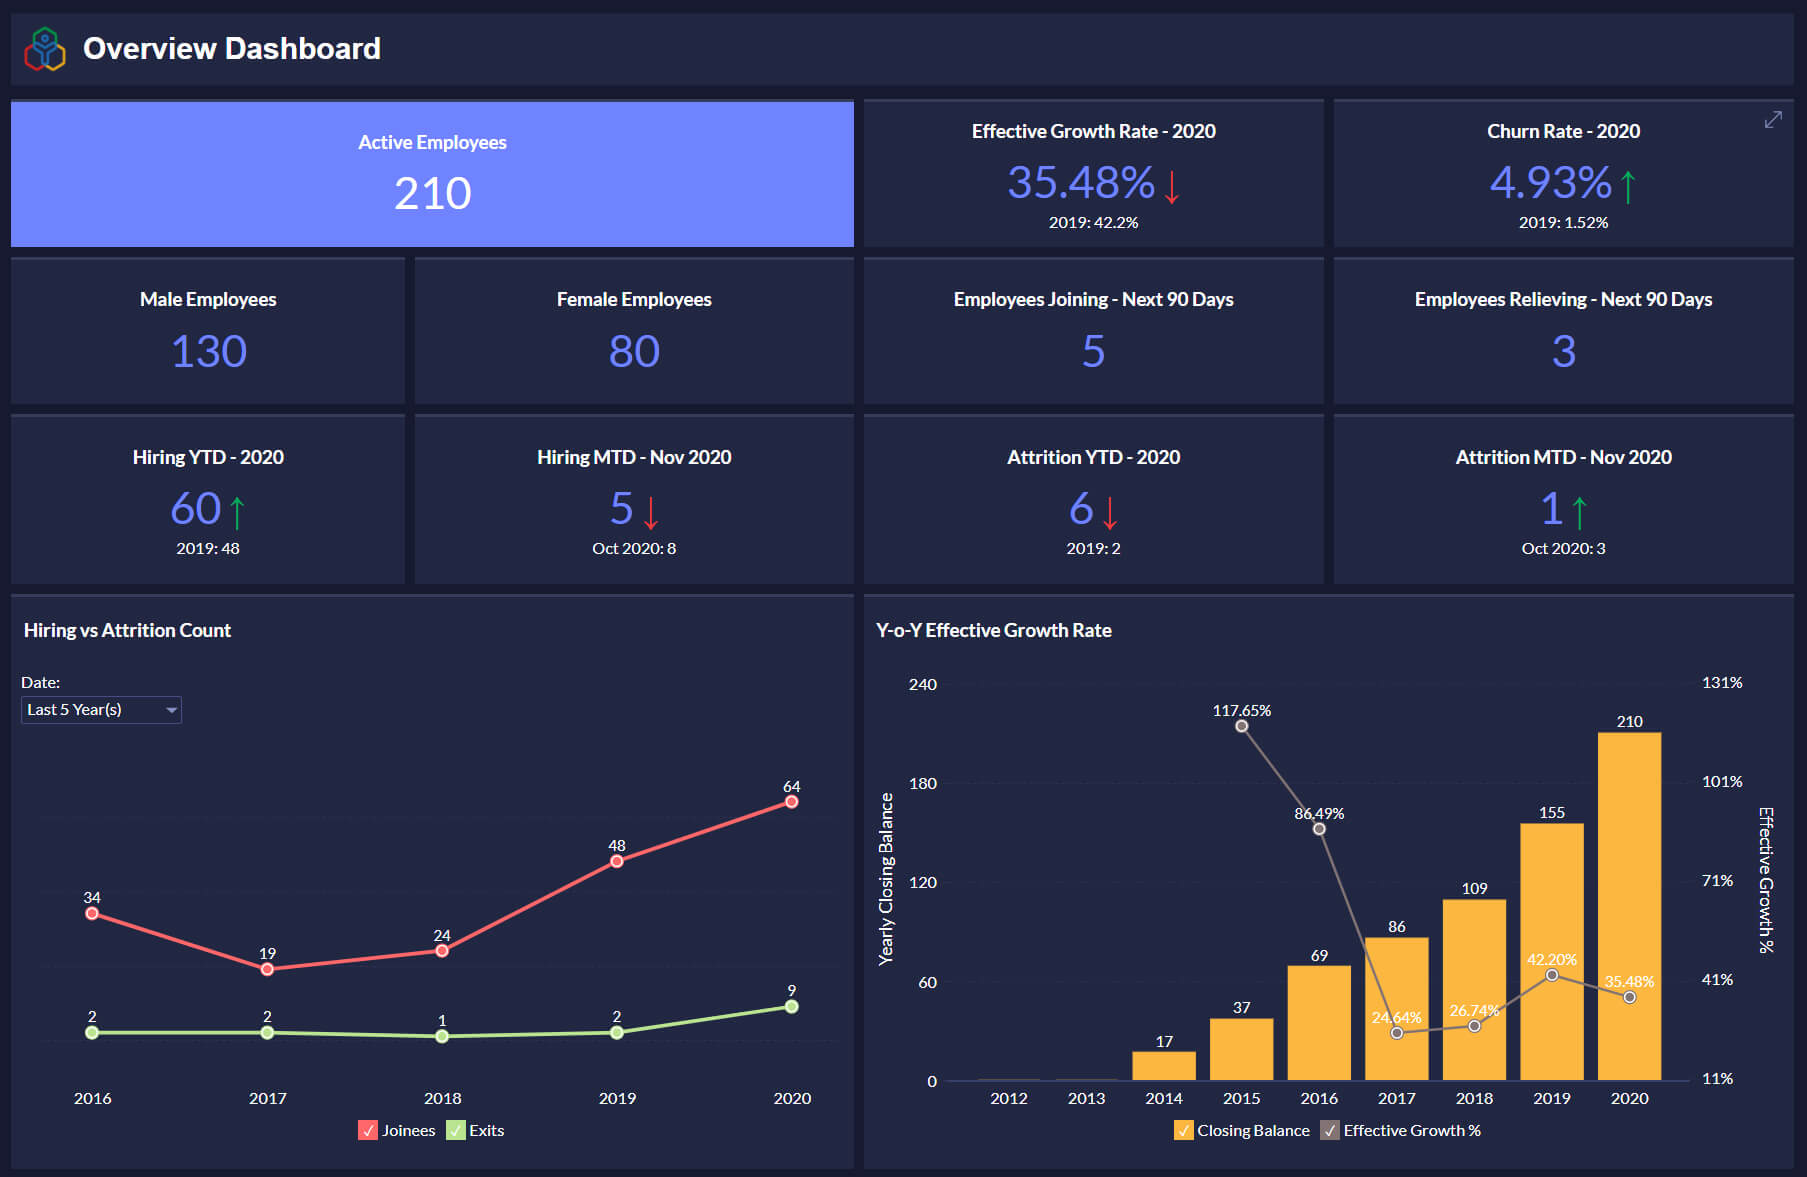
Human Resources
BI reporting gives HR timely insight on hiring, benefits, retention, and skill gaps. HR can also coordinate with other departments on workforce planning and monitoring. Know more about building HR dashboards.
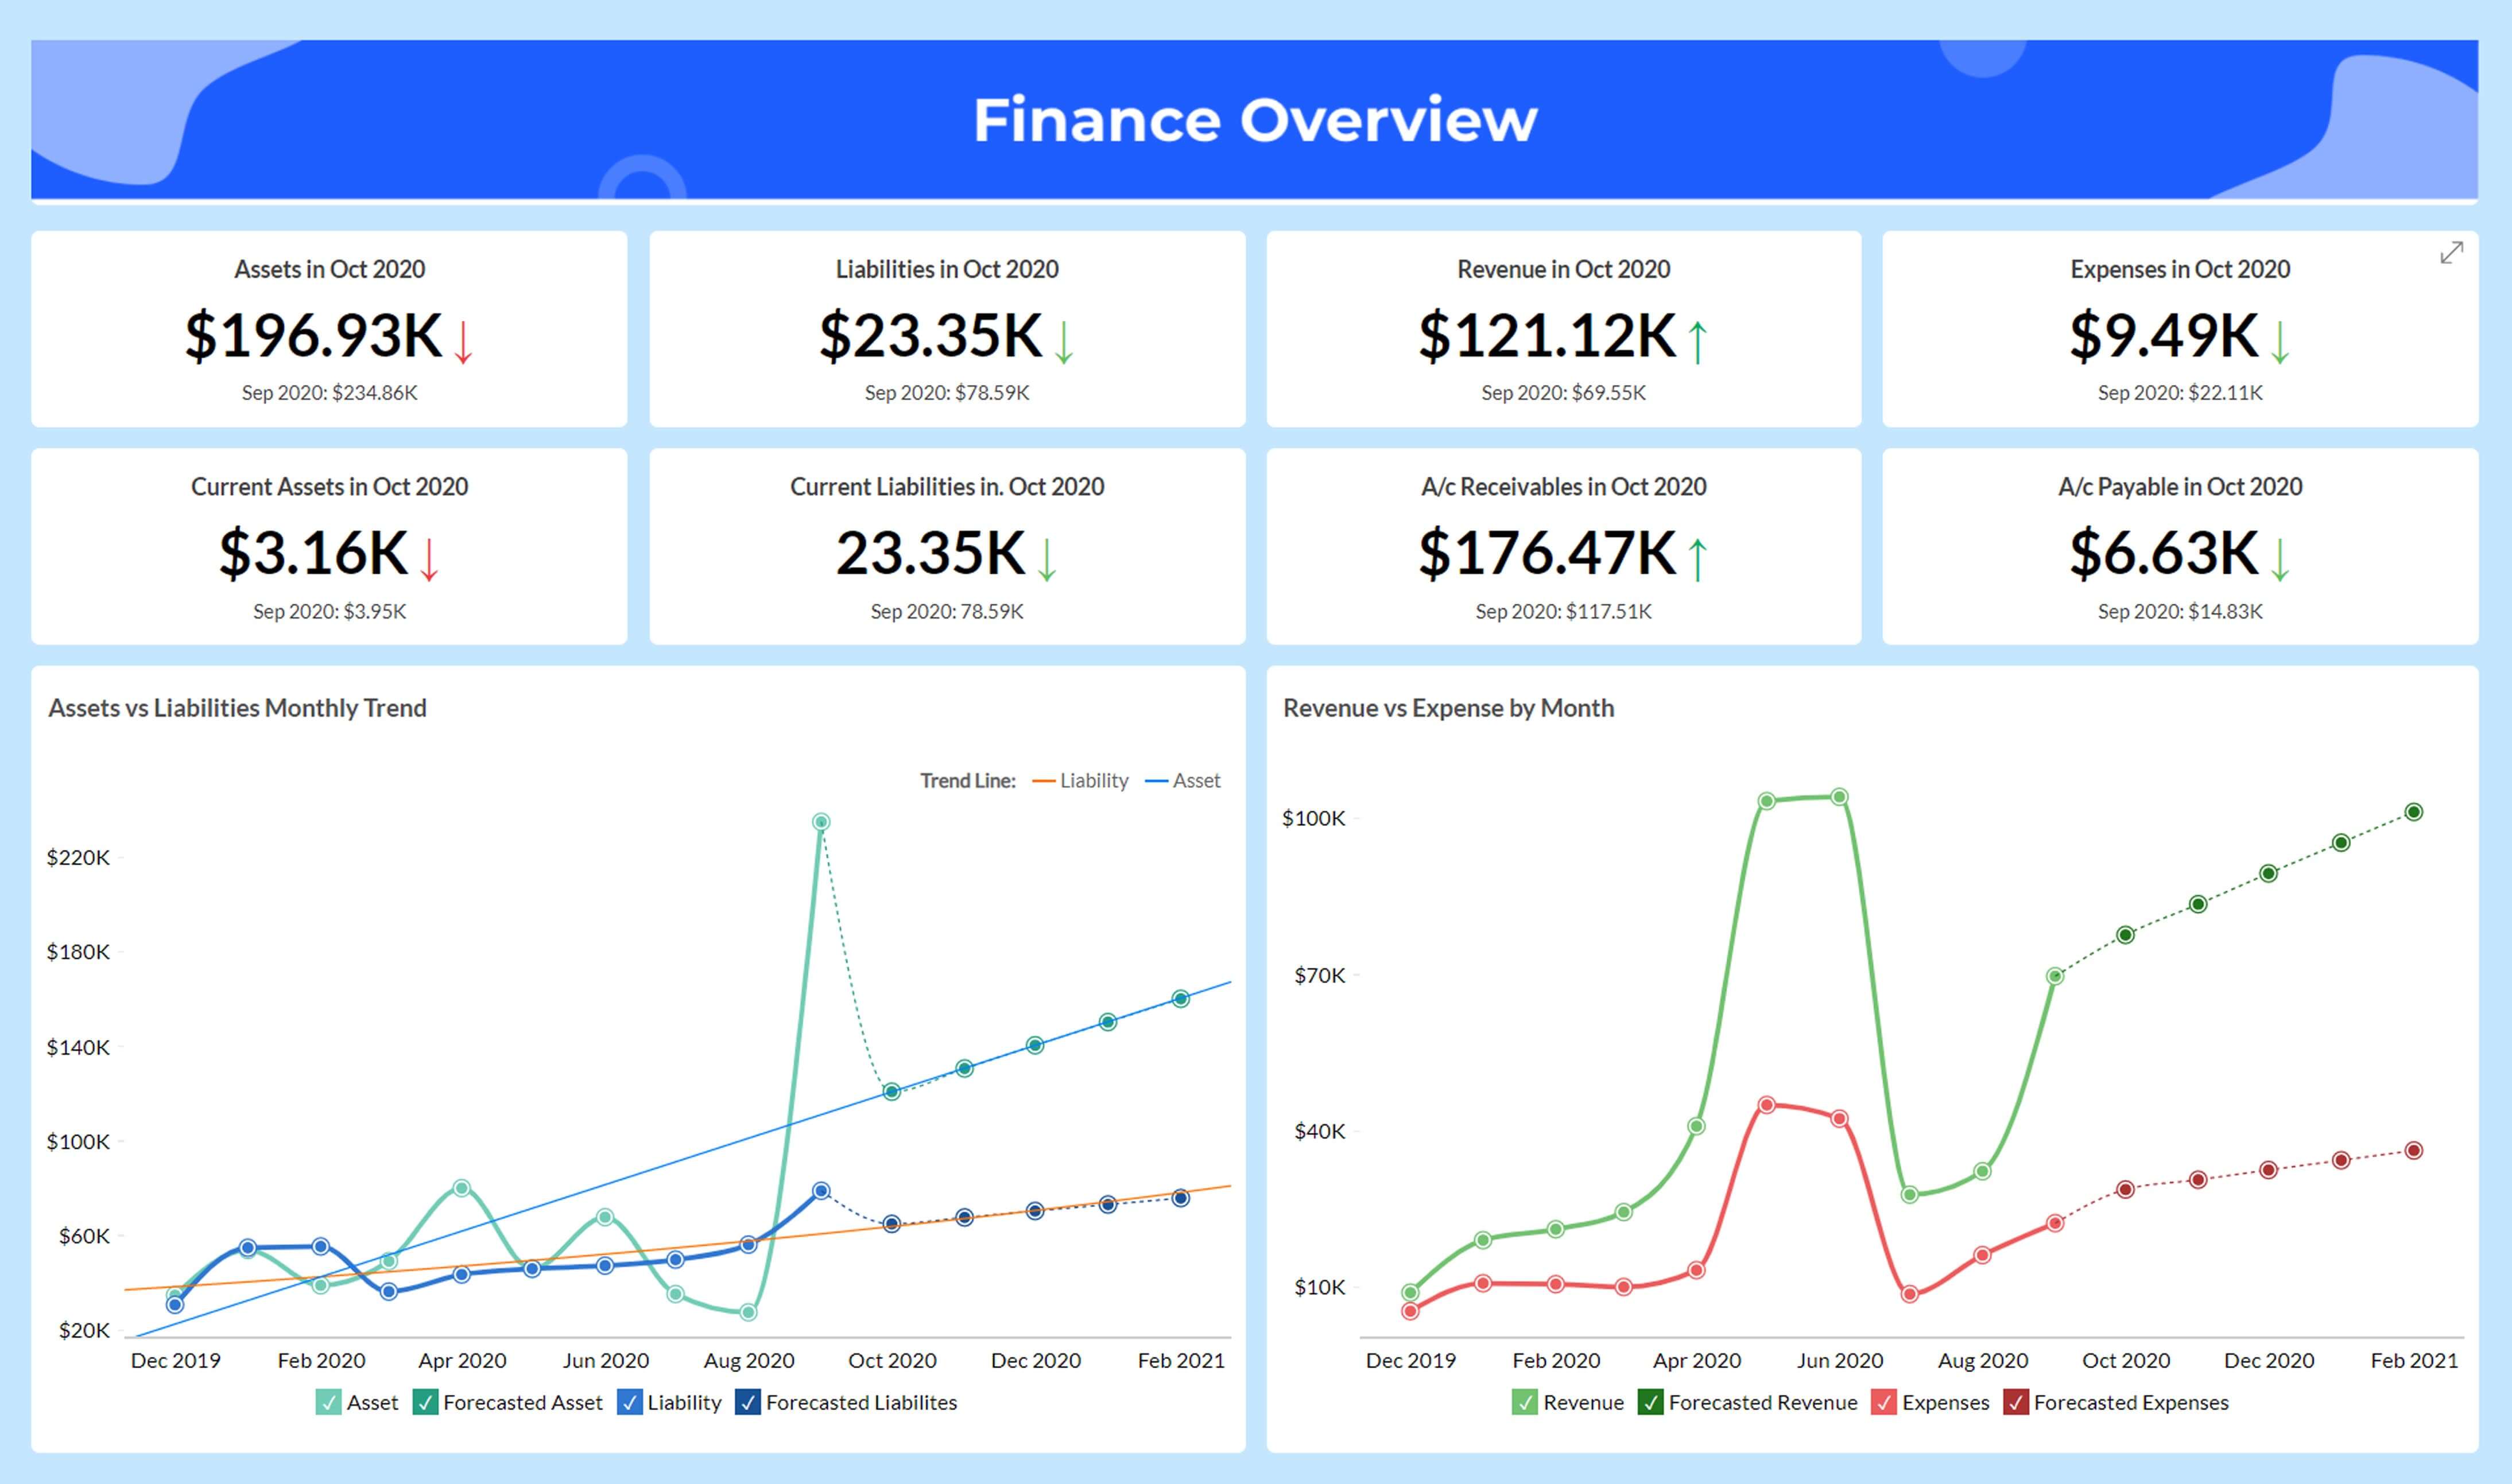
Finance
Track cash flow, profit margins, forecasted revenue, and other indicators to monitor an organization's financial health and performance. Know more about financial analytics.
Customer Service
BI reporting shows support agent performance, customer satisfaction, retention, and related metrics. Teams can adjust customer experience based on what the data shows.
Core Components of BI Reporting
BI reporting runs on a repeatable cycle. The main components of the process are:
- Data collection: Raw data comes in from files and feeds, local or cloud databases, business applications, information systems, and other sources. Teams cleanse, transform, and model it before analysis begins.
- Data Analysis: Users work with self-service BI components like charts, tables, and widgets. From there they build interactive reports and dashboards for ad-hoc analysis and collaboration with peers.
- Presentation: Executive reports and executive dashboards are the default output, but insights can also go into slideshows, portals, or embedded views inside the tools people already use.
- Collaboration: Enable collaborative analytics with fine-grained access controls, contextual comments, and in-report discussions through built-in messaging tools.
A quality Business Intelligence (BI) report communicates insights clearly and supports informed decisions. Here is a 4-step guide:
- Know your audience: Understand who will read the report and what they need from it. Role, format preference, font, colors, and layout all matter.
- Handle diverse data: Pull relevant data from every source that applies. Cleanse, transform, and enrich it, then pick the visualization that fits each data type.
- Add interactivity: Drill-down, filtering, and sorting let users explore the report and find detail on their own in real time.
- Follow brand guidelines: Keep reports consistent in look and function by following brand standards and data governance rules.
Best practices of Business Intelligence reporting
- Comprehend User Needs: Before setting up a BI reporting system, understand your end users: their persona, their specific needs, and how they behave. That groundwork helps you build reports they will actually use.
- Establish Data Governance: Apply data governance practices for BI reporting: data standards, clear ownership, regular audits, and routine cleanup. That keeps data quality and consistency intact, especially for cloud BI reporting.
- Use Key Performance Indicators (KPIs): Identify apt key performance indicators (KPIs) that align with organizational goals and use KPI dashboards to provide actionable insights to decision makers.
- Enable Interactivity: BI reporting with drill-downs, filters, and automated insights lets users explore data and find contextual detail. Plan for mobile BI so users can access and interact with reports on the go.
- Keeping reports up-to-date: Refresh and update data so BI reports reflect the latest information. Gather user feedback regularly to keep reports relevant.
- Build Collaboration: BI reporting with sharing, contextual comment threads, and similar features helps stakeholders work from the same data and make decisions together.
"The best BI platform available on the market is Zoho Analytics, given its value for money, and integration with Zoho apps, Social Media app, Google Big Query and AWS. This made it easy for us to commit to this platform."
Jaideep TibrewalaHead of Product, Glide InvestCommon BI reporting challenges and considerations
BI reporting delivers real value, but teams hit predictable obstacles along the way. Naming those obstacles early makes the system easier to sustain.
Here are some common BI reporting challenges for consideration:
Data Quality and Integration
- Challenges: BI reports go wrong when source data is inconsistent or when pulling data from multiple systems takes longer than the reporting cycle allows.
- Consideration: Standardize data formats, assign ownership, and use data integration tools that keep one reliable dataset behind your reports.
Tool Complexity & Usage
- Challenge: Some BI reporting features are complex by design, which makes them hard for non-technical users to adopt.
- Consideration: More people will use the full toolset when you:
- Run training sessions and publish clear documentation for the BI reporting tool.
- Treat data access as a normal part of the job: upskill stakeholders and explain how to read and use reports in their role.
Data Security
- Challenge: In today's big data analytics era, with so much of threats and challenges to data security and privacy all around, it is natural for organizations to be skeptical about the data security practices of third-party BI tools.
- Consideration: BI vendors should give clients the controls and setup options they need to protect data: access rules, encryption, audit logs, and compliance settings.
"It’s not just the reporting; it’s how seamlessly Zoho Analytics fits into everything else we do in the business"
Jeff HawleyVice President, Marketing, American Music & Sound / JAM Industries US MI/ProZoho Analytics for BI Reporting in Your Workflow
Zoho Analytics covers the full BI reporting lifecycle with depth, flexibility, and an interface that works for technical and non-technical users. A few specifics:
- End-to-End Reporting: Zoho Analytics handles data preparation, modeling, reporting, and sharing in one product. You do not need separate tools for each step.
- AI-Powered Insights: With Zia, Zoho's built-in AI assistant, users can ask questions in natural language, get instant answers, and generate narrative summaries without writing code.
- Multi-Source Data Integration: Connect and blend data from 250+ sources, including files, cloud drives, local and cloud databases, and popular business applications.
- Embedded Analytics: Deliver custom-branded reports or embedded analytics in your own applications using Zoho's developer tools and white-labeling options.
- Secure Sharing & Collaboration: Share reports with role-based access controls, comment in context, and hold in-report discussions through built-in messaging.
"The best BI platform available on the market is Zoho Analytics, given its value for money, and integration with Zoho apps, Social Media app, Google Big Query and AWS. This made it easy for us to commit to this platform."
Jaideep TibrewalaHead of Product, Glide InvestOn the evaluation side, Zoho Analytics has the features most teams look for in BI reporting software: broad data connectivity, flexible visualization options, advanced analytics, customization, and an interface that does not require a dedicated analyst to operate.
If you are comparing tools on capability, Zoho Analytics is worth a close look. You can build customizable reports and dashboards at scale.
Zoho Analytics as a Business Intelligence(BI) reporting software has a strong track record for teams that need reporting without a long implementation cycle. Plans start free, with paid tiers when you need more users or data volume.
Security, data quality, and tool complexity are common objections before any BI rollout. Zoho Analytics addresses these with role-based access controls, governed data models, and guided onboarding for non-technical users.
Whether you are starting from spreadsheets or consolidating data from multiple business apps, Zoho Analytics fits into an existing workflow without forcing a full platform migration on day one.
Get started freeFrequently Asked Questions
What are the Types of Standard BI Reports?
- Standard BI reports and dashboards usually fall into four categories. Strategic reports track long-term objectives through high-level metrics. Operational reports monitor day-to-day processes, often in real time. Analytical reports focus on a specific analysis goal with detailed findings. Tactical reports help middle managers track department or function performance over periods like daily, monthly, or yearly.
How does business intelligence reporting work?
- BI reporting follows a repeatable cycle. Data is collected from files, databases, business applications, and other sources, then cleansed, transformed, and modeled. Users analyze that data through self-service BI components like charts, tables, and widgets to build interactive reports and dashboards. Insights are delivered through reports, dashboards, slideshows, portals, or embedded views. Stakeholders then collaborate through comments or messaging to act on what they see.
What are the features you should look for when evaluating BI reporting tools?
- When evaluating Business Intelligence (BI) reporting tools, look for broad data connectivity across databases, spreadsheets, cloud storage, and external APIs. Check data visualization options such as charts, graphs, maps, and BI dashboards. Review advanced analytics capabilities like predictive analytics, scenario analysis, and machine learning (ML) powered features. Confirm customization options for reports, dashboards, and branding. Finally, assess ease of use: both technical and non-technical users should be able to navigate the tool and build reports without extensive training.