Advanced Analytics for LinkedIn Pages
Advanced Analytics for LinkedIn Pages enables you to analyze the activity and general engagement metrics of your page. This helps you grow your followers by understanding how you gain them. Apart from analyzing your LinkedIn Page activity, you can also blend data from other sources to get end-to-end insights of your entire business function.
Advanced Analytics for LinkedIn Pages includes a set of prebuilt reports and dashboards over your LinkedIn Pages activity data. The LinkedIn Pages Analytics workspace is Ask Zia trained and can answer your questions with appropriate reports within minutes.
General
- What is Zoho Analytics?
- Why LinkedIn Pages Advanced Analytics?
- Who can subscribe to the Zoho Analytics LinkedIn Pages connector?
Pricing & Trial
- How much does this connector cost?
- Do you provide trial evaluations for this connector?
- What do you mean by 'Users' in the (connector) pricing plan?
- What do you mean by 'Rows'/'Records' and how is it calculated in the pricing plan?
Setup
- How do I set up the LinkedIn Pages Advanced Analytics?
- How long should I wait for my LinkedIn Pages data to initially appear in Zoho Analytics?
- What are the modules and fields in LinkedIn Pages will be synchronized in Zoho Analytics Workspace?
- I got this email which said 'Setup Process Failed'/'Synchronization Process Failed'. What should I do?
- How frequently can I synchronize my data with Zoho Analytics?
- Can I edit the LinkedIn Pages connector Synchronization setting?
- Can I synchronize my LinkedIn Pages data instantly?
- Can I set up the LinkedIn Pages Advanced Analytics in any other existing Workspace or in any other Advanced Analytics Workspace?
- Can I add/modify data in the LinkedIn Pages data tables within Zoho Analytics?
- Can I add new columns to the LinkedIn Pages data tables within Zoho Analytics?
- Can I add new data tables in this Workspace to create reports & dashboards?
- Can I transfer my Zoho Analytics connector to another admin account?
- How do I re-authenticate my LinkedIn Pages account in Zoho Analytics?
- How can I remove the Integration?
Reporting Features
- What modules and fields in LinkedIn Pages can I create reports on?
- How do I create my own reports with this connector?
- Can I create reports using the columns from different modules?
- What are the report types supported by Zoho Analytics?
- What are the default reports & dashboards created by Zoho Analytics, on setting up this connector?
- What is Ask Zia? How can I create reports using Zia?
- What are Formulas in Zoho Analytics?
- What are the default formulas that get added by Zoho Analytics on setting up this connector?
- How do I create my own custom formulas in Zoho Analytics?
- Can I combine data from other sources with the data from LinkedIn Pages to create reports and dashboards?
- Can I join data from multiple tables to create reports?
- What are Query Tables?
Cross-Functional Analytics with Popular Business Applications
- What are the popular business applications that I can integrate this connector with?
- How can I analyze the data from the other business applications along with LinkedIn Pages Advanced Analytics?
- Will a lookup relationship between the related modules from LinkedIn Pages and other third-party applications be created automatically?
Users, Sharing & Collaboration
- How do I share the reports in Zoho Analytics with my colleagues?
- What are the user roles available in Zoho Analytics?
- Why can't other users edit the reports that I have shared with them?
- Can I share the same report created, to multiple users with different criteria associated so that they see different data?
- Can I export a report/dashboard?
- Can I print the reports & dashboards created in Zoho Analytics?
- Can I email reports & dashboards created in Zoho Analytics in a scheduled manner?
- Can I embed/create a permalink for reports & dashboards created in Zoho Analytics?
- Can I create Slideshow in Zoho Analytics?
Solutions
Help & Support
General
1. What is Zoho Analytics?
Zoho Analytics is a business intelligence and analytics solution that helps you derive insights from your business data, through its powerful reporting and analytical capabilities. You can create dynamic and interactive reports and dashboards in minutes, with no IT help.
It offers the following important capabilities:
- Complete Online Business Intelligence and analytics service, accessible anytime, anywhere!
- Easy-to-adopt a spreadsheet-like interface with powerful drag-and-drop based reporting features for quick report creation.
- Visual analysis capability for in-depth analysis and to slice & dice your data.
- Supports a wide range of reporting capabilities like Dashboards, Charts, Pivot Views, Summary Views, and simple Tabular Views.
- Supports the creation of KPI widgets in dashboards to analyze performance.
- Supports data import from a variety of file formats like Excel, JSON, HTML, and more. Also supports data import from cloud storage and Web URLs. Supports periodic scheduling of importing data.
- Integrated with a suite of Zoho products such as Zoho CRM, Zoho Desk, Zoho Projects, Zoho BugTracker, Zoho Books, and more.
- Integrated with popular business applications like Facebook Pages, Facebook Competitive Analytics, Twitter, Twitter Competitive Analytics, and more.
- You can also integrate your own applications with Zoho Analytics using the Zoho Analytics API.
- Integrated with Zapier to power up importing from over 500+ apps.
- Blend and merge data from across different sources to create meaningful business reports.
- With an advanced formula engine, you can derive key business metrics from your data.
- Supports SQL -driven (Structured Query Language) querying for powerful report creation.
- Real-time collaboration by sharing data and reports with your colleagues and friends, in either read or read-write modes.
- Export and Print reports in a variety of formats. Notify reports via email.
- Publish reports for wider consumption. Embed reports within your websites, web applications and blogs.
- Highly secure as all users login only over HTTPS (SSL connection).
- All your data and reports are hosted in highly secure data centers. (Refer to Security and Privacy)
- Supports Logo Rebranding.
2. Why LinkedIn Pages Advanced Analytics?
It's a full-featured business intelligence (BI) and reporting tool that can slice and dice LinkedIn Pages data, to create any report or dashboard you require.
- Create your own reports and dashboards based on not only your Zoho SalesIQ data but also data from other data sources.
- Blend Data - Build cross-functional visualizations to extract end-to-end insights by combining data from a wide range of business applications.
- Ask Zia - Workspace is trained for Ask Zia, our intelligent assistant, which can answer your question immediately.
- Share reports and dashboards with your colleagues.
- Set up Alerts to get notifications on immediate changes in your key business metrics.
- Schedule and email your reports whenever you want.
- Export your reports as PDF, HTML, Excel, CSV and image files.
- Embed your reports on websites, blogs, etc.
3. Who can subscribe to the Zoho Analytics LinkedIn Pages connector?
Users with paid accounts of Zoho Analytics or Zoho CRM Plus / Zoho One users can take advantage of this connector.
Users with the Administrator roles (Account Administrator or Organization Administrators) in Zoho Analytics, and with the Administrator roles on LinkedIn, can configure this connector.
Pricing & Trial
1. How much does this connector cost?
LinkedIn Pages Advanced Analytics is bundled free for all paid users of Zoho Analytics. The Zoho Analytics paid plans start at $25 per month. Click to learn more about Zoho Analytics pricing.
2. Do you provide trial evaluations for this connector?
Yes, we do provide a 15-day free trial for this connector. The trial for the Standard plan will be enabled from the date you set up the connector.
3. What do you mean by 'Users' in the (connector) pricing plan?
Anyone to whom you privately share your Workspace, tables (data), reports and dashboards, created in Zoho Analytics for collaboration is considered a 'User' in Zoho Analytics. A user is identified by their unique email address, with which their Zoho Analytics account was registered.
Suppose you subscribe to the Zoho Analytics Standard plan_you can privately share the data/reports in your account and collaborate with 4 other persons. Now your Zoho Analytics account is said to have 5 users (including yourself).
4. What do you mean by 'Rows'/'Records' and how is it calculated in the pricing plan?
In Zoho Analytics, a row or record is defined in the same context as in a database (or spreadsheet). In simple terms, a table consists of rows (records) and columns (fields). Each row in a table represents a set of related data and has the same structure.
For example, in a table for a Campaign, each row would represent a single record. The number of rows calculated for pricing is the sum of all rows/records stored across all your Workspace tables in your Zoho Analytics account.
Setup
1. How do I set up LinkedIn Pages Advanced Analytics?
2. How long should I wait for my LinkedIn Pages data to initially appear in Zoho Analytics?
Initial data import will take from a few minutes to a couple of hours depending on the volume of the data. You will receive an email notification once the import is complete. If you access the Workspace before the initial fetch, it will not display any data.
3. What modules and fields in LinkedIn Pages will be synchronized in the Zoho Analytics Workspace?
You can synchronize the following data from LinkedIn Pages into Zoho Analytics.
- Follower Counts By Country - Country Name, PageID, Organic Follower Count, Paid Follower Count, Total Followers
- Follower Counts By Date - Date, PageID, Organic Follower Count, Paid Follower Count, Total Followers
- Follower Counts By Function - Function Name, PageID, Organic Follower Count, Paid Follower Count, Total Followers
- Follower Counts By Industries - Industries Name, PageID, Organic Follower Count, Paid Follower Count, Total Followers
- Follower Counts By Regions - Regions Name, PageID, Organic Follower Count, Paid Follower Count, Total Followers
- Follower Counts By Seniority - Seniority Name, PageID, Organic Follower Count, Paid Follower Count, Total Followers
- Follower Counts By Staff Count Range - Staff Count Range Name, PageID, Organic Follower Count, Paid Follower Count, Company Size (Employees), Total Followers
- Page Statistics By Country - Country Name, All Page Desktop Views, All Page Mobile Views, All Page Views, Careers Page Views, Jobs Page Views, Life At Page Views, Overview Page Views, PageID, Insights Page Views, People Page Views, About Page Views
- Page Statistics By Date - Date, Careers Page Banner Promo Clicks, Careers Page Jobs Clicks, Jobs Page Mobile Views, Jobs Page Mobile Unique Views, PageID, Careers Page Views, Careers Page Unique Views, Life At Page Mobile Views, Life At Page Mobile Unique Views, Insights Page Views, Insights Page Unique Views, About Page Mobile Unique Views, All Page Mobile Views, All Page Mobile Unique Views, Jobs Page Views, Jobs Page Unique Views, People Page Views, People Page Unique Views, About Page Views, About Page Unique Views, Overview Page Views, Overview Page Unique Views, Life At Page Views, Life At Page Page Unique Views, Careers Page Mobile Unique Views, All Page Views, All Page Unique Views, Insights Page Mobile Views, Insights Page Mobile Unique Views
- Page Statistics By Function - Function, All Page Desktop Views, All Page Mobile Views, All Page Views, Careers Page Views, Jobs Page Views, Life At Page Views, Overview Page Views, PageID, Insights Page Views, People Page Views, About Page Views
- Page Statistics By Industries - Industry, All Page Desktop Views, All Page Mobile Views, All Page Views, Careers Page Views, Jobs Page Views, Life At Page Views, Overview Page Views, PageID, Insights Page Views, People Page Views, About Page Views
- Page Statistics By Region - Region, All Page Desktop Views, All Page Mobile Views, All Page Views, Careers Page Views, Jobs Page Views, Life At Page Views, Overview Page Views, PageID, Insights Page Views, People Page Views, About Page Views
- Page Statistics By Seniority - Seniority, All Page Desktop Views, All Page Mobile Views, All Page Views, Careers Page Views, Jobs Page Views, Life At Page Views, Overview Page Views, PageID, Insights Page Views, People Page Views, About Page Views
- Page Statistics By Staff Count Range - Staff Count Range, All Page Desktop Views, All Page Mobile Views, All Page Views, Careers Page Views, Jobs Page Views, Life At Page Views, Overview Page Views, PageID, Insights Page Views, People Page Views, About Page Views, Company Size (Employees)
- Pages Informations - Name, PageID, Careers Page Banner Promo Clicks, Unique Impressions Count, Click Count, Engagement, Like Count, Comment Count, Share Count, Comment Mentions Count, Impression Count, Share Mentions Count, Industries, Website, All Page Desktop Views, All Page Mobile Views, All Page Views, Careers Page Views, Jobs Page Views, Life At Page Views, Overview Page Views, Insights Page Views, People Page Views, About Page Views
- Post Insights - Date, Lifecycle State, Message, Click Count, Like Count, Comment Count, Share Count, Page ID, Impression Count, Engagement, Post ID, Media Category, Network Visibility
- Share Statistics By Date - PageID, Date, Click Count, Engagement, Like Count, Comment Count, Share Count, Impression Count, Unique Impressions Counts
4. I got an email which said "Setup Process Failed'/'Synchronization Process Failed". What should I do?
The import/sync process of your LinkedIn Pages can fail sometimes, due to a variety of reasons. Hence, you may receive such emails occasionally. The Zoho Analytics team will look into it immediately and get back to you, after taking the required corrective action.
Case 1: You'll receive the Setup Process Failed email when there's a failure during the initial fetch. In this case, we request that you:
- Open the Workspace in which you have set up the connector.
- Click the Data Sources button in the Explorer.
- On the Data Sources page that opens click the Retry Now link.
Case 2: : You'll receive the Synchronization Failed email if there's any failure during the data synchronization process between LinkedIn Pages and Zoho Analytics, after the initial setup and importing of data. This might be a momentary failure due to internal issues. The import schedule will be suspended if there are five successive failures.
If the issue persists please write to support@zohoanalytics.com. We will look into it and help you resolve it
5. How frequently can I synchronize my data with Zoho Analytics?
You can choose to synchronize data at one of the intervals mentioned below.
- 1 Hour (Enterprise plan Only)
- 3 Hours
- 6 Hours
- 12 Hours
- Every day
Note:
- Users in Enterprise plan alone can choose to synchronize data at every 1 hour.
- Users in Basic plan can synchronize their data only once everyday.
6. Can I edit the LinkedIn Pages connector Synchronization setting?
Yes, you can edit the LinkedIn Pages connector synchronization setting if you're the administrator of the LinkedIn Pages Analytics.
To do so,
- Open the corresponding LinkedIn Pages Analytics Workspace in Zoho Analytics.
- Click Data Sources in the left panel. All the data sources of the workspace will be listed.
- Click LinkedIn Pages. The Data Sources page for LinkedIn Pages will open.
- In the Data Sources page that opens, click the Edit Setup link.
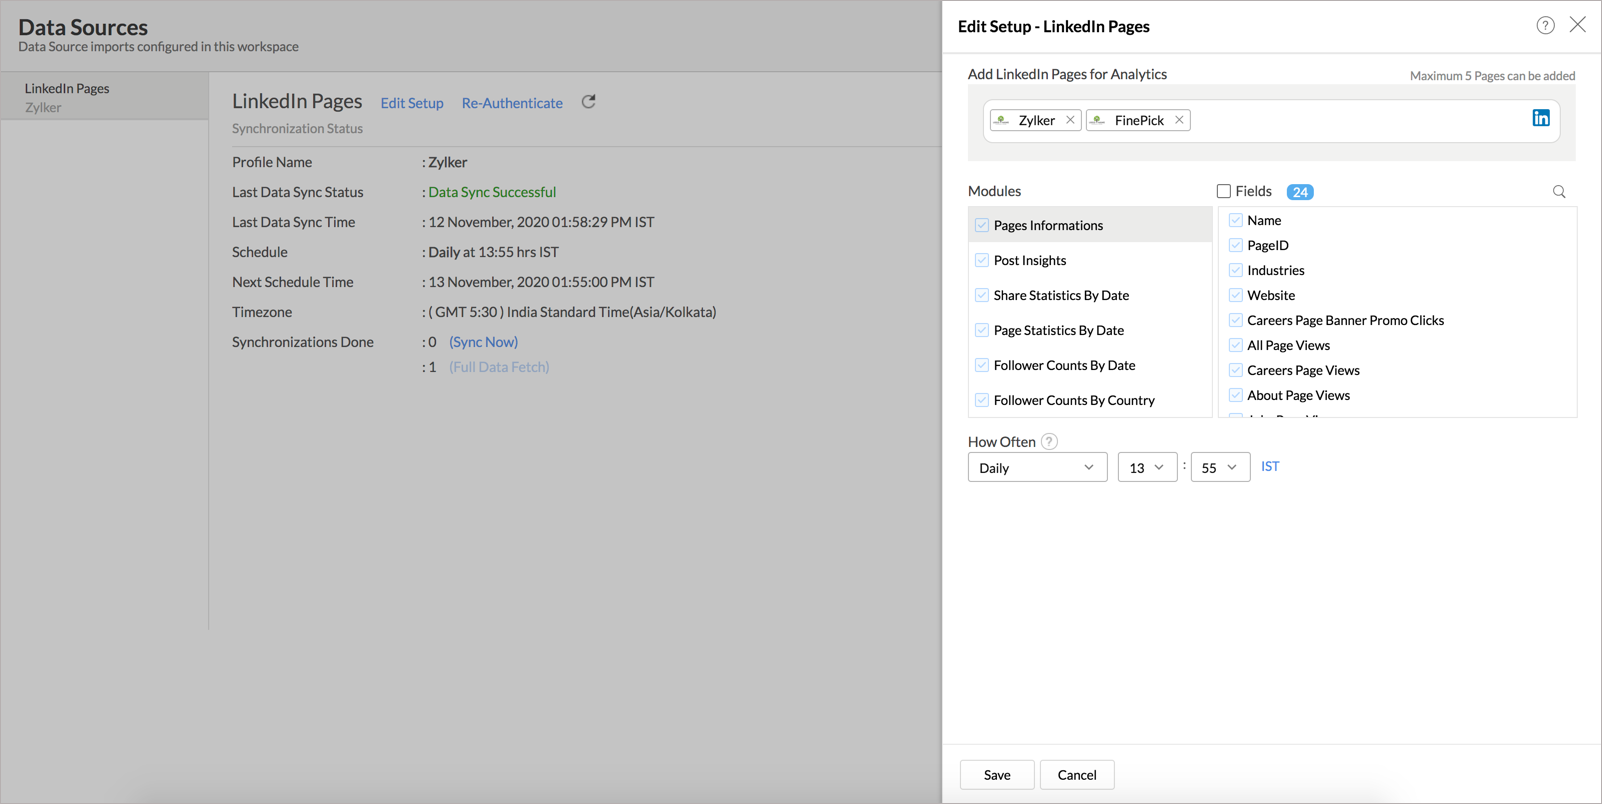
- The Edit Setup - LinkedIn Pages dialog will open. Modify the settings as needed.
- Click Save. The synchronization setting will be modified and data will be synced in the next synchronization interval.

7. Can I view the data synced history?
Yes, you can view the data synced history. Follow the below steps to view the data synced history.
- Open the corresponding LinkedIn Pages Analytics Workspace in Zoho Analytics.
- Click Data Sources on the left panel. All the data source of the workspace will be listed.
- Click LinkedIn Pages. The Data Sources page for LinkedIn Pages will open.
- In the Data Sources page that opens, click the Sync History link.
- A calendar with the sync history of the last 45 days will open. The date when the data sync has happened will be highlighted. Hover to view the number of times the data had got synced on a specific date.
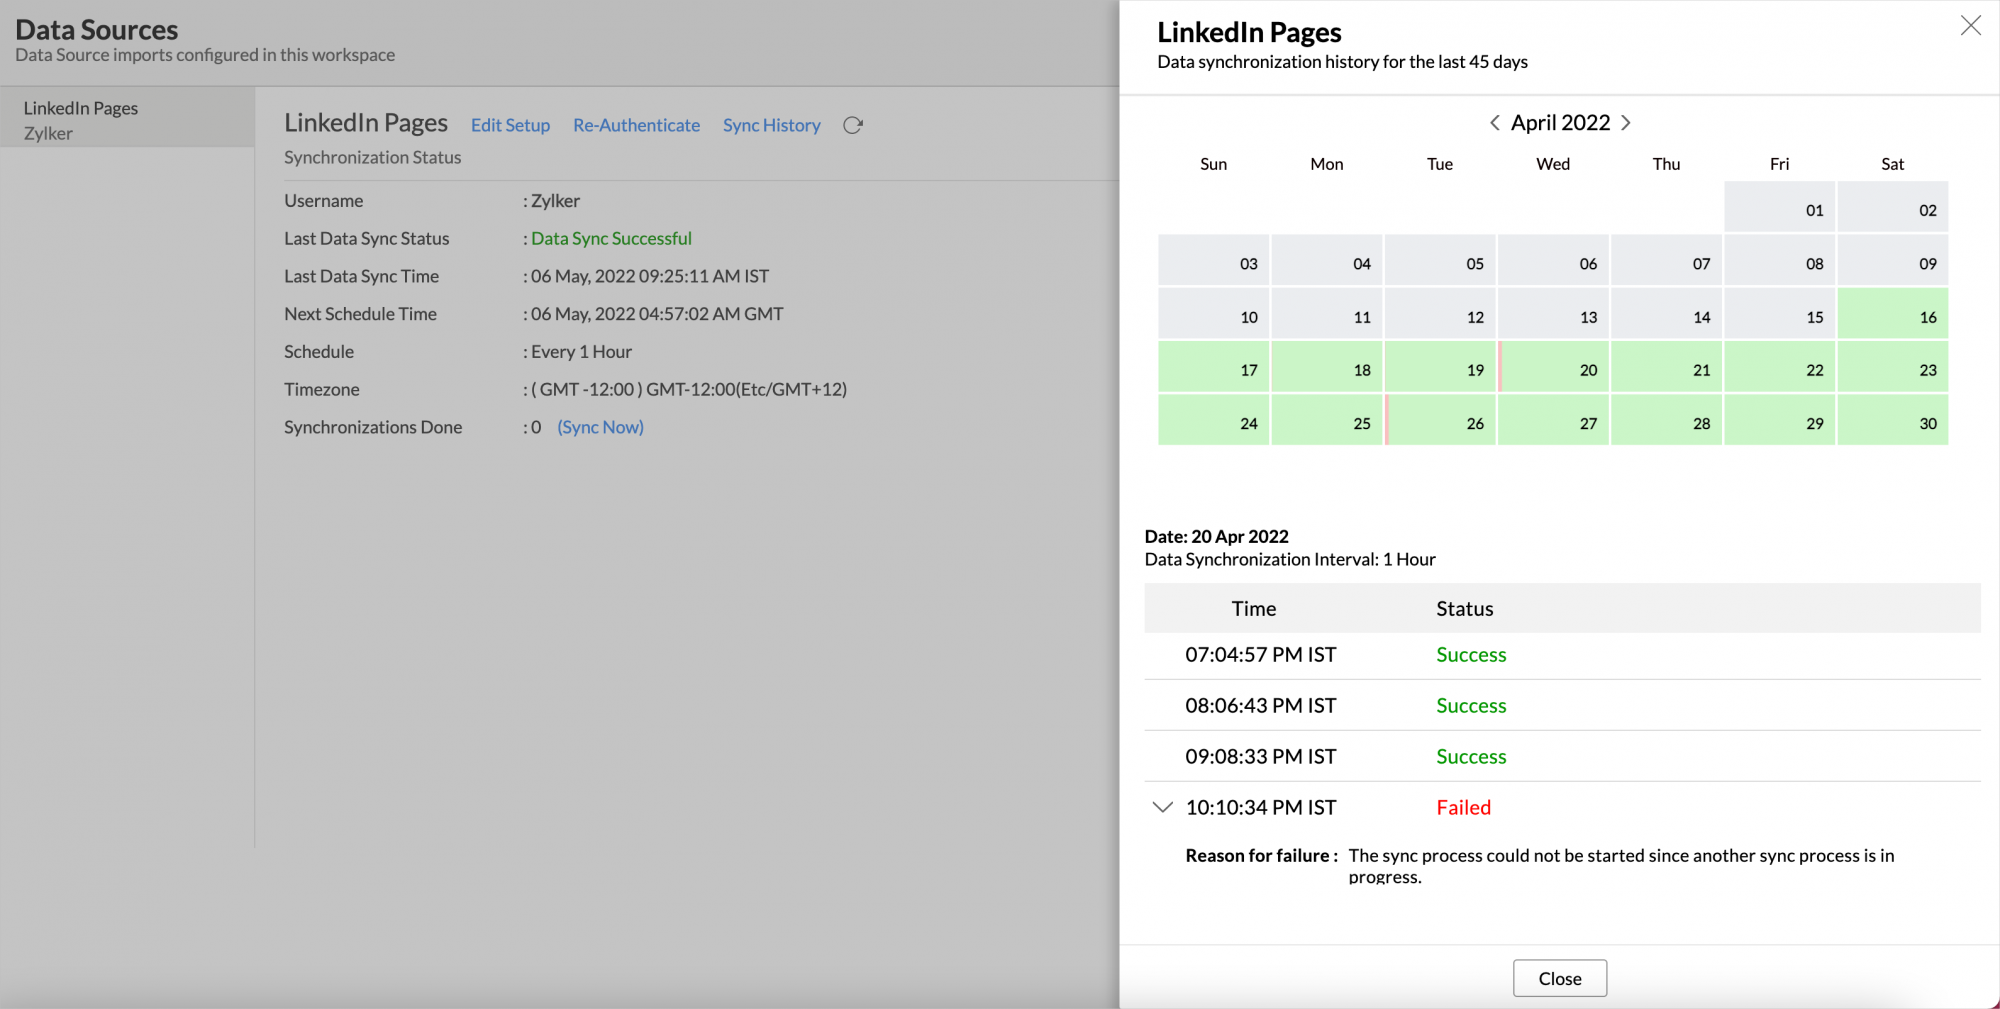
- Click the date to view more details.
- Time - Displays the time when the data is synced.
- Status - Shows whether the sync was a success or a failure.
In case of failure, the reason will be displayed. Refer to this page to learn how to resolve the issue and avoid further failure.

8. Can I synchronize my LinkedIn Pages data instantly?
Yes, you can synchronize your LinkedIn Pages data instantly when needed.
To synchronize your data instantly:
- Open the Data Sources page.
- Click Sync Now. LinkedIn Pages data will then get instantly synchronized.
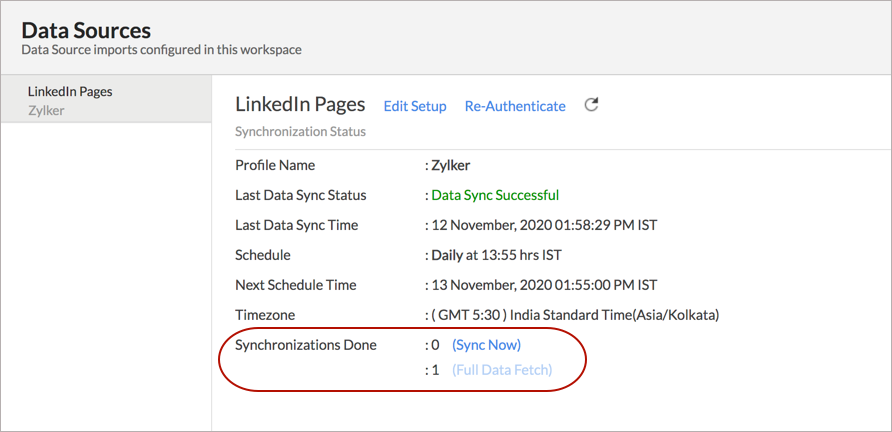

This option can be used up to five times between the scheduled intervals.
9. Can I set up LinkedIn Pages Advanced Analytics in any other existing Workspace or in any other Advanced Analytics Workspace?
Yes, you can set up the LinkedIn Pages Advanced Analytics in an existing Workspace or in any Advanced Analytics Workspace to analyze data together. You can do this by creating a new table by importing data.
10. Can I add/modify data in the LinkedIn Pages Advanced Analytics data tables within Zoho Analytics?
No, you cannot add/modify data in the LinkedIn Pages Advanced Analytics tables. Data from LinkedIn Pages will automatically get synced into Zoho Analytics in the different tables. You cannot edit any of this data or add new data records from within Zoho Analytics.
However, you can add new tables and add/import data into that, to create reports combining data with LinkedIn Pages data.
11. Can I add new columns to the LinkedIn Pages data tables within Zoho Analytics?
No, you cannot add new columns. But, you can add Formula Column and Aggregate Formulas (i.e., calculated fields) to these tables to help you create powerful reports. Refer to Adding Formulas to learn more about this.
12. Can I add new data tables in this Workspace to create reports & dashboards?
Yes, you can add new data tables. Click New > New Table/Import Data to add a new table in the existing LinkedIn Pages Advanced Analytics Workspace.
With this feature, you can import data from other sources or add them manually into your Workspace to analyze and create reports combining it with your LinkedIn Pages data.
References:
- Import Data from Files
- Import data from Feeds
- Import Data from Cloud Storages
- Importing Data from Cloud Databases
- Import Data from Local Databases
- Import Data from popular Business Applications
- Import Data using the Zoho Analytics API
13. Can I transfer my Zoho Analytics connector to another admin account?
Yes, the LinkedIn Pages connector in your account, can be transferred to another Administrator in the Organization.
An Account Administrator can transfer the connector by transferring the account to an Organization Administrator. An Organization Administrator can transfer the connector setup to another Administrator by unsubscribing from the Organization.
14. How do I re-authenticate my LinkedIn Pages account in Zoho Analytics?
You can re-authenticate the setup by following the steps below.
- Open the Data Sources page.
- Click the Re-authenticate. The Re-Authenticate LinkedIn Pages dialog will open.
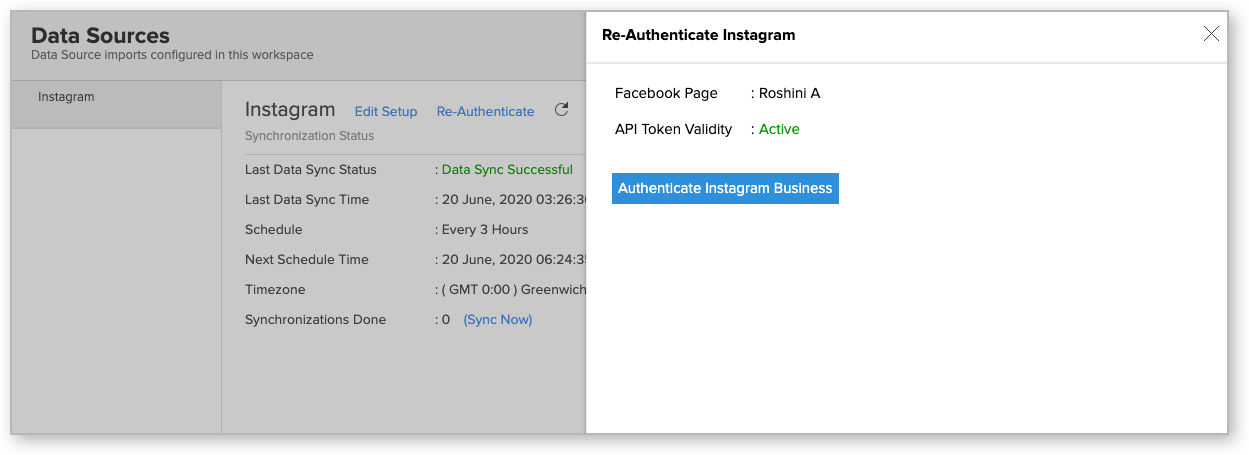
- Click theRe-authenticate LinkedIn Pages button. You will be prompted to provide credentials.
- Enter your credentials and re-authenticate your account.

15. How can I remove the integration?
You can remove the connector from the Data Sources page.
- Open the Data Sources page.
- Hover the mouse over LinkedIn Pages. A Settings icon will appear.
- Click the Settings icon, then select Remove Data Source.
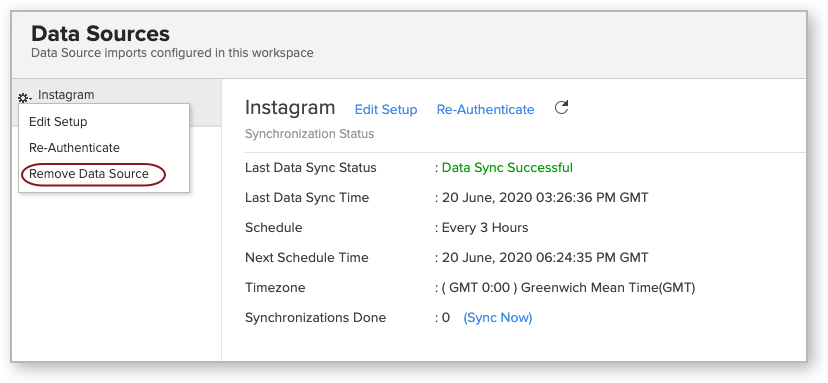
- The data synchronization from LinkedIn Pages into this Workspace will be removed. However, you'll still be able to access this workspace with existing data.

Reporting Features
1. What modules and fields on LinkedIn Pages can I create reports on?
Zoho Analytics will synchronize a set of modules and fields from LinkedIn Pages, over which you can create reports. To get the detailed list of Fields and Modules, refer to this question.
2. How do I create my own reports with this connector?
3. Can I create reports using the columns from different modules?
Yes, you can create reports using columns from different tables. Each LinkedIn Pages module is a table in Zoho Analytics. And all these tables are linked to each other by default. You can create reports by simply dragging and dropping the required columns into the reports designer.
4. What are the report types supported by Zoho Analytics?
Zoho Analytics supports a wide variety of reports.
- Charts
- Pie
- Bubble
- Packed Bubble
- Bubble Pie
- Bar
- Stacked Bar
- Histogram
- Butterfly
- Line
- Smooth Line
- Scatter
- Combination
- Geo Map Chart
- Area
- Stacked Area
- Web
- Funnel
- Doughnut
- Word Cloud
- Table View
- Pivot tables (Matrix Views)
- Summary view
- Tabular view
- KPI Widgets
- Single Numeric Widget
- Dial Chart Widget
- Bullet Chart Widget
- Dashboards (multiple reports arranged on the same page)
5. What are the default reports & dashboards created by Zoho Analytics, upon setting up this connector?
When you setup/configure the LinkedIn Pages Connector, 45+ default reports and dashboards are automatically created. These hand-picked reports will be useful in analyzing your help data effectively.
6. What is Ask Zia? How can I create reports using Zia?
Zia is Zoho's Intelligent Assistant. Ask Zia understands your questions asked in plain English and gets you powerful insights as answers in the form of attractive and relevant visualizations.
You can simply Ask Zia questions and it will interpret these questions, fetches data from the relevant tables, and generates the most appropriate reports immediately.
7. What are Formulas in Zoho Analytics?
Formulas, as the name indicates, are calculations that help you derive key business metrics that can be used for reporting and analysis. Zoho Analytics provides a powerful formula engine to create any type of calculations required, to enable creating any required reports. Refer to Adding Formulas in Zoho Analytics to learn more.
8. What are the default formulas that get added by Zoho Analytics upon setting up this connector?
The default formulas added by Zoho Analytics are listed below. You can view these formulas by opening the corresponding table and selecting Add > Edit Formulas from the toolbar.
The following are the default formulas in the Follower Counts By Country table.
| Formula Name | Formula Type | Formula | Description |
| Total Followers | Formula Column | "Organic Follower Count"+"Paid Follower Count" | This formula calculates the total number of followers by country. |
The following are the default formulas in the Follower Counts By Date table.
| Formula Name | Formula Type | Formula | Description |
| Total Followers | Formula Column | "Organic Follower Count"+"Paid Follower Count" | This formula calculates the total number of followers by Date. |
The following are the default formulas in the Follower Counts By Function table.
| Formula Name | Formula Type | Formula | Description |
| Total Followers | Formula Column | "Organic Follower Count"+"Paid Follower Count" | This formula calculates the total number of followers by Function. |
The following are the default formulas in the Follower Counts By Industries table.
| Formula Name | Formula Type | Formula | Description |
| Total Followers | Formula Column | "Organic Follower Count"+"Paid Follower Count" | This formula calculates the total number of followers by Industry. |
The following are the default formulas in the Follower Counts By Region table.
| Formula Name | Formula Type | Formula | Description |
| Total Followers | Formula Column | "Organic Follower Count"+"Paid Follower Count" | This formula calculates the total number of followers by region. |
The following are the default formulas in the Follower Counts By Seniority table.
| Formula Name | Formula Type | Formula | Description |
| Total Followers | Formula Column | "Organic Follower Count"+"Paid Follower Count" | This formula calculates the total number of followers by Seniority. |
The following are the default formulas in the Follower Counts By Staff Count Range table.
| Formula Name | Formula Type | Formula | Description |
| Total Followers | Formula Column | "Organic Follower Count"+"Paid Follower Count" | This formula calculates the total number of followers by staff count. |
| Company Size (Employees) | Formula Column | if("Staff Count Range Name"='SIZE_1','1', if("Staff Count Range Name"='SIZE_2_TO_10','2 to 10',i f("Staff Count Range Name"='SIZE_11_TO_50','11 to 50', if("Staff Count Range Name"='SIZE_51_TO_200','51 to 200',i f("Staff Count Range Name"='SIZE_201_TO_500','201 to 500', if("Staff Count Range Name"='SIZE_501_TO_1000','501 to 1000', if("Staff Count Range Name"='SIZE_1001_TO_5000','1001 to 5,000', if("Staff Count Range Name"='SIZE_5001_TO_10000','5,001 to 10,000', if("Staff Count Range Name"='SIZE_10001_OR_MORE','More than 10,000','Others'))))))))) | This formula returns the staff count range. |
The following are the default formulas in the Page Statistics By Staff Count Range table.
| Formula Name | Formula Type | Formula | Description |
| Company Size (Employees) | Formula Column | if("Page Statistics By Staff Count Range"='SIZE_1','1', if("Page Statistics By Staff Count Range"='SIZE_2_TO_10','2 to 10', if("Page Statistics By Staff Count Range"='SIZE_11_TO_50','11 to 50', if("Page Statistics By Staff Count Range"='SIZE_51_TO_200','51 to 200', if("Page Statistics By Staff Count Range"='SIZE_201_TO_500','201 to 500', if("Page Statistics By Staff Count Range"='SIZE_501_TO_1000','501 to 1000', if("Page Statistics By Staff Count Range"='SIZE_1001_TO_5000','1001 to 5,000', if("Page Statistics By Staff Count Range"='SIZE_5001_TO_10000','5,001 to 10,000', if("Page Statistics By Staff Count Range"='SIZE_10001_OR_MORE','More than 10,000','Others'))))))))) | This formula returns the staff count range. |
The following are the default formulas in the Post Insights table.
| Formula Name | Formula Type | Formula | Description |
| Engagement Rate | Aggregate Formula | (Sum("Post Insights"."Click Count")+Sum("Post Insights"."Like Count")+ Sum("Post Insights"."Comment Count")+Sum("Post Insights"."Share Count"))/Sum("Post Insights"."Impression Count") | This calculates the engagement rate. |
| CTR | Aggregate Formula | (Sum("Post Insights"."Click Count")/Sum("Post Insights"."Impression Count"))*100 | This calculates the click-through rate. |
The following are the default formulas in the Share Statistics By Date table.
| Formula Name | Formula Type | Formula | Description |
| Engagement Rate | Aggregate Formula | (Sum("Share Statistics By Date"."Click Count")+Sum("Share Statistics By Date"."Like Count")+ Sum("Share Statistics By Date"."Comment Count")+Sum("Share Statistics By Date"."Share Count"))/Sum("Share Statistics By Date"."Impression Count") | This calculates the engagement rate. |
| CTR | Aggregate Formula | (Sum("Share Statistics By Date"."Click Count")/Sum("Share Statistics By Date"."Impression Count"))*100 | This calculates the click-through rate. |
9. How do I create my own custom formulas in Zoho Analytics?
To learn how to create your own formulas, refer to Adding Formulas on Zoho Analytics help page.
10. Can I combine data from other sources with the data from LinkedIn Pages to create reports and dashboards?
Yes, you can combine data from other sources with your LinkedIn Pages data for analysis.
To do this, you need to add/import a new data table into the LinkedIn Pages Advanced Analytics Workspace as explained in the previous question, and then define a look-up to join it with the table from LinkedIn Pages.
To define a lookup relationship between two tables, it is essential that the tables have at least one column which is common between them. Follow the below steps to look up a column from LinkedIn Pages along with the data from any other source.
- Open the corresponding table, right-click the column header and select Change to Lookup Column.
- In the Change to Lookup Column dialog that opens, select the column to look up.
- Click OK.
Click here to learn more.
11. Can I join data from multiple tables to create reports?
Yes, you can join data from multiple tables to create reports. Refer to Joining Tables in Zoho Analytics for detailed help on this.
12. What are Query Tables?
Zoho Analytics allows you to derive required data by writing standard SQL SELECT Queries. This feature is called Query Tables. With Query Tables, you can also combine data from different tables and create reports from them. View this video demo to learn about how to create Query Tables in Zoho Analytics.
Cross-Functional Analytics with Popular Business Applications
1. What are the popular business applications that I can integrate this connector with?
You can integrate and perform cross-functional analytics with most business applications that Zoho Analytics integrates with. Refer here to see the list of Business Analytics supported in Zoho Analytics.
2. How can I analyze the data from other business applications along with LinkedIn Pages Advanced Analytics?
To import data from business apps:
- Open the Workspace in which you have set up the connector.
- Click the Import Data button.
- In the Create New Table tab that opens, select the application that you wish to import.
- Provide the necessary authentications.
- Select the necessary modules and fields. Select the schedule import option.
- Click Create. Data from the selected application will be imported as a different set of tables in the LinkedIn Pages Advanced Analytics workspace.
3. Will a lookup relationship between the related modules from LinkedIn Pages and other third-party applications be created automatically?
A lookup relationship will not be created automatically between the LinkedIn Pages modules and the modules of the application that you're trying to import. You'll have to manually link the tables using a lookup relationship.
To manually create a lookup relationship refer to the Join Tables section.
Users, Sharing, & Collaboration
1. How do I share the reports in Zoho Analytics with my colleagues?
You can easily share the reports that you create with other users. Refer to the Sharing and Collaboration help page for more details on this.
Once you privately share a report with your colleagues they will be able to access the reports as you do. Refer here to learn how to access reports.
2. What are the user roles available in Zoho Analytics?
Zoho Analytics offers four user roles—Account Administrator, Organization Administrators, Workspace Administrators, and User. Learn about the Zoho Analytics Organization Model and User Roles.
3. Why can't other users edit the reports that I've shared with them?
This is the expected behavior. Only when the shared users are set as a Workspace Administrators, they will be able to edit the reports.
If a normal user wants to edit the report, he/she will have to save the report with a new name using the Save As option toolbar. The User can then edit this report. To learn more about user roles click here.
4. Can I share the same report, to multiple users with different criteria associated, so that they see different data?
Yes, you can. Refer to the topic Apply filter criteria.
5. Can I export a report/dashboard?
Yes, you can export the report/dashboard in various file formats such as CSV, EXCEL, PDF, HTML, and as an Image. Click to Learn more.
6. Can I print the reports & dashboards created in Zoho Analytics?
In order to print the report/dashboard, you first need to export it. You can export the report in various file formats such as CSV, EXCEL, PDF, HTML, and Image. Click to know more.
7. Can I email reports & dashboards created in Zoho Analytics in a scheduled manner?
If you are the Administrator in Zoho Analytics or a 'Workspace Administrator', you can schedule reports and dashboards to be emailed automatically. Refer to the email schedule section in this help documentation.
8. Can I embed/create a permalink for reports & dashboards created in Zoho Analytics?
Yes, you can embed/create a permalink for reports and dashboards. You can also create a slideshow of views. Refer to the Publishing Options section to learn how to do this.
9. Can I create Slideshow in Zoho Analytics?
Yes, you can create Slideshows. You can also embed slideshow. Refer to the Creating Slideshow section to learn how to do this.
Solutions
1. Does Zoho Analytics offer Embedded Analytics or rebranding?
Yes, Zoho Analytics supports various rebranding options such as Portal rebranding/white labeling and Logo Rebranding.
Help & Support
1. How do I get technical support on Zoho Analytics?
We offer 24x5 technical support (Monday to Friday). In case you need our assistance, email us your questions to support@zohoanalytics.com.
You can also reach out to us on our toll-free numbers -
United States: +1-888-900-9646
United Kingdom: +44-20-35647890
Australia: +61-2-80662898
India: 044 - 69656060
2. Can I have someone from Zoho do a demo for me?
Yes, certainly. Register for a demo on this page!