Zoho Finance Advanced Analytics
Zoho Analytics for Zoho Finance apps empowers you with financial analytical capabilities for your Zoho Finance data (Zoho Books, Zoho Invoice, Zoho Billing, Zoho Inventory, Zoho Expense and Zoho Commerce). You can analyze and keep track of your key financial metrics. With this connector you can create insightful reports & dashboards over your Zoho Finance data for in-depth financial analysis.
The Advanced Analytics for Zoho Finance includes 150+ prebuilt reports and dashboards over your Zoho Finance activity data.
 |  |  |
 |  |  |
General
- What is Zoho Analytics?
- Why Zoho Finance Advanced Analytics connector?
- Who can subscribe to the Zoho Analytics connector?
- What do I get when I subscribe for this connector?
- How does the Zoho Analytics connector for Zoho Finance work?
- What are the benefits of using the Zoho Finance Advanced Analytics Connector over the inbuilt Reporting module in Zoho Finance apps?
Pricing & Trial
- How much does this connector cost?
- Do you provide trial evaluation for this connector?
- What do you mean by 'Users' in the (connector) pricing plan?
- What do you mean by 'Rows/Records' and how is it calculated in the pricing plan?
Setup
- How do I set up the Connector for my Zoho Finance account?
- How long should I wait for my organization data in Zoho Finance apps to initially appear in Zoho Analytics?
- Can I import data from multiple Zoho Finance organizations into Zoho Analytics?
- What are the modules in the Zoho Finance apps on which I could create reports using this connector?
- What is the role of a base organization in a multiple Zoho Finance organization setup?
- While importing data from multiple Zoho Finance organizations, how to find the corresponding Zoho Finance organization of a data in Zoho Analytics?
- I got this email which said 'Setup Process Failed'/'Synchronization Process Failed'. What should I do?
- Can I import custom fields from Zoho Finance?
- Can I import custom fields, reporting tags, and data using different base currencies while importing from multiple Zoho Finance organizations?
- How frequently can I synchronize my data with Zoho Analytics?
- Can I edit the Zoho Finance connector Synchronization setting?
- Can I view the data synced history?
- Can I synchronize my Zoho Finance organization data instantly?
- Can I set up the Zoho Finance apps connector into my Zoho CRM Advanced Analytics workspace?
- Can I add/modify data in the Zoho Finance organization data tables (modules) from within Zoho Analytics?
- Can I add new columns to the Zoho Finance organization data tables (modules) from within Zoho Analytics?
- Can I add new data tables in this Workspace to create reports & dashboards?
- On whose account will the connector be set up?
- Can I transfer my Zoho Finance apps connector to another admin account?
- Can I set up the Connector in an account other than the one who configures/sets up the trial?
- How can I remove the Integration?
Reporting Features
- In which modules of Zoho Finance can I create reports?
- How to create consolidated reports from multiple Zoho Finance organizations in Zoho Analytics?
- How do I create my own reports with this connector?
- Can I create reports using the columns from different modules?
- What are the report types supported by Zoho Analytics?
- What are the default reports & dashboards created by Zoho Analytics, on setting up this connector?
- What are Formulas in Zoho Analytics?
- What are the default formulas added by Zoho Analytics, on setting up this connector?
- How do I create my own custom formulas in Zoho Analytics?
- Can I join data from multiple tables to create reports?
- What are Query Tables?
Users, Sharing & Collaboration
- How do I share the reports in Zoho Analytics with my colleagues?
- Why are other members in my organization not able to access the reports created?
- How can other members in my organization create reports?
- What are the user roles available in Zoho Analytics?
- Why can't other users edit the reports that I have shared to them?
- Can I share the same report created to multiple users with different criteria associated, so that they see different data?
- Can I export a report/dashboard?
- How can I print the reports & dashboards created in Zoho Analytics?
- How can I email reports & dashboards created in Zoho Analytics in a scheduled manner?
- How do I embed my reports in my intranet, blog or presentation?
Cross-Functional Analytics with Zoho Applications
- What are the Zoho applications that I can combine with Zoho Finance for cross-functional analytics?
- How can I analyze the data from other Zoho apps along with Zoho Finance?
- Will the related modules from Zoho Finance and other Zoho applications be automatically created for Zoho Analytics?
- How do I integrate Zoho Finance apps and Zoho CRM?
- Can I integrate multiple Zoho Finance organizations with Zoho CRM in Zoho Analytics?
Cross-Functional Analytics with Popular Third-Party Business Applications
- What are the popular business applications that I can integrate Zoho Finance with?
- How can I analyze the data from the third-party business applications along with Zoho Finance?
- Will a relationship (lookup) be created between Zoho Finance and the third party applications that I integrate Zoho Finance with?
Help & Support
- How do I get technical support on Zoho Analytics connector?
- Can I have someone from Zoho do a Demo of this connector for me?
Solutions
- Balance Sheet - Multiple Organization Setup with Same Base Currency.
- Balance Sheet - Organization with a branch in different countries with different base currencies.
- Balance Sheet - Multiple orgs, multiple countries with different base currencies.
- Other Solutions
General
1. What is Zoho Analytics?
Zoho Analytics is a self-service BI and data analytics software that lets you analyze your data, create stunning data visualizations, and discover hidden insights in minutes.
It offers the following important capabilities:
- Complete Online Business Intelligence and analytics service, accessible anytime, anywhere!
- Easy to adopt 'spreadsheet-like' interface with powerful drag & drop based reporting features for quick report creation.
- Visual Analysis capability for in-depth analysis and to slice & dice your data
- Supports a wide range of reporting capabilities like Dashboards, Charts, Pivot Tables, Summary Views and simple Tabular Views .
- Supports creation of KPI widgets in dashboards to analyze the performance.
- Supports data import from variety of file formats like Excel, JSON, HTML etc. Also supports data import from cloud storage and Web URLs. Supports periodic scheduling of imported data.
- Integrated with Zoho Finance apps (Zoho Books, Zoho Invoice, Zoho Billing, Zoho Inventory, Zoho Expense and Zoho Commerce) to empower your organization data with the powerful reporting capabilities of Zoho Analytics.
- Integrated with a suite of Zoho products such as Zoho CRM, Zoho Desk, Zoho Projects, Zoho BugTracker, etc.
- Integrated with popular business applications like Google Analytics, Salesforce CRM, etc.
- You can also integrate your own applications with Zoho Analytics using Zoho Analytics API.
- Integrated with Zapier to power up import from over 500+ apps.
- Integrated with Zoho Flow to power up import from over 300+ apps.
- Blend & merge data from across different sources to create meaningful business reports
- With an advanced formula engine, you can derive key business metrics from your data.
- Supports SQL (Structured Query Language) driven querying for powerful report creation.
- Real-time collaboration by sharing data and reports with your colleagues & friends, in either read or read-write modes.
- Export and Print reports in a variety of formats. Notify reports via email.
- Publish reports for wider consumption. Embed reports within your websites, web applications, and blogs.
- Highly secure through user login with support for HTTPS (SSL connection). All your data and reports are hosted in highly secure data centers. (Refer Security and Privacy)
- Supports Logo Rebranding.
2. Why Zoho Finance Advanced Analytics connector?
Zoho Finance Advanced Analytics Connector enables you to import the organization data in your Zoho Finance apps (Zoho Books, Zoho Invoice, Zoho Billing, Zoho Inventory, Zoho Expense and Zoho Commerce) into Zoho Analytics for advanced reporting and analysis. This connector brings in all the capabilities of Zoho Analytics described in the previous question to Zoho Finance users.
- A full-featured business intelligence (BI) and reporting tool that can slice & dice the Zoho Finance apps data to create any report/dashboard you require.
- Over 150+ handpicked reports/dashboards that anyone using Zoho Finance apps will find great value in.
- Create your own reports and dashboards not only based on your Zoho Finance apps but also by blending data from other data sources.
- Share reports and dashboards with your colleagues.
- Schedule and email your reports whenever you want.
- Export your reports as PDF, HTML, Excel, CSV, and image files.
- Embed your reports in websites, blogs, etc.
3. Who can subscribe to the Zoho Analytics connector?
Users with paid accounts of Zoho Finance apps and Zoho Analytics (any paid plan) can avail this connector.
4. What do I get when I subscribe for this connector?
As a Zoho Finance users, subscribing to this connector brings you immense benefits. You get to look at your data in Zoho Finance apps in ways you haven't looked at before. Using this Zoho Analytics connector enables you to do powerful analysis of your organization data and create insightful reports & dashboards. You can create reports like Debt to Assets ratio by month, EBIT margin for the last 12 months, Top 10 products by invoice and much more with ease.
Zoho Analytics drag-and-drop based reporting is so easy to use that you could create any report or dashboard on your Zoho Finance data with no IT help or technical knowledge and share them to your colleagues.
5. How does the Zoho Analytics connector for Zoho Finance work?
The Zoho Analytics Advanced Analytics Connector for Zoho Finance works as below.
- A Zoho Finance administrator chooses to configure the Zoho Analytics connector in their Zoho Finance account.
- They select modules and fields from their Zoho Finance account to be analyzed.
- The data from their Zoho Finance account will be imported into their corresponding Workspace in Zoho Analytics account automatically. Depending on the amount of data in the Zoho Finance account, the initial import can take a few minutes to a few hours.
- Then on, the data will be continuously synched between Zoho Finance & Zoho Analytics, at regular time intervals that the administrator had configured to sync their data.
- Along with the data from the default modules a set of insightful reports and dashboards are provided by default.
- The Zoho Finance administrator who set up the connector can share the reports with other users.
- New adhoc reports can be created by the users of the connector.
Refer to this section to know more about how to set up the Zoho Analytics connector.
6. What are the benefits of using the Zoho Finance Advanced Analytics Connector over the inbuilt Reporting module in Zoho Finance apps?
The advantage of using the Zoho Finance Advanced Analytics add-on over the reports tab inside Zoho Finance apps is tabulated below.
| Reporting Module | Zoho Finance Advanced Analytics |
| Users will not be able to create new reports, but access basic reports such as balance sheet, profit and loss, etc. | It offers over 25+ chart types along with pivot, summary, and tabular views. Users can create any type of report to suit their needs. |
| Cannot create dashboards. | Users can create dashboards to view all the reports in a single page layout. |
| Cannot create KPI Widgets. | Allows creation of KPI widgets to track and monitor the key performance metrics. Supports 6 types of single number widgets and 2 types of chart type widgets. |
| Cannot combine data to create reports. | All the modules from an Organization will be joined by default using lookup columns. Users can create reports using the columns across any number of modules. |
| Cannot combine and analyze data from different sources. | Can combine data from any resources for advanced reporting and analysis. |
| Cannot create reports combining data from Zoho CRM etc. | A lookup relationship between the modules of Zoho CRM and the modules of Zoho Finance will be created automatically. |
| The reports that you create cannot be shared. | You can share the reports and dashboards that you create to any user. All that the user has to do is sign in to Zoho Analytics to view the report. |
| Does not allow the users to embed the reports that they create. | Users can embed the reports that they create in a website or blog. |
| Does not offer formula engine. | Offers a powerful formula engine. |
| Limited customizations. | Offers a wide range of customizations. |
Pricing & Trial
1. How much does this connector cost?
The Zoho Finance Advanced Analytics connector is available in all the paid plans of Zoho Analytics.The Zoho Analytics paid plans start at per month. Refer to the Zoho Analytics pricing page.
Zoho Analytics allows you to perform combined analysis of data from multiple organizations through a single import for the following users:
- Premium Plan - 25 Organizations
- Enterprise Plan - 100 Organizations
- Zoho One Subscribers - 25 Organizations
- Zoho CRM Plus - 25 Organizations
- Zoho CRM Ultimate - 25 Organizations
- Zoho Books Ultimate - 25 Organizations
- Zoho Creator Ultimate - 25 Organizations
- Zoho Inventory Ultimate - 25 Organizations
2. Do you provide trial evaluation for this connector?
Yes, we do provide a 15-day free trial for this connector from the date of setup.
3. What do you mean by 'Users' in the (connector) pricing plan?
Anyone to whom you privately share your workspaces, tables (data), reports and dashboards, created in Zoho Analytics, for collaboration is considered a "User" in Zoho Analytics. A user is identified by his/her unique email address, with which their Zoho Analytics account was created/registered.
Suppose you subscribe to the Zoho Analytics Standard plan, you can privately share the data/reports in your account and collaborate with 4 other people. Now your Zoho Analytics account is said to have 5 users (including yourself). Click to know more about the Zoho Analytics user model.
4. What do you mean by 'Rows/Records' and how is it calculated in the pricing plan?
In Zoho Analytics, a row or record is defined in the same context as in a Workspace (or spreadsheet). In simple terms, a table consists of rows (records) and columns (fields). Each row in a table represents a set of related data and has the same structure. For example, in a table that represents "Invoices", each row would represent a single invoice record. The number of rows calculated for pricing is the sum of all rows/records stored across all your Workspace tables in your Zoho Analytics account.
Setup
1. How do I set up the Connector for my Zoho Finance account?
You can set up the Zoho Analytics connector either from Zoho Finance apps or from Zoho Analytics.
From Zoho Analytics Interface
The below presentation shows you how to set up the connector from Zoho Analytics interface.
From Zoho Finance apps Interface
The below presentation shows you how to set up the connector from Zoho Books interface. You can similarly set up the connector from Zoho Invoice, Zoho Billing, or Zoho Inventory as well.
Shown below is a video on how to import a Zoho Books organization.
For more information refer:
2. How long should I wait for my organization data in Zoho Finance apps to initially appear in Zoho Analytics?
Initial data import will take from a few minutes to a couple of hours depending on the volume of the data. You will receive an email notification once the import is complete. If you access the workspace before the initial fetch, it will not display any data.
3. Can I import data from multiple Zoho Finance organizations into Zoho Analytics?
Yes, you can import data from multiple Zoho Finance organizations into Zoho Analytics using the Import Multiple Organizations Data option. This can be done only if the base currency type is same for all your organizations. Say, your base organization follows INR currency type, all the other organizations following the INR currency type can only be imported.
The users from the following plans can use Import From Multiple Organization option:
- Premium Plan - 25 Organizations
- Enterprise Plan - 100 Organizations
- Zoho One Subscribers - 25 Organizations
- Zoho CRM Plus - 25 Organizations
- Zoho CRM Ultimate - 25 Organizations
- Zoho Books Ultimate - 25 Organizations
- Zoho Creator Ultimate - 25 Organizations
- Zoho Inventory Ultimate - 25 Organizations
4. What are the modules in the Zoho Finance apps on which I could create reports using this connector?
Data from the following default modules in Zoho Finance will get synchronized with Zoho Analytics. If you have created custom modules in Zoho Finance, then the data from those modules can also be imported.
| Business Application | Modules |
| Zoho Books Modules | Accounts, Accrual Transactions, Bills, Bill Item, Bill Of Entry, Bill Of Entry Item, Budget, Budget Details, Cash Transactions, Credit Notes, Credit Note Items, Credit Notes Refund, Customers, Customer Contact Person Customer Payments, Delivery Challan, Delivery Challan Item, Estimates, Estimate Items, Invoices, Invoice Items, Items, Inventory Mapping, Inventory Adjustments, Inventory Adjustment Items, Landed Cost, Landed Cost Allocation, Manual Journals, Manual Journal Items, Payment Refunds, Price Lists, Price List Item, Projects, Purchase Receive, Purchase Receive Items, Purchase Orders, Purchase Order Items, Recurring Bills Recurring Bill Items, Retainer Invoices, Sales Orders, Sales Order Items, Sales Receipt, Sales Receipt Item Shipping Bill, Shipping Bill Item, System Mails, SMS Notifications, Tasks, Taxes, Timesheets, Vendor Addresses Vendors, Vendor Contact Persons, Vendor Payments,Vendor Payment Refund, Vendor Credits, Vendor Credit Items, Vendor Credit Refunds, User Details |
| Zoho Invoice | Customers, Customer Contact Person, Credit Notes, Credit Note Items, Credit Notes Refund, Customer Payments, Delivery Challan, Delivery Challan Item, Estimates, Estimate Items, Expenses, Expense Item Invoices, Invoice Items, Items, Payment Refunds, Projects, Project Users, Recurring Expenses, Recurring Invoice, Recurring Invoice Items, Sales Persons,Taxes, Timesheets, Tasks, Users |
| Zoho Inventory | Accounts, Accrual Transactions, Attribute, Attribute Options, Bank Statements, Bills, Bill Item, Brand Cash Transactions, Category, Credit Notes, Credit Note Items, Credit Notes Refund, Customers Customer Contact Person, Customer Payments, Delivery Challan, Delivery Challan Item, Estimates Estimate Items, Expenses, Expense Item, Invoices, Invoice Items, Inventory Mapping, Inventory Adjustments Inventory Adjustment Items, Items, Item Group, Manual Journals, Manual Journal Items, Manufacturer Packages, Package Items, Payment Refunds, Projects, Project Users, Price Lists, Price List Item Purchase Orders, Purchase Order Items, Purchase Receive, Purchase Receive Items, Recurring Bills Recurring Bill Items, Recurring Invoice, Recurring Invoice Items, Recurring Expenses, Retainer Invoices Reporting Tags, Sales Orders, Sales Order Items, Sales Persons, Sales Return, Sales Return Items, Sales Return Receive, Sales Return Receive Items, Shipment Order, Taxes, Tasks, Timesheets, Transfer Order Transfer Order Items, Users, Vendors, Vendor Contact Persons, Vendor Addresses, Vendor Payments, Vendor Payment Refund, Vendor Credits, Vendor Credit Items, Vendor Credit Refunds, Warehouses |
| Zoho Expense | Customers, Customer Contact Person, Taxes, Projects, Users, Project Users, Accounts, Reporting Tags, Accrual Transactions, Bank Statements, Expense Claim, Expense Claim Item, Expense Comments, Expense Tax, Expense Category, Expense Type, Expense Type Details, Report Type, Report Type Details, Merchant, Policies,Policy Rules, Vehicles, Mileage, Attendees, Expense Attendees, Trip Attendees, Trips, Trip Itenary, Trip Comments, Policy Logs, Department, Reports, Shared Reports,Shared Trips, Approval ReportsApproval Report Details, Approval Trips, Approval Trip Details, Approval History, Shared Advances, Approval Advances, Approval Advance Details, Employee Reimbursements, Employee Reimbursement Refund, Employee Advance Payments |
| Zoho Commerce | Cart, Cart Item, Product Tag Mapping, Product Tags, Shipping Rate, Shipping Rate Value, Shipping Zone Traffic Session, Traffic Users, Zone Address |
Note: When you import data from multiple Zoho Finance organizations using the Import Multiple Organizations Data option, you will have an additional "Organization" module along with the above-mentioned modules.
5. What is the role of a base organization in a multiple Zoho Finance organization setup?
The base organization serves as the reference organization while importing data from multiple organizations.
The following are a few points to be considered while specifying your base organization:
- Modules and fields will be unified across all organizations based on your base organization. Say your base organization has 3 modules with 5 fields, only those 3 modules and 5 fields that map to your base organization will be imported from other organizations.
- Data formats such as time zones and date formats of date columns will be unified across all organizations based on your base organization. Say, your base organization follows dd/mm/yyyy date format, the date format in all the other organizations will also be converted to dd/mm/yyyy format.
- Reporting tags will not be imported from both base and other organizations.
- Custom fields across all organizations being imported should exactly match the name and data type of the base organization.
6. While importing data from multiple Zoho Finance organizations, how to find the corresponding Zoho Finance organization of the data in Zoho Analytics?
The Organization ID column available in the imported tables will help identify the organization from which the data is being imported. The Organization table will contain the Organization Names associated with the Organization ID.
7. I got this email which said 'Setup Process Failed'/'Synchronization Process Failed'. What should I do?
The import/sync process of your organization data from the Zoho Finance app can fail sometimes, due to a variety of reasons. Hence you may receive such mails occasionally. The Zoho Analytics team will look into it immediately and get back to you, after taking the required corrective action.
Case 1: You will receive the Setup Process Failed mail when there is a failure during the initial fetch. In this case we request you to:
- Open the corresponding Zoho Finance Advanced Analytics Workspace.
- Click Data Sources on the left panel. All the data sources of the workspace will be listed.
- Open the corresponding organization and click the Retry Now link.
If the issue persists please do write to support@zohoanalytics.com. We will look into it and get back to you immediately.
Case 2: You will receive the Synchronization Failed mail if there is any failure during the data synchronization process between Zoho Finance and Zoho Analytics, after the initial setup & import of data. This might be a momentary failure due to any internal issues. This import schedule will get suspended if there are five successive failures.
8. Can I import custom fields from Zoho Finance?
Yes, you can import custom fields from Zoho Finance. You can add the custom fields by selecting the fields either while setting up the connector or by using the Edit Setup option.
9. Can I import custom modules, reporting tags, and data using different base currencies while importing from multiple Zoho Finance organizations?
This option is not directly supported while importing data using the Import Multiple Organizations Data option. However, you can individually configure different organizations one-by-one, using the Import Single Organization Data option, into the same workspace.
In this case, the table names of the same modules from different organizations will be as given below. Say, you are importing Accounts modules from multiple Zoho Finance organizations, then your table names will be,
- First organization - Accounts
- Second organization - Accounts Zoho Finance
- From third organization onwards - Accounts (Organization Name)
After importing the required data, join the related tables using a look-up column relationship or query. You can then create reports and dashboards over this data. Read more about setting up Zoho Finance organizations.
10. How frequently can I synchronize my data with Zoho Analytics?
Zoho Analytics offers flexible sync schedules to ensure that your data is always up-to-date for effective analysis. These schedules allow you to automate the process of updating your data, ensuring that your analyses are based on the latest information.
- 1 Hour (Enterprise plan only)
- 3 Hours (Standard plan and above)
- 6 Hours (Standard plan and above)
- 12 Hours (Standard plan and above)
- Every day (Basic plan and above)
11. Can I edit the Zoho Finance connector Synchronization setting?
Yes, you can edit the synchronization setting if you are the administrator of the Zoho Analytics account.
From Zoho Finance
Log into one of your Zoho Finance app account and open the organization that you wish to edit. Here we are going to edit the Zoho Books organization. The steps to edit your Zoho Invoice, Zoho Billing, or Zoho Inventory setup is same as shown below.
- Select Settings > Integrations > Zoho Apps.
- Click Show Details next to Zoho Analytics.
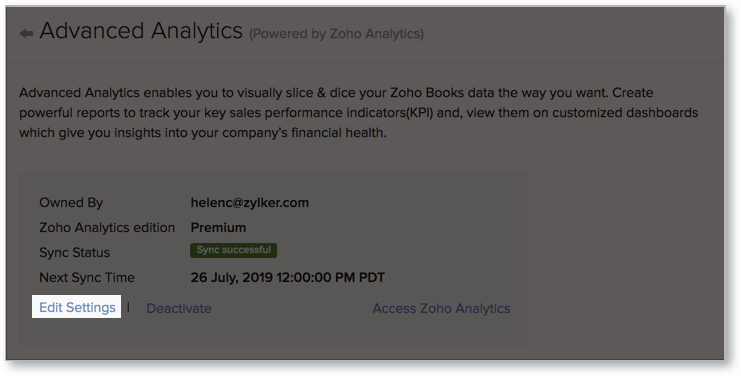
- In the Advanced Analytics page that opens, click the Edit Settings link.
- Make the necessary changes and click Save & Sync.
From Zoho Analytics
- Open the corresponding Zoho Finance Advanced Analytics workspace.
- Click Data Sources tab on the left panel. All the data sources of the workspace will be listed.
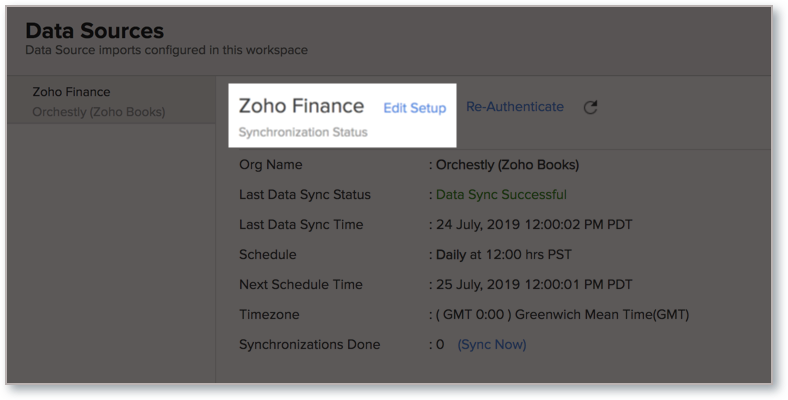
- Click open the required data source
Note: You will be directly navigated to the Data Sources page if connected to only one data source. - Click the Edit Setup link inline at the top.
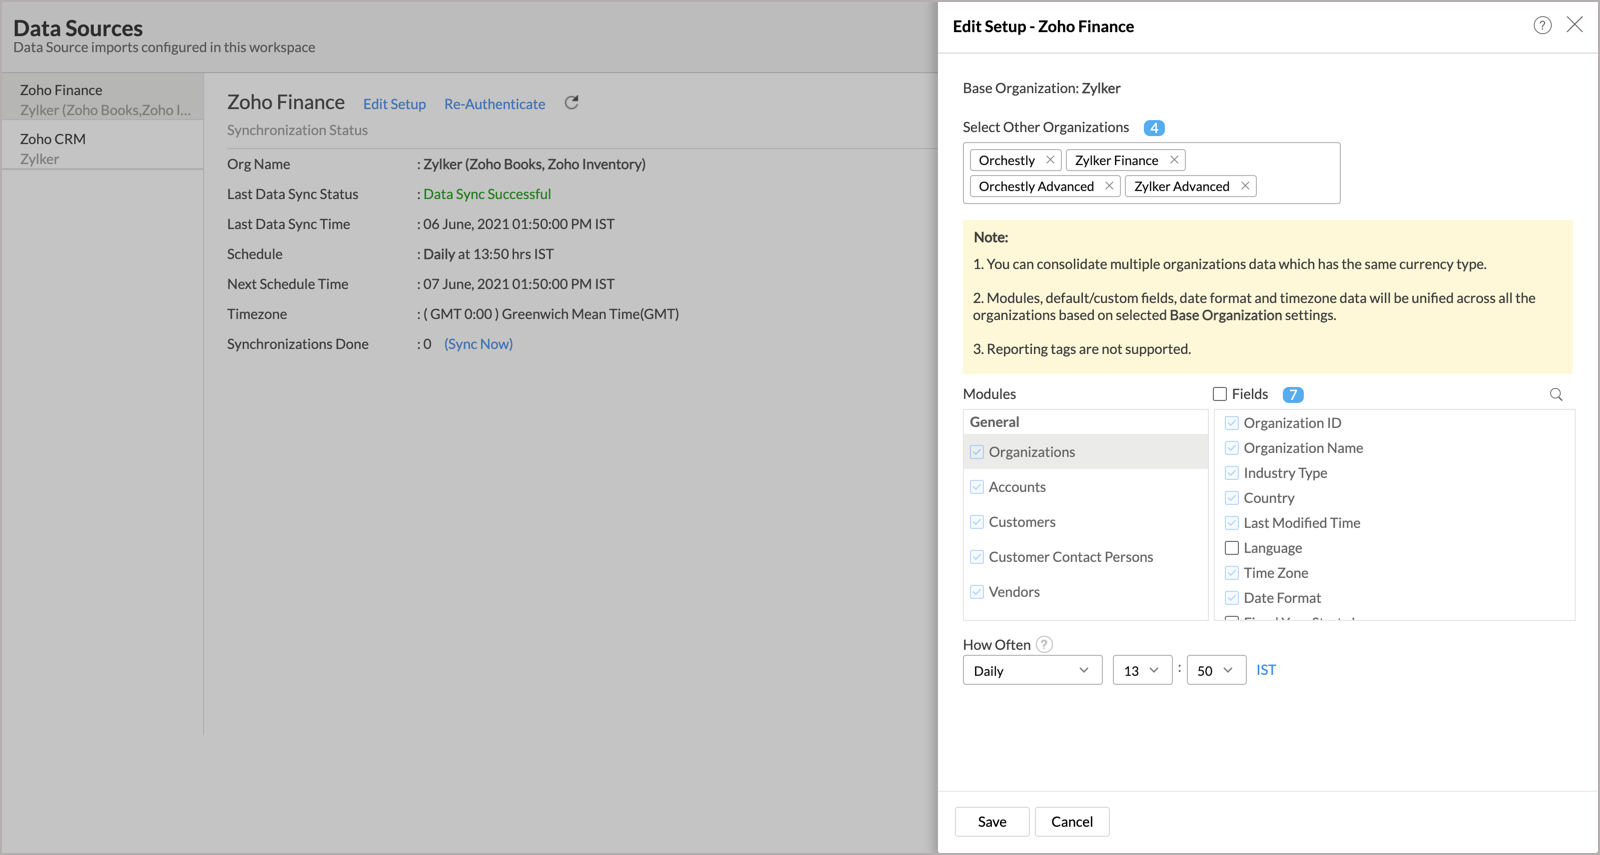
- In the Edit Setup - Zoho Finance page, make the required changes.
- After making the necessary changes, click Save.

While importing from multiple Zoho Finance organizations, you can edit the settings of the Base Organization. You can also choose to exclude/include other organizations from here.
12. Can I view the data synced history?
Yes, you can view the data synced history. Follow the below steps to view the data synced history.
- Open the corresponding Zoho Finance Analytics Workspace in Zoho Analytics.
- Click Data Sources on the left panel. All the data source of the workspace will be listed.
- Click Zoho Finance. The Data Sources page for Zoho Finance will open.
- In the Data Sources page that opens, click the Sync History link.
- A calendar with the sync history of the last 45 days will open. The date when the data sync has happened will be highlighted. Hover to view the number of times the data had got synced on a specific date.
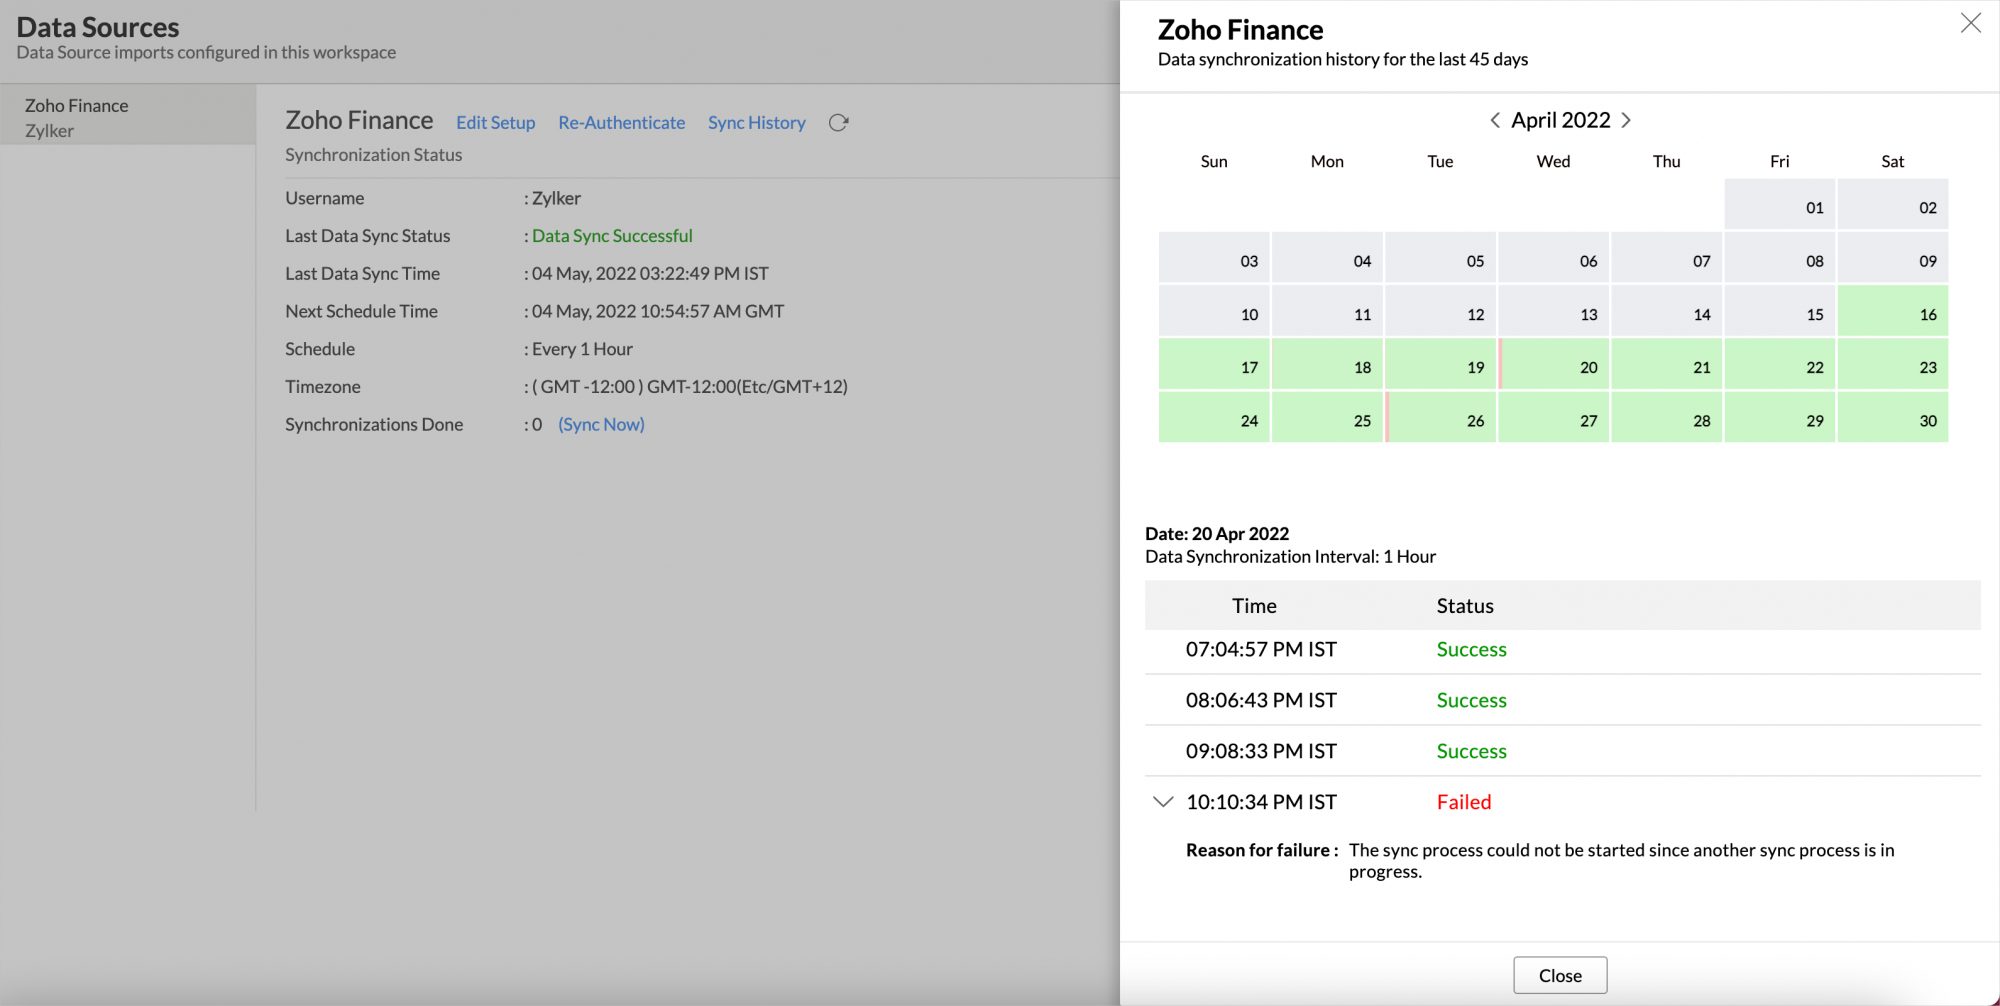
- Click the date to view more details.
- Time - Displays the time when the data is synced.
- Status - Shows whether the sync was a success or a failure.
In case of failure, the reason will be displayed. Refer to this page to learn how to resolve the issue and avoid further failure.

13. Can I synchronize my Zoho Finance organization data instantly?
Yes, you can synchronize your Zoho Finance organization data instantly when needed.
To synchronize your data instantly:
- Open Data Sources page of the corresponding Zoho Finance Advanced Analytics workspace.
- Click the Sync Now link available in the Synchronizations Done field.
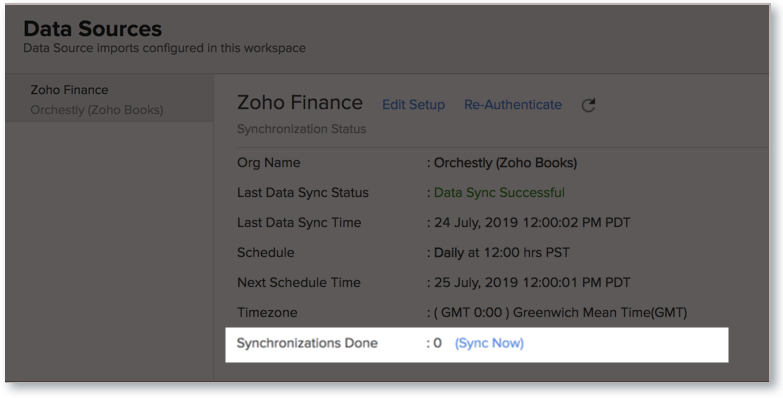
Zoho Finance organization data will get instantly synchronized.
14. Can I set up the Zoho Finance apps connector into my Zoho CRM Advanced Analytics workspace?
Yes, you can setup the connector in your Zoho CRM Advanced Analytics workspace to analyze data together. This will be of utmost use for those who have integrated Zoho Finance with Zoho CRM. For example, users can create reports like deals to invoice funnel, open invoices by amount and count etc using the data from Zoho Books and Zoho CRM. Refer Cross-Functional Analytics with Zoho Applications section to know more.
15. Can I add/modify data in the Zoho Finance organization data tables (modules) from within Zoho Analytics?
No, you cannot. Data from Zoho Finance organization gets automatically synched into Zoho Analytics. You cannot edit any of this data or add new data records in the synced tables from within Zoho Analytics.
16. Can I add new columns to the Zoho Finance organization data tables (modules) from within Zoho Analytics?
No, you cannot add new columns. But, you can add Formula Columns and Aggregate Formulas (i.e., calculated fields) to these tables to help you create powerful reports. Refer Adding Formulas in Zoho Analytics to know more.
17. Can I add new data tables in this Workspace to create reports & dashboards?
Yes, you can add new data tables. Click Create > New Table/Import Data to add a new table in the existing Zoho Finance Advanced Analytics Workspace.
With this feature, you can import data from other sources or add data manually into your Zoho Finance Advanced Analytics workspace to analyze and create reports. You can also import data from other business applications. With Zoho Analytics API you can integrate data from other applications.
Refer:
- How to Import data from files into Zoho Analytics
- How to Import data from feeds into Zoho Analytics
- How to Import Data from Cloud Storages
- How to Import data from local databases
- How to Import data from popular Business Applications
- How to Import data using Zoho Analytics API
18. On whose account will the connector be set up?
It will be setup in the corresponding Zoho Analytics account of the Zoho Finance app Administrator who configured this connector. Only one Zoho Analytics setup per organization is allowed.
19. Can I transfer my Zoho Finance apps connector to another admin account?
At present, we do not provide an option to do so in the user interface. If you require this transfer, please do mail us to support@zohoanalytics.com and we will do this for you.
20. Can I set up the Connector in an account other than the one who configures/sets up the trial?
Yes, you can do this. If the account on which the trial is configured is not upgraded after trial expiry, then the account will be downgraded to free plan and eventually the sync will also be deleted. In this case you will be able to set up the synchronization in the account only by purchasing the Connector.
21. How can I remove the Integration?
To remove the setup,
From Zoho Finance
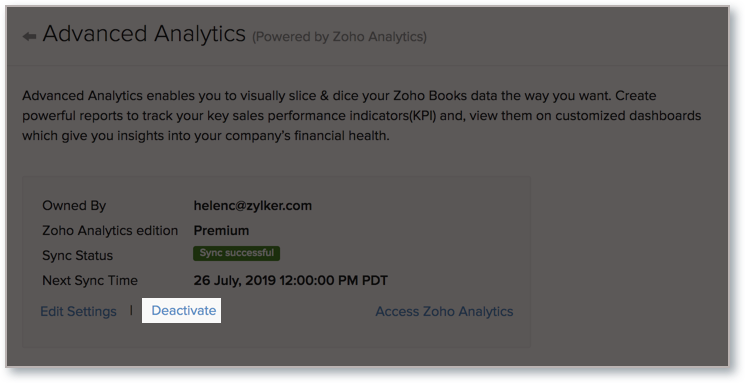
Log into your Zoho Finance account and open the organization that you wish to deactivate.
- Select Settings > Integrations > Zoho Apps.
- Click Show Details next to Zoho Analytics.
- In the Advanced Analytics page that opens, click the Deactivate link.
From Zoho Analytics
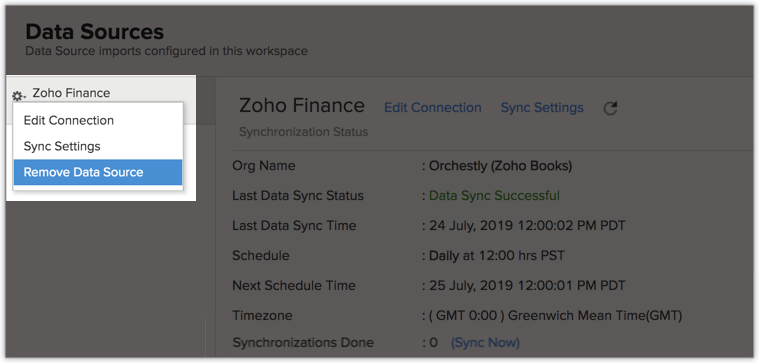
- Open the corresponding Zoho Finance Advanced Analytics workspace.
- Click Data Sources tab on the left panel. All the data sources of the workspace will be listed.
- Open Data Sources page of the corresponding workspace.
- Click the Settings icon next to the organization name that appear on mouse hover.
- Select Remove Data Source.
Reporting Features
1. In which modules of Zoho Finance can I create reports?
Zoho Analytics will synchronize the data specified in this question into the Zoho Finance Advanced Analytics workspace. You can create reports using this data.
2. How to create consolidated reports from multiple Zoho Finance organizations in Zoho Analytics?
You can configure multiple Zoho Finance organizations setup in Zoho Analytics and then create consolidated reports and dashboards from the same. The following methods explain how to import data from multiple Zoho Finance organizations:
Method 1: Organizations with same base currency
You can create consolidated reports from all your Zoho Finance organizations in Zoho Analytics using the Import Multiple Organization Data option. This option allows you to import data from multiple Zoho Finance organizations into a single workspace and combine the data together in the same data tables. This enables you to get consolidated insights from your financial metrics (balance report, P&L report, etc.,) or your non-financial metrics (sales across organization) across multiple organizations.
Say, a company offering dealerships across the country can analyze the financial and non-financial metrics of all their dealers together in one place using this feature.
Method 2: Organizations with different base currency
You can individually configure the required Zoho Finance organizations, using the Import Single Organization Data option, in the same workspace.
You can also import data from multiple Zoho Finance organizations into multiple Zoho Analytics workspaces. You can then add the data from these workspaces into a single workspace using the Import from Zoho Analytics Workspace option. This option will be useful when you want to analyze the data from multiple Zoho Finance organizations separately and combine only a few tables.
Once you have all the required data in a single workspace, you can combine them by creating a look-up column relation or query tables.
3. How do I create my own reports with this connector?
You can refer to the below presentation to know how to create your own reports & dashboards using Zoho Analytics.
Also refer:
4. Can I create reports using the columns from different modules?
Yes. Columns from across different tables can be dragged and dropped to create a report. Refer to our Creating Reports section to know how to create reports.
5. What are the report types supported by Zoho Analytics?
Zoho Analytics supports a wide variety of reports.
- Charts
- Pie
- Bubble
- Bubble Pie
- Packed Bubble
- Bar
- Stacked bar
- Line
- Smooth Line
- Scatter
- Combination
- Map Chart
- Area
- Stacked Area
- Web
- Funnel
- Doughnut
- Table View
- Pivot tables (Matrix Views)
- Summary view
- Tabular view
- KPI Widgets
- Single Numeric Widget
- Dial Chart Widget
- Bullet Chart Widget
- Dashboards (multiple reports arranged in the same page)
6. What are the default reports & dashboards created by Zoho Analytics, on setting up this connector?
When you set up/configure the Zoho Finance Integration Connector, 150+ default reports & dashboards are automatically created. These hand-picked reports will be pretty useful in analyzing your Zoho Finance organization data effectively.
7. What are Formulas in Zoho Analytics?
Formulas, as the name indicates, are calculations that you could define in Zoho Analytics to help you create the required reports. Zoho Analytics provides a powerful formula engine to create any type of calculations required, to enable creating the required reports. Refer Adding Formulas in Zoho Analytics to know more.
8. What are the default formulas added by Zoho Analytics, on setting up this connector?
The following are the default formulas added by Zoho Analytics. You can view these formulas by opening the corresponding table and selecting Add > Edit Formulas from the toolbar.
The following are the default formulas in the Accounts table.
| Formula Name | Formula Type | Formula | Description |
| Account Type Balance Sheet | Formula Column | If("Account Type" = 'Stock', 'Other asset', "Account Type") | Displays the account type |
| Account Group | Formula Column | If("Account Type" in ('Accounts Receivable','Bank','Cash','Other Current Asset','Stock') and "Account Base Type" = 'Asset','Total Current Assets', If("Account Base Type" = 'Asset' and "Account Type" in ('Fixed Asset'),'Total Fixed Assets',If("Account Base Type" = 'Liability','Total Current Liabilities',If("Account Base Type" = 'Equities','Total Equities',if("Account Base Type" in ('Income','Expense'),'Equites','') )))) | Groups the account into various categories |
| Balance Sheet Base Type | Formula Column | If("Account Base Type" in ('Liability','Expense','Income'),'Total Liabilities & Equities',"Account Base Type" ) | Displays the balance sheet base type |
| Balance Sheet Account Type | Formula Column | If("Account Base Type" in ('Income','Expense'),'',"Account Type") | Displays the balance sheet account type |
| Balance Sheet Account Name | Formula Column | If("Account Base Type" in ('Income','Expense'),'',"Account Name") | Displays the balance sheet account name |
| P&L Base Type | Formula Column | If("Account Base Type" in ('Income'),'Total Operating Income',"Account Base Type" ) | Displays the profit and loss base type |
| Account Type P&L | Formula Column | If("Account Type" in ('Income'), 'Total Operating Income',If("Account Type" in ('Cost Of Goods Sold'),'Total Cost of Goods Sold',If("Account Base Type" in('Expense') and"Account Type" not in ('Cost Of Goods Sold'),'Total Operating Expense',"Account Type"))) | Displays the account type based on profit and loss |
| Cash Flow - Type | Formula Column | If_case("Account Type",equals( 'Other Current Asset' , 'Accounts Receivable' , 'Liability' , 'Other Current Liability' , 'Credit Card' , 'Accounts Payable' , 'Other Liability' , 'Stock' , 'Overseas Tax Payable' , 'Output Tax' , 'Input Tax' ) ,'A. Cash Flow From Operating Activities',equals( 'Asset' , 'Other Asset' , 'Fixed Asset' ),'B. Cash Flow From Investing Activities',equals( 'Cash' , 'Bank' , 'Income' , 'Other Income' , 'Expense' , 'Cost Of Goods Sold' , 'Other Expense' , 'Payment Clearing Account' , 'Prepaid Card' ),'0','-1') | Displays the Cash Flow Type |
| Base Type P&L | Formula Column | If("Account Base Type" in ('Income'),'Total Operating Income',If("Account Type" in ('Cost Of Goods Sold'),'Total Cost of Goods Sold',If("Account Base Type" in('Expense') and"Account Type" not in ('Cost Of Goods Sold'),'Total Operating Expense',"Account Type"))) | Displays the profit and loss base type |
The following are the default formulas in the Bills table.
| Formula Name | Formula Type | Formula | Description |
| Age in Days | Formula Column | datediff(now(),"Bills"."Bill Date") | Number of days since the last bill date |
| Age in Tier | Formula Column | If( "Age in Days" >= 0, If( "Age in Days" <= 30, '1. 0 - 30 days', If( "Age in Days" <= 60, '2. 31 - 60 days', If( "Age in Days" <= 90, '3. 61 - 90 days', If( "Age in Days" <= 180, '4. 91 - 180 days','5. Above 180 days')))), '6. Negative - Not Valid') | .Classifies the time spent on a bill to close it, into different time period baskets, e.g., within 30 days, within 60 days etc., |
| Discount Rate | Formula Column | "Discount"*"Sub Total (BCY)"/100 | Displays the discounted amount rate |
| Balance | Formula Column | If("Status"='Sent',"Sub Total (BCY)",0) | Displays the balance in the account |
| Pending Bills Count | Aggregate Formula | Countif("Bills"."Status" in ('Sent','Draft')) | Displays the count of total outstanding bills |
| Paid Bills | Aggregate Formula | Countif("Bills"."Status" in ('Paid')) | Displays the count of paid bills |
| Pending Payables | Aggregate Formula | Sumif("Bills"."Status" in ('Sent'),"Bills"."Total (BCY)") | Displays the total amount of bills to be paid |
| Avg. Purchase Value | Aggregate Formula | Sum("Bills"."Total (BCY)")/Count("Bills"."Bill ID") | Displays the average value of each purchase |
| Discount % | Aggregate Formula | Sum("Bills"."Discount")/Sum("Bills"."Total (BCY)")*100 | Displays the discounted amount in percentage |
The following are the default formulas in the Expenses table.
| Formula Name | Formula Type | Formula | Description |
| Status | Formula Column | If("Is Billable"=1,'Billable','Non-Billable') | Displays the current status of the expenses made |
| Billable Expenses | Aggregate Formula | Countif("Expenses"."Is Billable" = '1') | Displays the count of expenses that can be recovered |
| Non-Billable Expenses | Aggregate Formula | Countif("Expenses"."Is Billable" = '0') | Displays the count of expenses that cannot be recovered |
The following are the default formulas in the Expense Claim table.
| Formula Name | Formula Type | Formula | Description |
| Reimbursement | Formula Column | If("Claim Reimbursement"=1, 'Reimbursed', 'Not Reimbursed') | Displays the reimbursement status |
| Expense Type | Formula Column | If(Day("Expense Date")>=1 and Day("Expense Date")<=3 and "Status"='approved', 'unsubmitted',"Status") | Displays the expense type |
| YTD Expenses | Aggregate Formula | YTD(Sum("Expense Claim"."Total (BCY)"),"Expense Claim"."Expense Date") | Displays the total year to date expense |
The following are the default formulas in the Invoices table.
| Formula Name | Formula Type | Formula | Description |
| Age In Days | Formula Column | datediff(now(), "Invoice Date") | Number of days since the last sales invoice date |
| Age Tier | Formula Column | If( "Age in Days" >= 0, If( "Age in Days" <= 20, '1. 0 - 30 days', If( "Age in Days" <= 60, '2. 31 - 60 days', If( "Age in Days" <= 90, '3. 61 - 90 days', If( "Age in Days" <= 180, '4. 91 - 180 days','5. Above 180 days')))), '6. Negative - Not Valid') | .Classifies the time spent on a invoice to close it, into different time period baskets, e.g., within 30 days, within 60 days etc., |
| Discount Amount | Formula Column | ("Sub Total (BCY)"*"Discount (%)")/100 | Displays the discounted amount |
| Type | Formula Column | If("Subscription ID",'Subscription','Invoice') | Displays the invoice type |
| Paid Invoice Value | Aggregate Formula | Sumif("Invoices"."Invoice Status" = 'Closed',"Invoices"."Total (BCY)") | Displays the paid amount in the invoice |
| Avg Sales Value | Aggregate Formula | Sum("Invoices"."Total (BCY)")/count(DISTINCT(("Invoices"."Invoice ID"))) | Displays the average sales value |
| Pending Receivables | Aggregate Formula | Sumif("Invoices"."Invoice Status" = 'AUTHORISED',"Invoices"."Total (BCY)") | Displays the current pending invoices |
| Revenue from New Subscriptions | Aggregate Formula | SumIf(month("Subscriptions"."Start Date") = month("Invoices"."Invoice Date") and Year("Subscriptions"."Start Date") = year("Invoices"."Invoice Date") and "Invoices"."Invoice Status" not in ('Void','Draft'),Ifnull("Invoices"."Sub Total (BCY)",0),0) | Displays the revenue gained from new subscriptions |
| Unpaid Invoice Count | Aggregate Formula | Countif("Invoices"."Type" = 'Subscription' and "Invoices"."Invoice Status" = 'Overdue') | Displays the remaining amount to be paid in the invoice |
| Average LTV | Aggregate Formula | Avgif(("Subscriptions"."Expired Date" is not null and "Invoices"."Type" = 'Subscription'),"Invoices"."Sub Total (BCY)",0) | Displays the average lifetime value |
| Revenue from Subscriptions | Aggregate Formula | Sumif("Invoices"."Subscription ID" is not null and "Invoices"."Invoice Status" not in ('Draft','Void'),(Ifnull("Invoices"."Sub Total (BCY)",0)),0) | Displays the revenue from subscriptions |
| Revenue from Existing Subscriptions | Aggregate Formula | "Invoices"."Revenue from Subscriptions"-"Invoices"."Revenue from New Subscriptions" | Displays the revenue from existing subscriptions |
| ARPU | Aggregate Formula | "Invoices"."Revenue from Subscriptions"/distinctcount("Subscriptions"."Customer ID") | Displays the average revenue per user |
| LTV | Aggregate Formula | Sumif("Subscriptions"."Expired Date" is not null and "Invoices"."Invoice Status" not in ('Void','Draft'),"Invoices"."Sub Total (BCY)",0) | Displays the sum of lifetime value |
| YTD Revenue | Aggregate Formula | YTD(Sumif("Invoices"."Type" in ('Subscription'),Ifnull("Invoices"."Sub Total (BCY)",0),0),"Invoices"."Invoice Date") | Displays the year to date revenue |
| New Subscriptions | Aggregate Formula | Countif(month("Subscriptions"."Start Date") = month("Invoices"."Invoice Date") and Year("Subscriptions"."Start Date") = year("Invoices"."Invoice Date") and "Invoices"."Type" in ('Subscription')) | Displays the count of new subscriptions |
| Open Invoices Value | Aggregate Formula | Sumif("Invoices"."Invoice Status" = 'Open',"Invoices"."Total (BCY)") | Displays the sum of all open invoices |
| Paid Invoices Count | Aggregate Formula | Countif("Invoices"."Invoice Status" = 'Closed') | Displays the sum of paid invoices |
| Open Invoices Count | Aggregate Formula | Countif("Invoices"."Invoice Status" = 'Open') | Displays the count of open invoices |
| YTD Invoices Count | Aggregate Formula | YTD(Count("Invoices"."Invoice ID"),"Invoices"."Invoice Date") | Displays the year to date invoices count |
| MTD Invoices Count | Aggregate Formula | MTD(Count("Invoices"."Invoice ID"),"Invoices"."Invoice Date") | Displays the month to date invoices count |
| YTD Invoice Value | Aggregate Formula | YTD(Sum("Invoices"."Total (BCY)"),"Invoices"."Invoice Date") | Displays the year to date invoices value |
| MTD Invoice Value | Aggregate Formula | MTD(Sum("Invoices"."Total (BCY)"),"Invoices"."Invoice Date") | Displays the month to date invoices value |
| MTD Sales Order Value | Aggregate Formula | MTD(Sum("Invoices"."Total (BCY)"),"Invoices"."Invoice Date") | Displays the month to date sales order value |
| YTD Sales order count | Aggregate Formula | YTD(Count("Invoices"."Invoice ID"),"Invoices"."Invoice Date") | Displays the year to date sales order value |
| Closed Invoices Count | Aggregate Formula | Countif("Invoices"."Invoice Status" = 'Closed') | Displays the count of closed invoices |
| Invoice Overdue Count | Aggregate Formula | Countif("Invoices"."Invoice Status" = 'Overdue') | Displays the count of overdue invoices |
| Invoice Overdue Amount | Aggregate Formula | Sumif("Invoices"."Invoice Status" = 'Overdue',"Invoices"."Total (BCY)",0) | Displays the total invoice overdue amount |
The following are the default formulas in the Invoice Items table.
| Formula Name | Formula Type | Formula | Description |
| Sales without Tax | Aggregate Formula | Avg("Invoices"."Total (BCY)")-sum("Invoice Items"."Tax Amount") | Displays the total sales amount excluding the tax amount |
| Cost Of Sales | Aggregate Formula | Sum(if("Invoices"."Invoice Status" = 'Closed' and "Invoice Items"."Product ID" is not null ,"Items"."Purchase Price"*"Invoice Items"."Quantity",0)) | Displays the total cost of the goods sold |
| Sales Value | Aggregate Formula | Sumif("Invoices"."Invoice Status" = 'Closed',"Invoice Items"."Total (BCY)") | Displays the sales value |
| Projected Profit | Aggregate Formula | "Invoice Items"."Sales Value"-"Invoice Items"."Cost Of Sales" | Displays the estimated profit |
| Profit % | Aggregate Formula | "Invoice Items"."Projected Profit"*100/"Invoice Items"."Sales Value" | Displays the percentage of Profit generated |
| Reimbursed Expenses | Aggregate Formula | Distinctcount(if("Invoices"."Invoice Status" = 'Closed' and "Invoice Items"."Expense ID" is not null ,"Invoice Items"."Invoice ID",null)) | Displays the count of reimbursed expenses |
| Reimbursed Expense Amount | Aggregate Formula | Sumif("Invoices"."Invoice Status" = 'closed' and "Invoice Items"."Expense ID" is not null ,"Expenses"."Total (BCY)") | Displays the amount of reimbursed expenses |
| Avg Sales per Order | Aggregate Formula | "Invoice Items"."Sales Value"/Count("Invoice Items"."Invoice ID") | Displays the average sales per order value |
| Avg Profit per Order | Aggregate Formula | "Invoice Items"."Projected Profit"/Count("Invoice Items"."Invoice ID") | Displays the average profit per order |
The following are the default formulas in the Sales Orders table.
| Formula Name | Formula Type | Formula | Description |
| MTD Sales Orders Value | Aggregate Formula | MTD(Sum("Sales Orders"."Total (BCY)"),"Sales Orders"."Order Date") | Displays the sum of month to date sales order |
| YTD Sales Orders Count | Aggregate Formula | YTD(Count("Sales Orders"."Sales order ID"),"Sales Orders"."Order Date") | Displays the count of year to date sales order |
The following are the default formulas in the Sales Order Item table.
| Formula Name | Formula Type | Formula | Description |
| Item Fill Rate | Aggregate Formula | Sum("Sales Order Item"."Quantity Shipped")/Sum("Sales Order Item"."Quantity")*100 | Displays the total rate at which the items are filled |
| Orders Shipped in Full | Aggregate Formula | Sumif("Sales Order Item"."Quantity Shipped" = "Sales Order Item"."Quantity","Sales Order Item"."Quantity",0) | Displays the total quantity of orders shipped |
| Customer Order Fill Rate | Aggregate Formula | "Sales Order Item"."Orders Shipped in Full"/Sum("Sales Order Item"."Quantity")*100 | Displays the total number of customer demands met by immediate stock |
| Committed Stock | Aggregate Formula | (Sumif("Sales Orders"."Status" NOT IN ('draft','void'),Ifnull("Sales Order Item"."Quantity",0),0)-Sumif("Sales Orders"."Status" NOT IN ('draft','void'),Ifnull("Sales Order Item"."Quantity Invoiced",0),0)-Sumif("Sales Orders"."Status" NOT IN ('draft','void'),Ifnull("Sales Order Item"."Quantity Cancelled",0),0)) | Displays the sum of total stock committed for sale |
The following are the default formulas in the Shipment Order table.
| Formula Name | Formula Type | Formula | Description |
| Delivered Shipments | Aggregate Formula | Countif("Shipment Order"."Status" = 'delivered') | Displays the total count of delivered shipments |
| Average Shipment Cost | Aggregate Formula | Sum("Shipment Order"."Shipping Charge")/Count("Shipment Order"."Shipment ID") | Displays the average shipment cost |
| Shipment Delivered % | Aggregate Formula | "Shipment Order"."Delivered Shipments"/Count("Shipment Order"."Shipment ID")*100 | Displays the total percent of delivered shipments |
The following are the default formulas in the Sales Return Items table.
| Formula Name | Formula Type | Formula | Description |
| Quantity | Aggregate | "Receivable Quantity" + "Credit Only Quantity" | Displays the quantity of returned items |
The following are the default formulas in theTrips table.
| Formula Name | Formula Type | Formula | Description |
| Duration of Trip | Formula Column | Datediff("End Date", "Start Date") | Displays the number of days of a trip taken |
| International or Domestic | Formula Column | If("Is International"=1, 'International', 'Domestic') | Mentions if the trip was international or domestic |
| YTD Trip Count | Aggregate Formula | YTD(Count("Trips"."Trip ID"),"Trips"."Start Date") | Displays the year to date trip count |
| Average Duration | Aggregate Formula | Avg("Trips"."Duration of Trip") | Displays the average duration between trips |
| Average Cost per Trip | Aggregate Formula | Avg("Trips"."BCY Amount") | Displays the average cost per trip |
The following are the default formulas in the Vendor Credits table.
| Formula Name | Formula Type | Formula | Description |
| Applied Credits | Aggregate | Sumif("Vendor Credits"."Vendor Credit Status" = 'closed',"Vendor Credits"."Total (BCY)",0) | Displays the sum of credits applied |
The following are the default formulas in the Carts table.
| Formula Name | Formula Type | Formula | Description |
| Cart Conversion Rate | Aggregate | count("Cart"."Invoice ID")/count("Cart"."Cart ID"))*100 | This formula gets the percentage of successful conversions from Cart. |
9. How do I create my own custom formulas in Zoho Analytics?
You can also add your own formulas to derive your own calculations in Zoho Analytics. To know how to create your own formulas refer to the Adding Formulas in Zoho Analytics help page.
10. Can I join data from multiple tables to create reports?
Yes, you can join data from multiple tables to create the reports. Refer to Joining Tables in Zoho Analytics for detailed help on this.
11. What are Query Tables?
Zoho Analytics allows you to drive the data required by writing standard SQL SELECT Queries. This feature is called Query Tables. With Query Tables, you can also combine data from different tables and create reports from the same. View the create Query Tables in Zoho Analytics video to know more.
Users, Sharing & Collaboration
1. How do I share the reports in Zoho Analytics with my colleagues?
You can easily share the default reports provided in the Zoho Analytics connector and also the reports you create using the share option. Refer to Sharing and Collaboration video to learn more.
Once you privately share a report to your colleagues they will be able to access the same from the Zoho Analytics service.
Note:
- If you share the data tables in the Zoho Finance Advanced Analytics Workspace to users, they will be able to create their own reports over the same.
- If you add a user as a Workspace Administrator in the Zoho Finance Advanced Analytics Workspace created in Zoho Analytics (Refer Managing Users in Zoho Analytics, to know how to add Workspace Administrator), the user will be able access all the data & reports, create new reports and do any operation that you could do on the Workspace.
2. Why are other members in my organization not able to access the reports created?
When a Zoho Finance Administrator configures the Zoho Finance - Zoho Analytics connector, the tables and reports will be available only to him/her, by default. The Administrator has to share the 'Zoho Finance Advanced Analytics' workspace with other members of the organization. Only then will the default reports be accessible by those members. Let's say the Administrator has shared the Workspace with other members in the organization. A member creates his/her own reports. Those reports will be available only to him/her alone unless he/she shares them with others.
To know more, refer to Sharing and Collaboration help page.
3. How can other members in my organization create reports?
The Zoho Finance Administrator who has setup the connector should share the tables present in Zoho Finance Advanced Analytics workspace with other members of the organization. Once this is done, the shared users can create reports based on those tables.
To know more, refer to Sharing and Collaboration help page.
4. What are the user roles available in Zoho Analytics?
Zoho Analytics offers three user roles - Account Administrator, Workspace Administrator, and User. Click to know more about the Zoho Analytics Organization Model and User Roles.
5. Why can't other users edit the reports that I have shared to them?
This is the expected behavior. If the user being shared to is a Workspace Administrator, he/she can edit the reports. If a normal user wants to edit a report, what he/she can do is to use Save As to save the report in a different name in his account. This report can then be edited.
6. Can I share the same report created to multiple users with different criteria associated, so that they see different data?
Yes, you can. Refer to Apply filter criteria help documentation to know how this can be done.
7. Can I export a report/dashboard?
Yes, you can export the report/dashboard in various file formats such as CSV, EXCEL, PDF, HTML and Image. Click to know more.
8. How can I print the reports & dashboards created in Zoho Analytics?
In order to print the report/dashboard, you first need to export it. You can export the report in various file formats such as CSV, EXCEL, PDF, HTML and Image. Click to know more.
9. How can I email reports & dashboards created in Zoho Analytics in a scheduled manner?
If you are the Administrator of the Zoho Analytics connector or a Workspace Administrator, you can schedule reports and dashboards to be emailed automatically. Refer to the email schedule help documentation.
10. How do I embed my reports in my intranet, blog, or presentation?
You can easily embed the reports & dashboards created in Zoho Analytics in your website, web application, or blog. Refer Embedding in Web Pages/Blogs to know more about this.
Cross-Functional Analytics with Zoho Applications
1. What are the Zoho applications that I can combine with Zoho Finance for cross-functional analytics?
Zoho users can integrate Zoho Finance with other useful Zoho applications such as Zoho CRM, Zoho Desk, Zoho Creator, Zoho Projects, Zoho BugTracker, and Zoho Recruit. If you are a ManageEngine user then you can perform cross-functional analytics on the data from ManageEngine ServiceDesk Plus and ManageEngine SupportCenter Plus. This means users who are using Zoho Finance with other products can import all the data into a single workspace and perform cross-functional analytics.
Click to learn more about each of these integrations in detail.
2. How can I analyze the data from other Zoho apps along with Zoho Finance?
You can import the data from the Zoho applications into a single Zoho Finance Advanced Analytics workspace to analyze the data together.
To import data from the Zoho Apps,
- From your Zoho Finance Advanced Analytics workspace, click Create > New Table/Import Data.
- From the Import Your Data page, select the Zoho application that you wish to import.
- Provide the necessary authentications.
- Select the necessary modules and fields.
- Select the schedule import options.
- Click Create.
3. Will the related modules from Zoho Finance and other Zoho applications be automatically created for Zoho Analytics?
A lookup relationship between the modules of Zoho CRM and the modules of Zoho Finance will be created automatically. We are yet to come up with this model for other Zoho applications. Until then, you can manually create a lookup relationship between those modules. To know more, refer to joining tables help documentation.
4. How do I integrate Zoho Finance apps and Zoho CRM?
To set up the Zoho Finance connector into your Zoho CRM Advanced Analytics workspace,
- Open your Zoho CRM Advanced Analytics workspace.
- Click Create > New Table/Import Data.
- From the Import Your Data page, select Zoho Finance.
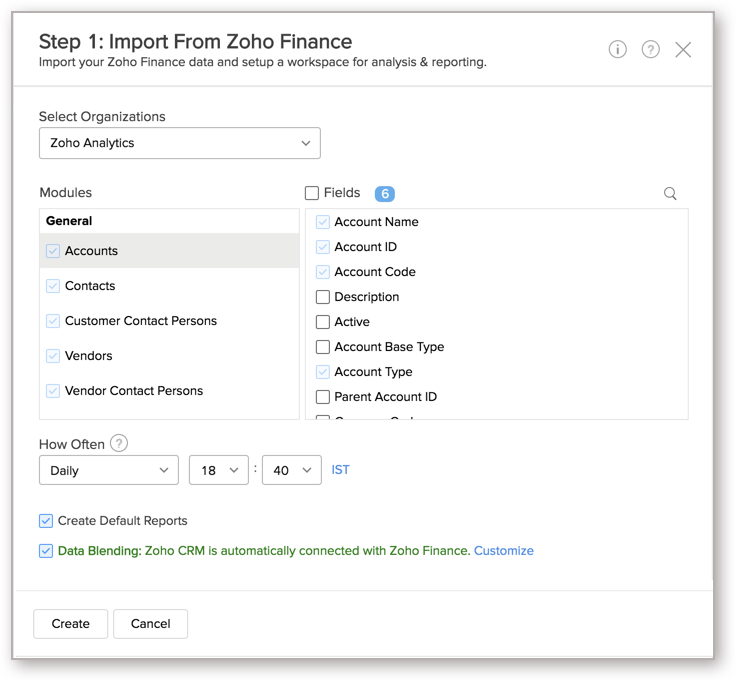
- Input the necessary details in the Import From Zoho Finance dialog and click Next.
- Zoho Analytics will auto-identify columns and setup joins (lookups) between the Zoho CRM and Zoho Finance organization data tables for easy cross-service analysis as the Zoho CRM Advanced Analytics connector is already setup in the workspace. You can customize the lookups between the Zoho CRM and Zoho Finance organization data tables if required.
- To customize the lookups, click the Customize link next to the Data Blending: Zoho CRM is automatically connected with Zoho Finance checkbox.
The Blend Data - Customize Lookups page will list all the possible lookup relations available. You can add a lookup relation by selecting the corresponding checkbox.
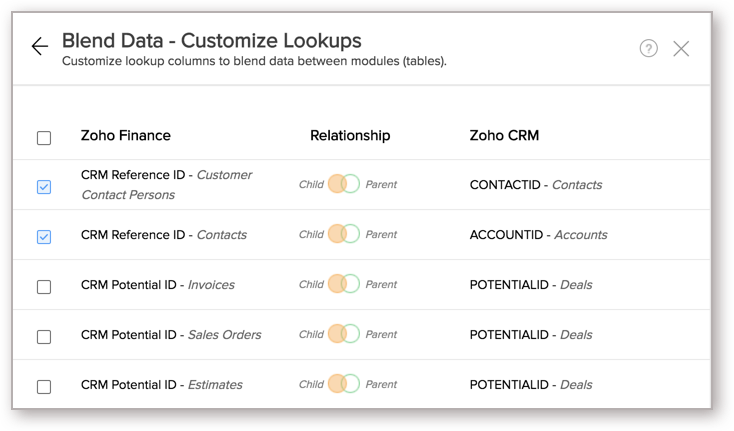 Note: When you select a lookup relation, the modules and fields respective to the lookup will also get added automatically.
- Click Create to set up the connector.


Once the setup is completed, the Zoho Finance data will be imported into your Zoho CRM Advanced Analytics workspace. A set of reports and dashboards will be created automatically in Zoho Analytics by default. You can also manually create reports combining the modules of both Zoho CRM and Zoho Finance as desired.
Note:
- You need setup the Zoho Finance connector in the same workspace where Zoho CRM connector is setup. If you have already setup the Zoho Finance connector in a separate workspace, you need to delete it.
- The relational look ups is created between Zoho CRM modules and the modules that are common in all the Zoho Finance apps.
5. Can I integrate multiple Zoho Finance organizations with Zoho CRM in Zoho Analytics?
Data blending is yet to be supported for multiple organizations' data.
As of now, you can blend data from only one Zoho Finance organization with Zoho CRM in Zoho Analytics. It is not possible to link multiple organizations from one data source to another data source in Zoho Analytics.
Cross-Functional Analytics with Popular Third-Party Business Applications
1. What are the popular business applications that I can integrate Zoho Finance with?
You can import data from all the popular business applications that Zoho Analytics offers integration with.
2. How can I analyze the data from the third-party business applications along with Zoho Finance?
To import data from the third party business apps,
- Open your Zoho Finance Advanced Analytics workspace.
- Click Create > New Table/Import Data.
- From the Import Your Data page, select the application that you wish to import.
- Provide the necessary authentications.
- Select the necessary modules and fields.
- Select the schedule import options.
- Click Create.
3. Will a relationship (lookup) be created between Zoho Finance and the third party applications that I integrate Zoho Finance with?
No, a lookup relationship will not be created between the Zoho Finance modules and the modules of the application that you are trying to import automatically.
To manually create a lookup relationship refer this help link.
Help & Support
1. How do I get technical support on Zoho Analytics connector?
We offer 24x5 technical support (Monday to Friday). In case if you need our assistance kindly do mail us your questions to support@zohoanalytics.com.
You can also reach out to us on our toll free numbers -
United States: +1 (888) 900 9646
United Kingdom: +44 (20) 35647890
Australia: +61-2-80662898
India: 044 - 69656060
2. Can I have someone from Zoho do a Demo of this connector for me?
Yes, certainly. Register for a demo in this page.
Solutions
Balance Sheet - Multiple Organization Setup with Same Base Currency
If you have a business operating from multiple locations in same country, you can use the multiple organization setup to analyze all business data.
Balance Sheet - Organization with a branch in different countries with different base currencies.
If you have an organization with a branch in different countries, you can use the single organization setup with a few additional steps to create a consolidated balance sheets.
Balance Sheet - Multiple orgs, multiple countries with different base currencies
If you have a business operating from multiple locations in different countries with different base currencies, you can use the multiple organization setup with a few additional steps create a consolidated balance sheets.
Expected Revenue based on Subscription Data
Forecast sales for upcoming months with the subscription data.