A beginner’s guide to AI-powered data visualization in Zoho Analytics
- Last Updated : March 13, 2026
- 1.7K Views
- 5 Min Read
If you’ve never created data visualizations like charts and reports before—or if you have but find the process too complex or time consuming—this blog is for you.
We’ve put together a list of useful AI features available in Zoho Analytics that can help you create data visualizations with ease.

Zoho Analytics(a powerful data visualization software) offers multiple AI-powered capabilities under Zia, Zoho’s intelligent assistant.
Ask Zia: Your AI assistant for data visualizations
Imagine you’re rushing to put together reports for an upcoming presentation, and time is tight. Wouldn’t it be great to have an assistant who could create reports for you just by understanding what you need?
That’s where Zia comes in.
With Ask Zia, even non-technical users can easily generate visualizations by typing or speaking what they want. In our previous blog on creating data visualizations, we used a sample marketing dataset and manually built a data visualization dashboard (the usual way).
This time, we’ll recreate the same dashboard (only faster) with Zia’s help. Just type or say what kind of report you want, and Zia will build it in seconds.
Here’s a quick video showing how we created the same marketing dashboard with Zia in under two minutes.
Zia is already helping over 20,000 businesses worldwide simplify their data visualization and analysis processes.
Let's hear it from someone who uses Zia in their daily work:
"We have embedded Zoho Analytics within our internally developed financial services software. Whenever I have a new client meeting, I demonstrate the Ask Zia feature of Zoho Analytics with a question like, 'What was my income last month?' Its quick reply or visual fascinates my clients, and they say, 'This is what we want.' It allows me to show them that we are a forward-thinking company partnered with a global company like Zoho."
- Craig Roxby, Managing Director, Magnifi
You can try Ask Zia right now. Sign up for a 15-day free trial and start asking questions about your data.
Zia Suggestions for smarter chart recommendations
Sometimes, you build a report manually but end up choosing the wrong chart type. It happens. Wouldn’t it be nice if someone could suggest the right visualization?
Thanks to Zia Suggestions, you now have that help in choosing the right data visualization type.

Zia not only suggests the best chart types for your data but also guides you on where to place each column to get the desired result. So the next time you’re unsure about which chart to use, you’ll know what to do.
Use Zia Insights to get key takeaways instantly
You’ve created charts, reports, and dashboards. But here comes the trickier part: uncovering insights. Especially if you’re new to analytics, deriving meaningful insights can be time consuming. Reviewing a report, identifying patterns, jotting down conclusions, and sharing them with stakeholders can take ages.
That’s where Zia Insights helps.
With just one click, you get key insights presented both textually and visually. Zia highlights important findings in a simple, easy-to-understand format.
Here’s a sample video of a report where you can click the Zia Insights button and get key insights. You can toggle between text and visual summaries, too.
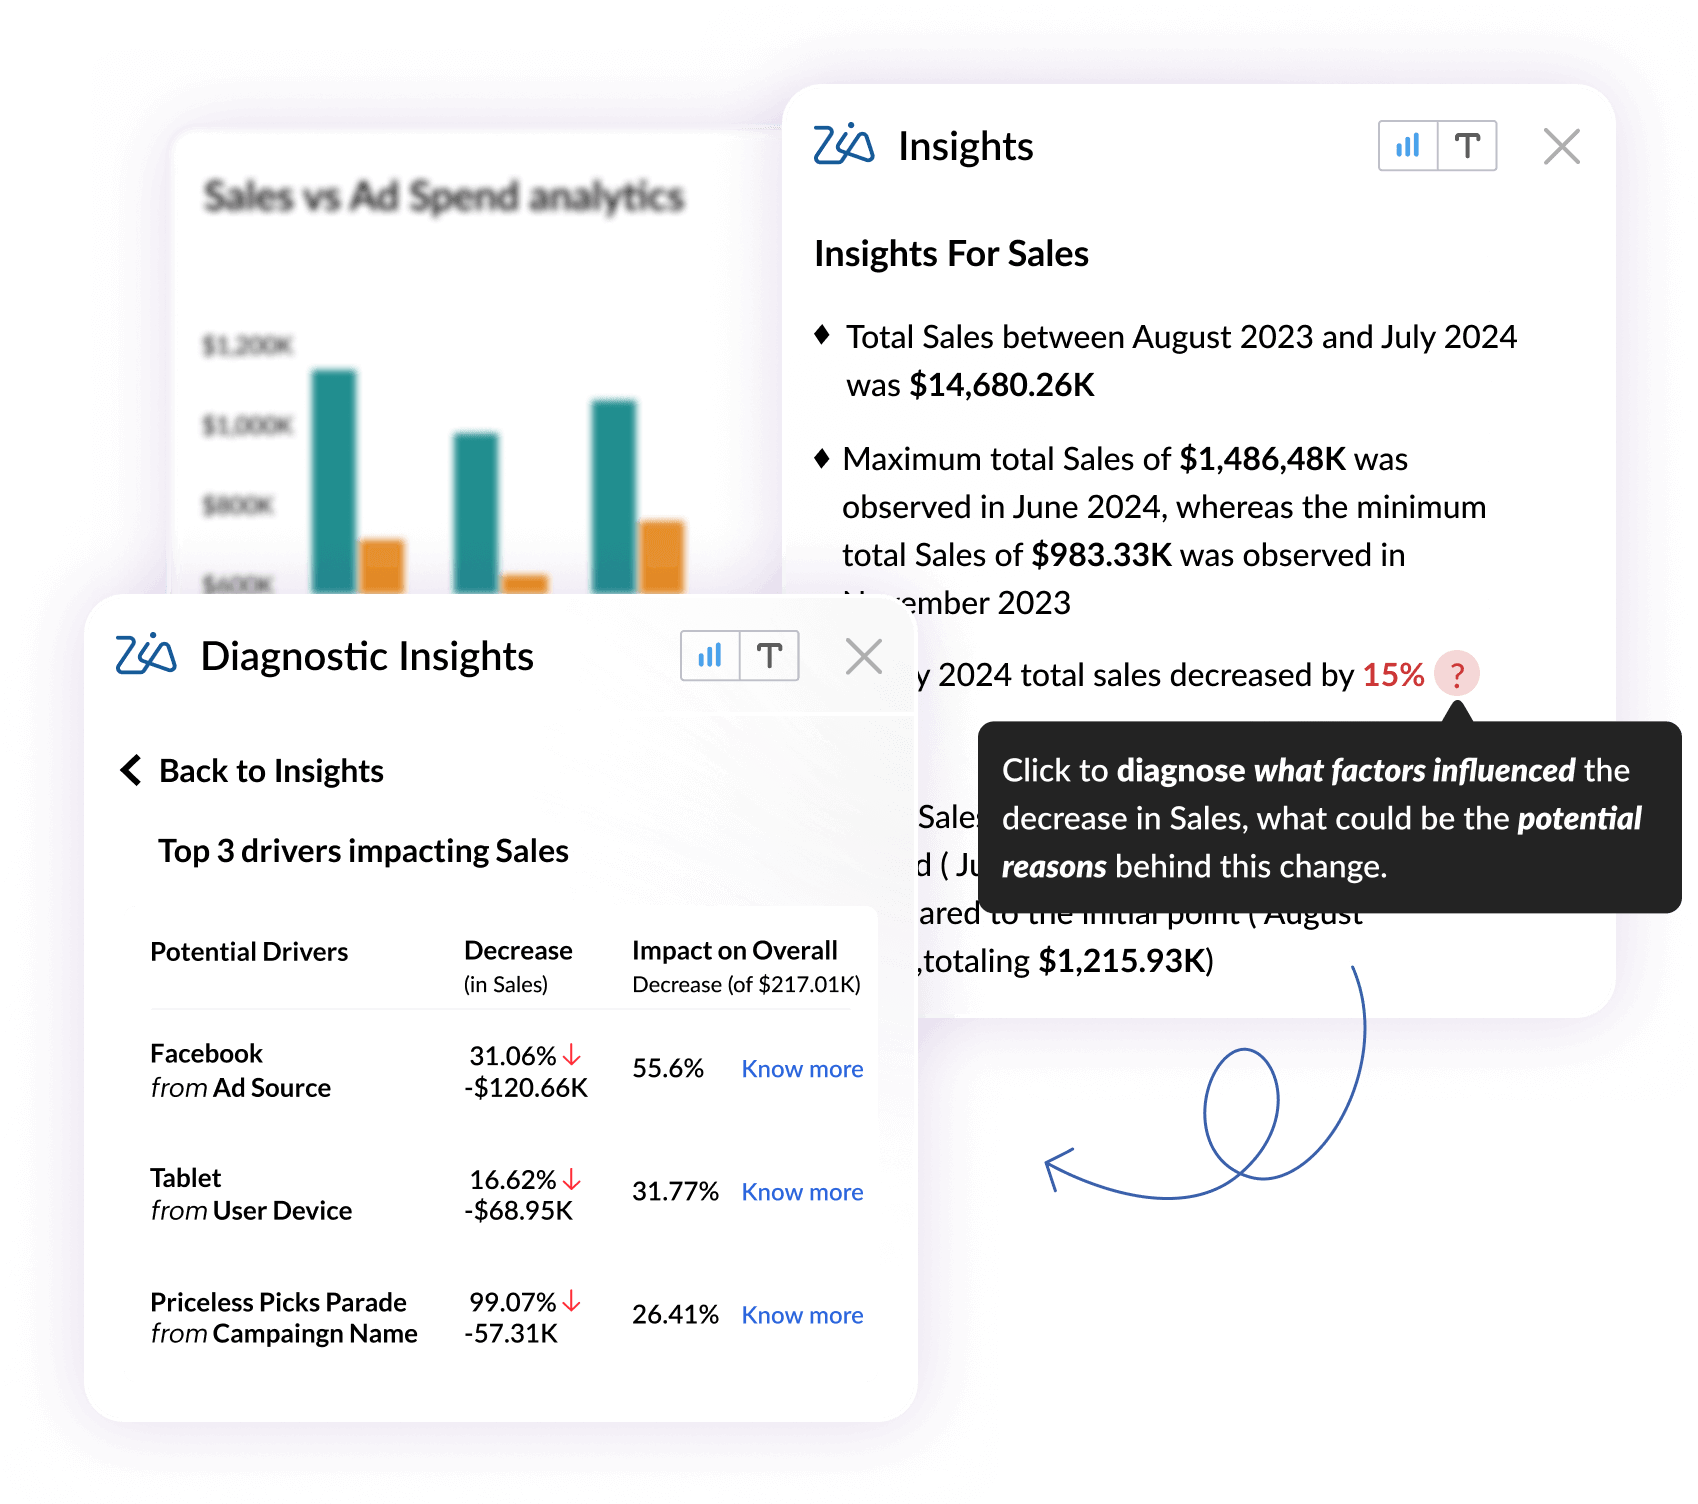
Zoho Analytics also offers diagnostic analytics options inside Zia Insights, letting you diagnose what factors influenced a particular KPI change. Here's a snapshot:
Auto-analysis: Let Zia do the thinking
Some of you might be thinking: “This is great. But I don’t even know what kind of reports to build. I just have the data.”
No worries, we’ve got you covered.
With auto-analysis, all you need to do is upload your dataset. Optionally, select columns to analyze, and Zia will take care of the rest. It will scan your data, identify patterns, and create contextual interactive data visualizations, like reports and dashboards, all in under a minute.
Sounds too good to be true? Watch this video where Zia auto-analyzes a dataset and creates a dashboard for it.
Teams can also enable real-time data visualization to monitor changing metrics instantly and uncover trends as they emerge.
Prebuilt reports for 100+ cloud business apps
If your data is available in cloud apps like CRMs, marketing tools, or finance platforms, Zoho Analytics provides prebuilt reports and dashboards for over 100 business apps.
Just connect your app, and Zia will automatically generate ready-made reports and dashboards, no manual setup needed. Start analyzing your data right away.
Explore featured connectors and see available dashboards.
AI forecasting
Some of you might be looking for more advanced features. Don’t worry, we’ve got something for you too.
In the competitive business landscape, relying solely on historical data is no longer sufficient. Businesses need to predict what’s coming and plan ahead. That’s where AI forecasting steps in as a key component of predictive analytics software.
And no, forecasting isn’t just for data scientists.
With Zia’s AI forecasting, simply choose the period you want to predict, and Zia will select the most suitable forecasting model for your data.
If you’re more technical, you can also pick from models like ARIMA, ETS, STL, and various regression models.
What can you do with AI forecasting?
- Do you have two years of sales data? Forecast sales for the next three or six months in under a minute.
- Predict website traffic over the next quarter. Spot trends and plan your marketing strategies accordingly.
AI-powered data preparation with Zoho DataPrep
What if your data is messy or spread across multiple sources and formats?
We’ve all been there. Preparing data for analysis can be time consuming and frustrating.
Enter Zoho DataPrep, available right inside Zoho Analytics*. It comes with 250+ transformation options and an AI assistant to help clean, merge, and format your data.
Watch this quick video to see how AI helps you prep your data efficiently.
*Zoho DataPrep is available in Premium and Enterprise plans.
Wrapping up
We’ve walked through some powerful AI features in Zoho Analytics that make data visualization faster and easier than ever.
From asking simple questions to getting instant insights and even preparing data, Zia’s got your back.
You can book a free personalized demo to see how Zoho Analytics can help your business.
If you’re new, Zoho Analytics is one of the best AI data visualization tools. You can explore all these features with a 15-day free trial.
No credit card required. No feature limitations. Trusted by 20,000+ businesses.
 Pradeep V
Pradeep is a product marketer at Zoho Analytics with a deep passion for data and analytics. With over eight years of experience, he has authored insightful content across diverse domains, including BI, data analytics, and more. His hands-on expertise in building dashboards for marketing, sales, and major sporting events like IPL and FIFA adds a data-driven perspective to his writing. He has also contributed guest blogs on LinkedIn, sharing his knowledge with a broader audience. Outside of work, he enjoys reading and exploring new ideas in the marketing world.