Data Visualization Software
Are you getting the real insights you need, when it comes to making business decisions? Zoho Analytics, as a data visualization software, helps you transform any data into rich visuals. It also helps you arrive at the right decisions faster, and with confidence.
Sign up in less than 60 seconds
Discover hidden insights in your data easily

Import and visualize any business data
Import data into Zoho Analytics from a variety of data sources such as local files, web URLs, cloud drives (Google Spreadsheets, Box, Microsoft OneDrive etc), local and cloud databases, popular business applications, custom applications etc., for in-depth analysis.
Visual analysis
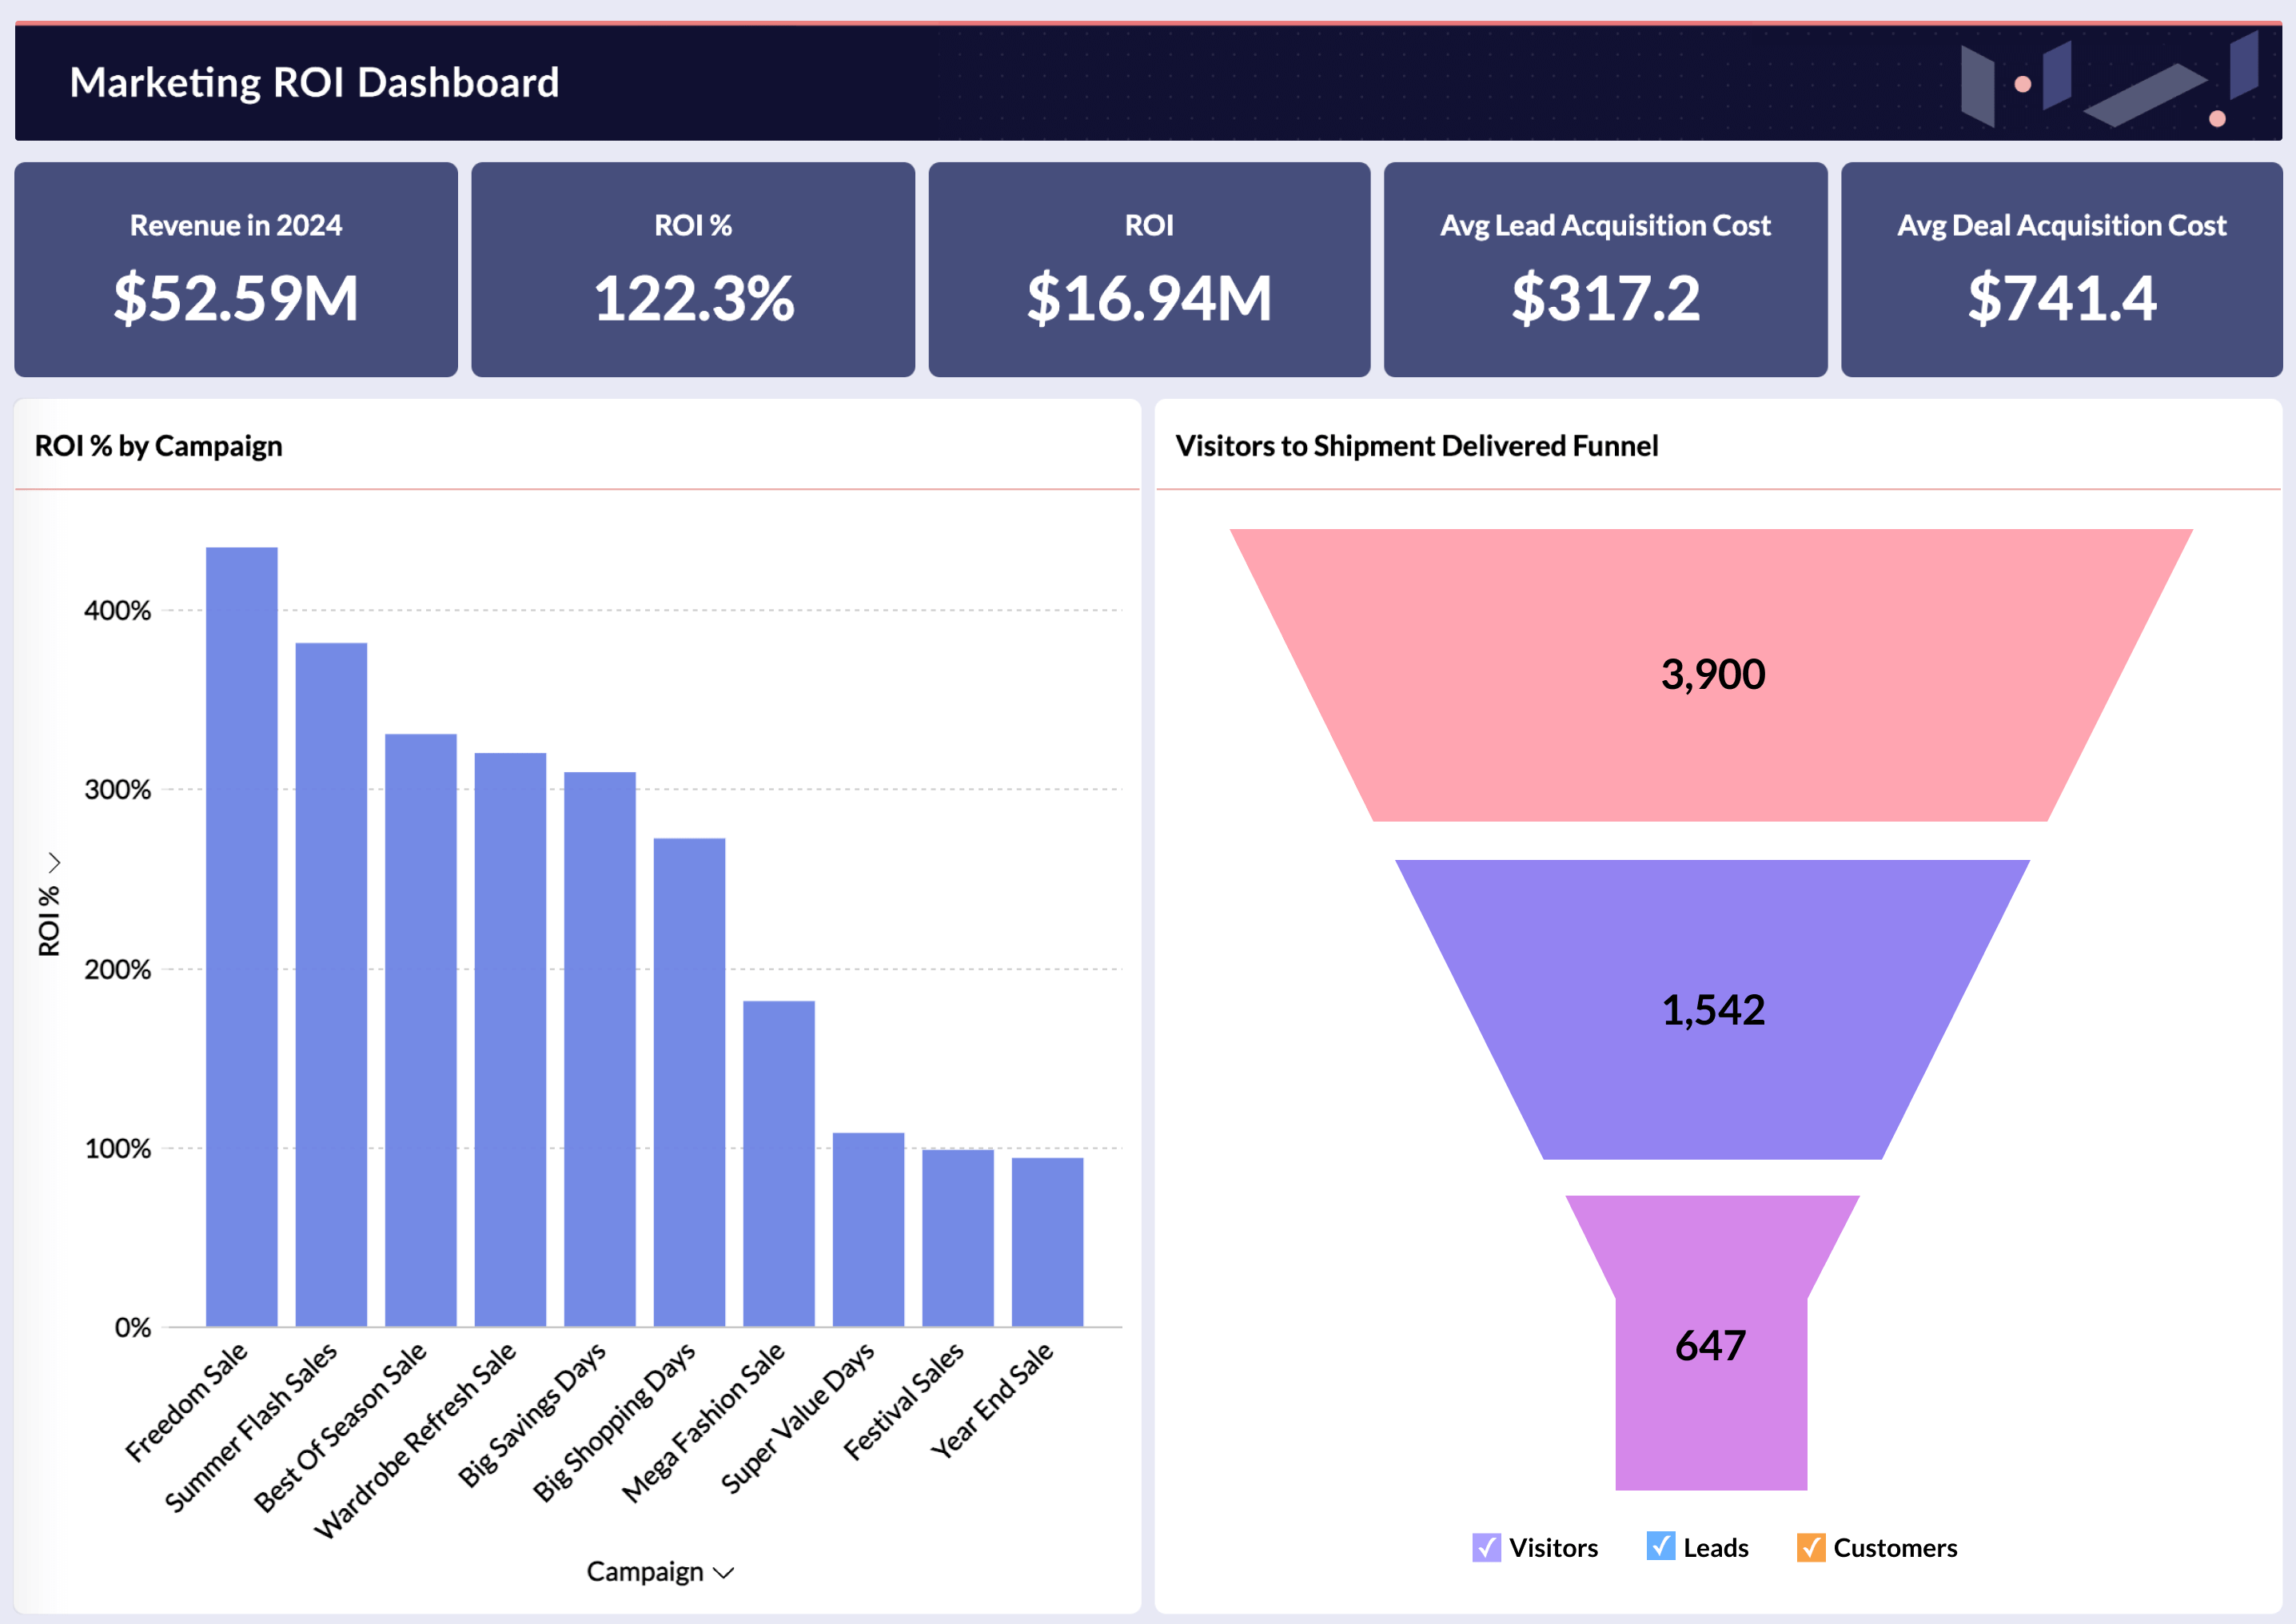
Make use of a variety of data visualization tools like charts, widgets, pivot tables and tabular view components to create insightful reports and dashboards with an easy drag-and-drop interface.


Secure online collaboration
Share and collaborate on reports and dashboards with your colleagues. Have full control over what your colleagues or clients can see and do with the reports you share with them. Embed your data visualizations as reports and dashboards to reach a wider audience. Export or print reports for offline access. Schedule reports and dashboards to be emailed automatically.
Cross-functional data analytics
Combine data from different sources to create cross-functional reports, and thereby get more insight into your business. For example, combine your sales (Zoho CRM) data with your helpdesk (Zoho Desk) data to create a 'Sales vs. Tickets Raised' report.

Other related connectors
View more"Zoho Analytics is one of the most robust reporting platforms out there to stratify and cut multiple data points. It provides us with invaluable tools to analyze our business."

RYAN FOX,
Regional Director, Health Outcomes Sciences
"We use Zoho Analytics to integrate all of our reporting needs. We can not only access it but explore it, dive deep, ask questions. It's super fast, easy to use and cheaper."

JUAN MARTITEGUI,
Founder, Educatemia.