Microsoft Dynamics CRM Advanced Analytics
Zoho Analytics Advanced Analytics for Microsoft Dynamics CRM empowers you with analytical capabilities over your Dynamics CRM data thereby giving you greater visibility on your Sales data. With this connector, you can create insightful reports & dashboards over your Microsoft Dynamics CRM data for in-depth sales analytics.
General
- What is Zoho Analytics?
- What is Dynamics CRM Advanced Analytics?
- Who can subscribe to the Dynamics CRM Connector?
- What do I get when I subscribe for this connector?
Pricing
- How much does this connector cost?
- What do you mean by 'Users' in the (connector) pricing plan?
- What do you mean by 'Rows' and how is it calculated in the pricing plan?
Setup
- How do I setup the Connector for my Dynamics CRM account?
- How long should I wait for my Dynamics CRM data to initially appear in Zoho Analytics?
- I got this email which said 'Setup Process Failed'/'Synchronization Process Failed'. What should I do?
- How frequently can I synchronize my data with Zoho Analytics?
- Can I import custom fields?
- Can I edit the Dynamics CRM Connector Synchronization setting?
- Can I view data Sync History?
- Can I synchronize my Dynamics CRM data instantly?
- In whose account will the Dynamics CRM Connector be setup?
- How can I view the information details about data synchronization between Dynamics CRM and Zoho Analytics?
- What are the modules in Dynamics CRM on which I could create reports using this connector?
- How to create my own reports with this connector?
- Who has access to the reports I create?
- Can I transfer my Dynamics CRM Connector to another admin account?
- How can I remove the setup?
Reporting Features
- What are the report types supported by Zoho Analytics?
- What are the default reports and dashboards that are available on setting up this connector?
- How do I create reports using fields/columns across different modules?
- What are 'Formulas' in Zoho Analytics?
- What are the default formulas added by Zoho Analytics, on setting up this connector?
- How do I create my own custom formulas in Zoho Analytics?
- Can I add/modify data in the Dynamics CRM data tables (modules) from within Zoho Analytics?
- Can I add new columns to the Dynamics CRM data tables (modules) from within Zoho Analytics?
- Can I add new data tables in this Workspace to create reports & dashboards?
- Can I combine data from other sources with the data from Dynamics CRM to create reports and dashboards?
- Can I join data from multiple tables to create reports?
- What are Query Tables?
Users, Sharing & Collaboration
- How do I share the reports in Zoho Analytics with my colleagues?
- Why are other members in my organization not able to access the reports created?
- How can other members in my organization create reports?
- What are the user roles available in Zoho Analytics?
- Why can't other users edit the reports that I have shared to them?
- Can I share the same report created to multiple users with different criteria associated, so that they see different data?
- Can I export a report/dashboard?
- How can I print the reports & dashboards created in Zoho Analytics?
- How can I email reports & dashboards created in Zoho Analytics in a scheduled manner?
- How do I embed my reports in my intranet, blog or presentation?
Help & Support
- How do I get technical support on Zoho Analytics connector?
- Can I have someone from Zoho do a Demo of this connector for me?
Cross Functional Analytics with Popular Business Applications
- What are the popular business applications that I can integrate Dynamics CRM with?
- How can I analyze the data from the business applications along with Dynamics CRM?
- Will a relationship (lookup) be created between Dynamics CRM and the third party applications that I integrate Dynamics CRM with?
Solution Catalog
You can access a catalog of useful solutions that will guide you in creating reports for widely asked Key Sales Performance metrics over the Microsoft Dynamics CRM data. Click to learn more.
General
1. What is Zoho Analytics?
Zoho Analytics is a self-service BI and data analytics software that lets you analyze your data, create stunning data visualizations, and discover hidden insights in minutes.
It offers the following important capabilities:
- Complete Online Reporting & Business Intelligence service accessible anytime and anywhere!
- Easy to adopt 'Spreadsheet-like' interface with powerful drag & drop based reporting features for quick report creation.
- Visual Analysis capability for in-depth analysis and to slice & dice your data
- Supports a wide range of reporting capabilities like Dashboards, Charts, Pivot Tables, Summary and simple Tabular reports. Supports creation of KPI widgets in dashboards to analyze the performance.
- Supports data import from variety of file formats like Excel, JSON, HTML etc. Also supports data import from cloud storage and Web URLs. Supports periodic scheduling of import.
- Integrated with Microsoft Dynamics CRM to empower your Dynamics CRM data with the powerful reporting capabilities of Zoho Analytics.
- Integrated with other Zoho products such as Zoho CRM, Zoho Books, Zoho Projects, Zoho BugTracker etc.
- Zoho Analytics is integrated with popular business applications like Google Analytics, Salesforce CRM etc.
- You can also integrate your own applications with Zoho Analytics using Zoho Analytics API.
- Integrated with Zapier to power up import from over 500+ apps.
- Blend & merge data from across different sources to create meaningful business reports
- With an advanced formula engine, you can derive key business metrics from your data. Also supports SQL (Structured Query Language) driven querying for powerful report creation.
- Real-time collaboration by sharing data and reports in read or read-write modes with your colleagues & friends.
- Export and Print reports in variety of formats. Notify reports via email.
- Publish reports for wider consumption. Embed reports within your websites, web applications and blogs.
- Highly secure through user login with support for HTTPS (SSL connection). All your data and reports are hosted in highly secure datacenters. (Refer Security and Privacy)
- Supports Logo Rebranding.
2. What is Dynamics CRM Advanced Analytics Connector?
Dynamics CRM Advanced Analytics Connector enables you to import your Dynamics CRM data into Zoho Analytics for advanced reporting and analysis. This connector brings in all the capabilities of Zoho Analytics described above to Dynamics CRM users.
- A full-featured business intelligence (BI) and reporting tool that can slice & dice your Dynamics CRM data to create any report/dashboard you require.
- Over 100+ handpicked reports/dashboards that anyone using Microsoft Dynamics CRM will find great value in.
- Create your own reports and dashboards based on not only your Dynamics CRM data but also from any other data sources and popular business applications
- Share reports and dashboards with your colleagues.
- Schedule and email your reports whenever you want.
- Export your reports as PDF, HTML, Excel, CSV and image files.
- Embed your reports in websites, blogs etc.
3. Who can subscribe to the Dynamics CRM Connector?
Any Dynamics CRM user can configure this connector to effectively analyze their sales data.
4. What do I get when I Subscribe for this Connector?
As a Dynamics CRM users, subscribing to this connector brings you immense benefits. You get to look at your data in Dynamics CRM in ways you haven't looked at before. Using this Zoho Analytics connector enables you to do powerful analysis of your Dynamics CRM data and create insightful reports & dashboards. You can create insightful reports to predict your sales pipeline, know your sales win/loss rate, know your Top 5 / Bottom 5 sales persons and do much more with ease.
Zoho Analytics' drag-and-drop based reporting is so easy to use that you could create any report or dashboard on your Dynamics CRM data with no IT help or technical knowledge and share them to your colleagues.
Pricing
1. How much does this connector cost?
The Microsoft Dynamics Advanced Analytics connector is available in all the paid plans of Zoho Analytics. The paid plans start at per month.
Click to know how to subscribe to a paid plan.
2. What do you mean by 'Users' in the (connector) pricing plan?
Anyone to whom you privately share your databases, tables (data), reports and dashboards, created in Zoho Analytics, for collaboration is considered a 'User' in Zoho Analytics. A user is identified by his/her unique email address, with which their Zoho Analytics account was registered.
Suppose you subscribe to the Zoho Analytics Standard plan, you can privately share the data/reports in your account and collaborate with 4 other persons. Now your Zoho Analytics account is said to have 5 users (including yourself). Click to know more about the Zoho Analytics user model.
3. What do you mean by 'Rows' and how is it calculated in the pricing plan?
In Zoho Analytics, a row or record is defined in the same context as in a database (or spreadsheet). In simple terms, a table consists of rows (records) and columns (fields). Each row in a table represents a set of related data and has the same structure. For example, in a table that represents "Invoices", each row would represent a single invoice record. The number of rows calculated for pricing, is the sum of all rows/records stored across all your database tables in your Zoho Analytics account.
Setup
1. How do I setup the Connector for my Dynamics CRM account?
Also refer:
2. How long should I wait for my Dynamics CRM data to initially appear in Zoho Analytics?
After configuring this connector, you might have to wait sometime for the initial fetch to happen. If you access the database before the initial fetch, it will not display any data.
3. I got this email which said 'Setup Process Failed'/'Synchronization Process Failed'. What should I do?
The import/sync process of your Dynamics CRM data can sometimes fail due to a variety of reasons. Hence you may receive such mails occasionally. The Zoho Analytics team will look into it immediately and get back to you, after taking the required corrective action.
Case 1: You will receive the Setup Process Failed mail when there is a failure during the initial fetch. In this case we request you to:
- Open the database in which you have setup the connector.
- Click the Dynamics CRM button (or Data Sources button - in the case where the database contains multiple tables) in the Explorer tab.
- In the Data Sources tab that appears click the Retry Now link.
- If the issue persists please do write to support@zohoanalytics.com. We will look into it and get back to you immediately.
Case 2: You will receive the Synchronization Failed mail if there is any failure during the data synchronization process between Dynamics CRM and Zoho Analytics, after the initial setup & import of data. This might be a momentary failure due to any internal issues. This import schedule will get suspended if there are five successive failures.
4. How frequently can I synchronize my data with Zoho Analytics?
You can choose to synchronize data at one of the intervals mentioned below.
- 1 Hour (Enterprise plan Only)
- 3 Hours
- 6 Hours
- 12 Hours
- Every day
Note:
- Users in Enterprise plan alone can choose to synchronize data at every 1 hour.
- Users in Basic plan can synchronize their data only once everyday.
5. Can I import custom fields from Dynamics CRM?
Yes, you can import custom fields from Dynamics CRM. You can add the custom fields by selecting the fields either while setting up the connector or by using the "Edit Setup" option (refer next question).
6. Can I edit the Dynamics CRM Connector Synchronization setting?
Yes, you can edit the Dynamics CRM Connector synchronization setting if you are the administrator of the Zoho Analytics account.
- Open the Dynamics CRM advanced analytics Workspace.
- Click the Dynamics CRM button in the Explorer tab (or Data Sources button - in the case where the database contains multiple connector setups).
- In the Data Sources tab that opens, click the Edit Setup link.

- Make the necessary changes and click Save.
7. Can I view the data synced history?
Yes, you can view the data synced history. Follow the below steps to view the data synced history.
- Open the corresponding Dynamic CRM Analytics Workspace in Zoho Analytics.
- Click Data Sources on the left panel. All the data source of the workspace will be listed.
- Click Dynamic CRM. The Data Sources page for Dynamic CRM will open.
- In the Data Sources page that opens, click the Sync History link.
- A calendar with the sync history of the last 45 days will open. The date when the data sync has happened will be highlighted. Hover to view the number of times the data had got synced on a specific date.
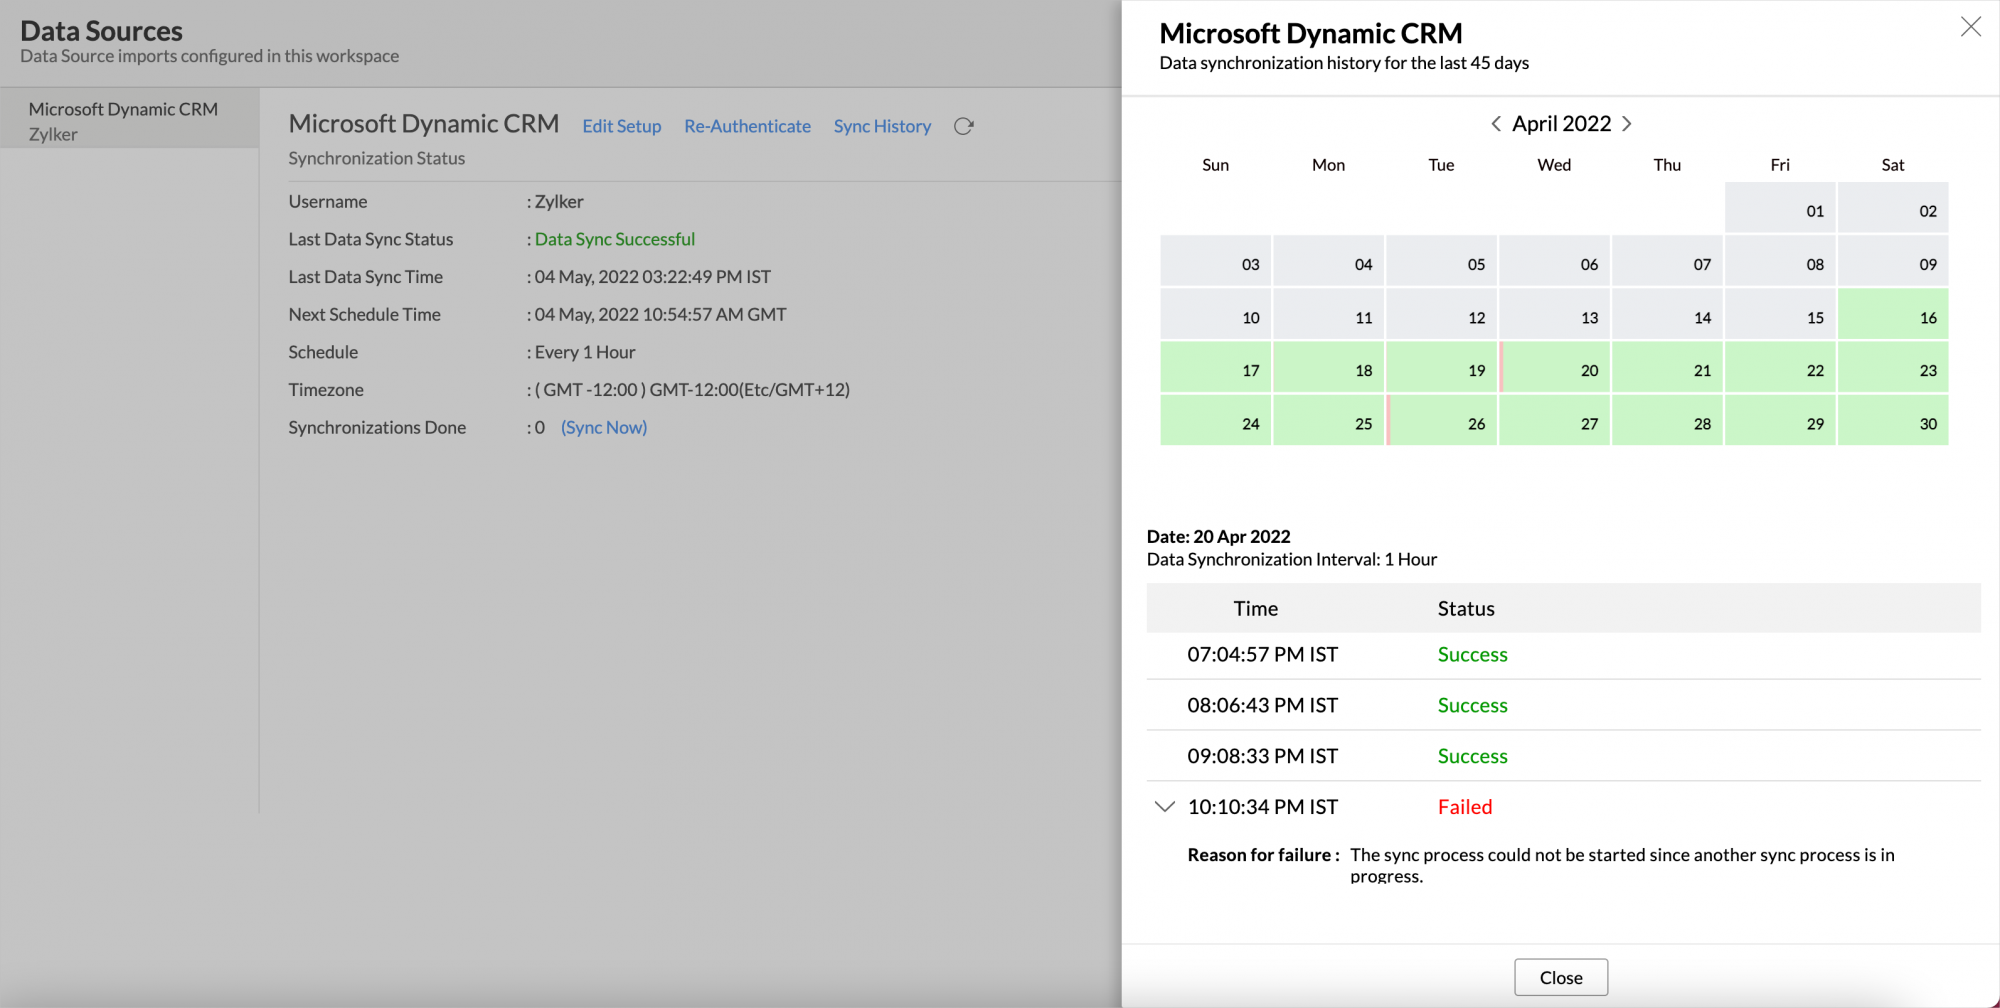
- Click the date to view more details.
- Time - Displays the time when the data is synced.
- Status - Shows whether the sync was a success or a failure.
In case of failure, the reason will be displayed. Refer to this page to learn how to resolve the issue and avoid further failure.

8. Can I synchronize my Dynamics CRM data instantly?
Yes, you can synchronize your Dynamics CRM data instantly when needed.
To synchronize your data instantly:
- Login to your Zoho Analytics account.
- Open the corresponding Workspace.
- In the Explorer tab, click Dynamics CRM button (or Data Sources button - in the case where the database contains multiple connector setups).
- In the Data Sources tab that opens click Sync Now.

- Dynamics CRM data will get instantly synchronized.
9. In whose account will the Dynamics CRM Connector be setup?
It will be setup in the corresponding Zoho Analytics account of the Dynamics CRM user who configured this connector.
10. How can I view the information details about data synchronization between Dynamics CRM and Zoho Analytics?
- Open the corresponding Workspace in Zoho Analytics.
- In the Explorer tab, click Dynamics CRM/Data Sources button. The Data Sources tab opens listing the below details.
- Last Data Sync Status: The status of the last synchronization.
- Last Data Sync Time: The time of the last synchronization.
- Schedule: The interval in which the import is scheduled.
- Next Schedule Time: The time of the next schedule.
- Time Zone: The timezone of the schedule.
- Synchronizations Done: Number of synchronizations done in that particular day.

11. What are the modules in Dynamics CRM on which I could create reports using this connector?
Data from the following modules in Dynamics CRM will get synchronized with Zoho Analytics.
- Accounts
- Campaigns, Campaign Responses
- Cases
- Contacts
- Contracts, Contract Lines
- Goals
- Invoices
- Invoice Products
- Leads
- Notes
- Opportunities, Opportunity Products
- Orders, Order Products
- Phone Calls, Email Messages, Faxes
- Price Lists, Price List Items
- Products
- Quotes, Quote Products
- Services
- Tasks
- Territories
- Users
12. How to create my own reports with this connector?
Also refer:
13. Who has access to the reports I create?
By default, the reports you create are accessible only to you. However, you can share the reports with your colleagues using the 'Sharing' options available in Zoho Analytics. Refer How to Share Reports & Dashboards question.
14. Can I transfer my Dynamics CRM Connector to another admin account?
At present, we do not provide an option in the user interface. If you require this transfer, please do mail us to support@zohoanalytics.com and we will do this for you.
15. How can I remove the setup?
- Login to your Zoho Analytics account.
- Open the corresponding Workspace.
- In the Explorer tab, click Dynamics CRM button (or Data Sources button - in the case where the database contains multiple connector setups).
- In the Data Sources tab that opens click the Settings icon and select Remove Data Source as shown in the snapshot.

Reporting Features
1. What are the report types supported by Zoho Analytics?
Zoho Analytics supports a wide variety of reports.
- Charts
- Pie
- Bullet
- Dial
- Bubble
- Packed Bubble
- Bar
- Stacked bar
- Line
- Smooth Line
- Scatter
- Combination
- Area
- Stacked Area
- Web
- Funnel
- Doughnut
- Table View
- Pivot tables (Matrix Views)
- Summary view
- Tabular view
- Dashboards (multiple reports arranged in the same page)
2. What are the default reports & dashboards created by Zoho Analytics, on setting up this Connector?
When you setup/configure the Dynamics CRM Integration Connector, 100+ default reports & dashboards are automatically created. These hand-picked reports will be pretty useful in analyzing your Dynamics CRM organization data effectively.
You can quickly review the default reports from the Microsoft Dynamics CRM Advanced Analytics Sample database.
3. How do I create reports using fields/columns across different modules?
Columns from across different tables that are related through a lookup column can be dragged and dropped to create a report. Refer to this help documentation to know how to join tables.
Refer to this presentation to know how to create reports.
4. What are 'Formulas' in reports?
Formulas, as the name indicates, are calculations that you could define in Zoho Analytics to help you create the required reports. Zoho Analytics provides a powerful formula engine to create any type of calculations required, to enable creating the required reports. Refer Adding Formulas in Zoho Analytics to know more.
5. What are the default formulas added by Zoho Analytics, on setting up this connector?
You can also add your own formulas to derive your own calculations. Do refer to Adding Formulas in Zoho Analytics help page. You can view these formulas by opening the corresponding table and selecting Add > Edit.
The following are the formulas from the Cases table:
| Formula Name | Formula | Formula Type | Description |
| Days to Closed | Custom | if("Case Stage"='Closed',datediff("Modified On","Created On"),null) | Provides the number of days taken to close the case. If it is not closed, it will return NULL |
| Age in Days | Custom | datediff(if("Case Stage"='Closed',"Modified On",now()),"Created On") | Number of days it took for a cases to be closed. If the Closing Date is not available (null), we calculate the days till today from the case created time. |
| Age Tier | Custom | if("Age in Days">=0,if("Age in Days"<=60,'1.0-60days',if("Age in Days"<=120,'2.61-120 days',if("Age in Days"<=180,'3.121-180days',if("Age in Days"<=360,'4.181-360 days','5.Above 360 days')))),'6.Negative-NotValid') | Classifies the time spent on a cases to close it, into different time period baskets, e.g., within 60 months, within 120 days etc |
| No.of Closed Cases | Aggregate | countif("Cases"."Case stage"='Closed') | Provides the count of closed cases. |
| % of Closed Cases | Aggregate | ("Cases"."No.of Closed Cases"/count("Cases"."Case"))*100 | Provides the percentage of closed cases. |
The following are the formulas from the Order Products table
| Formula Name | Formula | Formula Type | Description |
| Sales Orders Delivered Count | Aggregate | count(if("Orders"."Status Reason" = 'Delivered', "Order Products". "OrderProduct", NULL)) | Provides the count of sales order delivered. |
| COGS (Cost Of Goods Sold) | Aggregate | sum(if("Orders"."Status Reason"='Delivered',"Products"."Current Cost(Base)"*"Order Products"."Quantity",NULL)) | Provides the cost of the goods sold. |
| Sales Value | Aggregate | sum(if("Orders"."Status Reason"='Delivered',"Order Products"."Amount(Base)",NULL)) | Provides the sales value amount based on the products ordered |
| Projected Profit | Aggregate | ("Order Products"."Sales Value"-"Order Products". "COGS (Cost Of Goods Sold)") | Provides the projected profit. |
| Profit Margin | Aggregate | ("Order Products"."Projected Profit"/"Order Products". "Sales Value")*100 | Provides the profit margin percentage. |
| Avg. Sales Value | Aggregate | sum (if ("Orders"."Status Reason"='Delivered',"Order Products"." Amount (Base)", NULL)) / count("Order Products"."Order") | Provides the average sales value. |
The following are the formulas from the Orders table
| Formula Name | Formula | Formula Type | Description |
| Order fulfillment Rate | Aggregate | (countif("Orders"."Status Reason"in('Delivered'))/count("Orders"."Order"))*100 | Provides percentage of order fulfillment rate in percentage. |
| Cancellation Rate | Aggregate | (countif("Orders"."Status Reason"in('Cancelled'))/ count("Orders"."Order"))*100 | Provides the cancellation rate in percentage. |
The following are the formulas from the Opportunities table
| Formula Name | Formula | Formula Type | Description |
| Age in Days | Custom | datediff (ifnull ("Actual Close Date", now()),"Created On") | Number of days it took for a opportunity to be closed. If the Closing Date is not available (null), we calculate the days till today from the opportunity created time. |
| Age Tier | Custom | if("Age in Days">=0, if("Age in Days"'1. 0-60 days', if ("Age in Days"< =120,'2. 61-120 days', if("Age in Days"<=180,' 3. 121-180 days', if("Age in Days"< = 360,'4. 181-360 days', '5. Above 360 days')))),'6. Negative-Not Valid') | Classifies the time spent on a opportunity to close it, into different time period baskets, e.g., within 60 months, within 120 days etc., |
| Amount Tier | Custom | if ("Total Amount(Base)"> = 0, if("Total Amount(Base)" < = 10000,'1.0-$10K', if("Total Amount(Base)" if("Total Amount(Base)"< = 30000, '3. $20,001-$30K', if("Total Amount(Base)" < = 40000,'4. $30,001-$40K', '5.Above 40K')))), '6. Negative-Not Valid') | Classifying sales based on $ value (amount of sale made), e.g., upto 10,000, 10,001 to 20,000, 20,001 to 30,000 etc |
| Won Amount | Aggregate | (sumif("Opportunities"."Status Reason"='Won',"Opportunities"."Total Amount(Base)")) | Provides the won amount. |
| Won Deals Count | Aggregate | (countif("Opportunities"."Status Reason"='Won')) | Provides the count of the deals won. |
| Win Rate% | Aggregate | (Countif("Opportunities"."Status Reason"='Won')*100/count(if("Opportunities". "Status Reason" in ('Won', 'Lost'), "Opportunities"."Opportunity",NULL))) | Provides the percentage of win rate. |
| Avg Deal Size Won | Aggregate | (avgif("Opportunities". "Status Reason"='Won', "Opportunities". "Total Amount(Base)",NULL)) | Provides the average deal won. |
| Won vs Expected Revenue % | Aggregate | (sumif("Opportunities"."Status Reason"='Won',"Opportunities"."Total Amount (Base)")*100 / sum("Opportunities". "Est.Revenue (Base)")) | Ratio of sum of sales won and sum of revenue expected |
| Lost Deals Count | Aggregate | (count(if("Opportunities"."Status Reason"='lost',"Opportunities"."Opportunity",NULL))) | Total number of deals lost |
| Avg Sales Cycle | Aggregate | (avgif("Opportunities"."Status Reason"IN('Won','Lost'),"Opportunities"."Age in Days")) | The average number of days it takes to close an opportunity (the sale can either be won or lost, but the opportunity shouldn't be in an open state). |
| Lost Amount | Aggregate | (sumif("Opportunities"."Status Reason"='lost',"Opportunities"."Total Amount(Base)")) | Total amount of sales lost |
| Open Deals Count | Aggregate | (count(if("Opportunities"."Status Reason"='Open',"Opportunities"."Opportunity",NULL))) | Total number of deals open |
| Won Deals Count Last 365 Days | Aggregate | (count(if("Opportunities"."Status Reason"='Won' AND "Opportunities"."Actual Close Date">subdate (currentdate(),'365'),1,NULL))) | Provides the count of deals won in last 365 days. |
| Open Deals Count Next 90 Days | Aggregate | (count(if("Opportunities"."StatusReason"='Open' AND "Opportunities"."Actual Close Date"> = currentdate()AND "Opportunities"."Actual Close Date" < adddate(currentdate(),90),1,NULL))) | Provides the count of open deals (not closed) whose closing date lies within next 90 days. |
| Lost Deals Count Last 365 Days | Aggregate | (count(if("Opportunities"."Status Reason"='Lost' AND "Opportunities"."Actual Close Date" > subdate(currentdate(),'365'),1,NULL))) | Provides the count of deals lost in last 365 days. |
| Win Rate Percentage Last 365 Days | Aggregate | ("Opportunities"."WonDealsCountLast365Days"*100) /("Opportunities"."Won Deals Count Last 365 Days"+"Opportunities"."Lost Deals Count Last 365Days") | Provides the percentage of deals won in last 365 days. |
| Predicted New Deals Count Next 90 Days | Aggregate | (("Opportunities"."Win Rate Percentage Last 365 Days"/100)*"Opportunities"."Open Deals Count Next 90 Days") | Predicts the count of Deals expected to be Won in the next 90 days. It is calculated based on Deals Won in the past 365 days. |
| Avg Deal Size Last 365 Days | Aggregate | (avgif("Opportunities"."Status Reason"='Won'AND "Opportunities"."Actual Close Date">subdate(current date(),'365'),"Opportunities"."Total Amount(Base)")) | Provides the average of deals won in last 365 days. |
| Predicted Pipeline Revenue | Aggregate | ("Opportunities"."Predicted New Deals Count Next 90 Days"*"Opportunities"."Avg Deal Size Last 365 Days") | Predicts the Sales expected in future, based on current pipeline and past trends. |
| Opportunities Created Last 365 Days | Aggregate | (count(if("Opportunities"."Created On" > subdate(currentdate(), 365), 1,NULL))) | Provides the opportunities created in last 365 days. |
| Predicted New Business - Next 3 Months | Aggregate | ("Opportunities"."Win Rate Percentage Last 365 Days"/100)*("Opportunities". "Avg Deal Size Last 365 Days")*(("Opportunities"."Opportunities Created Last 365 Days"*90)/365) | Predicts the new business expected in the next 3 months. |
| Loss Rate% | Aggregate | (count(if("Opportunities"."Status Reason"='Lost',1,NULL))*100/count (if("Opportunities"."Status Reason" in('Won','Lost'),1,NULL))) | Provides the rate at which sales are lost (in %). This calculated as a Ratio between number of deals lost and total number (won + lost) of deals |
| Converted Lead Count | Aggregate | count("Leads"."Qualifying Opportunity") | Provides the count of Leads converted into Potentials. |
6. How do I create my own custom formulas in Zoho Analytics?
Refer to the Adding Formulas in Zoho Analytics help page.
7. Can I add/modify data in the Dynamics CRM data tables in Zoho Analytics?
No, you cannot add modify data in Dynamics CRM data tables. Data from Dynamics CRM modules gets automatically synched into Zoho Analytics in the different tables (one table for one module). You cannot edit any of this data or add new data records from within Zoho Analytics.
However, you can add new tables and add/import data into that, to create reports combining it with the data from Dynamics CRM.
8. Can I add new columns to the Dynamics CRM data tables in Zoho Analytics?
No, you cannot add new columns. But, you can add Formula Columns and Aggregate Formulas (i.e., calculated fields) to these tables to help you create powerful reports. Refer Adding Formulas to know more on this.
9. Can I add new data tables in this Workspace to create reports & dashboards?
Yes, you can add new data tables. Click New > New Table to add a new table in the existing Dynamics CRM Workspace.
With this feature, you can import data from other sources or add them manually into your Workspace to analyze and create reports combining this with your Dynamics CRM data. You can also import data from other business applications like Google Analytics etc.
Refer:
- How to Import data from files and feeds into Zoho Analytics
- How to Import data from local databases using Upload tool
- Import data from popular Business Applications
- How to Import data using Zoho Analytics API
10. Can I combine data from other sources with the data from Dynamics CRM to create reports and dashboards?
Yes, you can combine data from your other sources with your Dynamics CRM data for analysis.
To do this, you need to add/import a new data table into the Dynamics CRM Workspace and then define a look-up to join it with the synchronized table from Dynamics CRM.
To define a lookup relationship between two tables, it is essential that the tables have at least one column which is common between them. Follow the below steps to look up a column from Dynamics CRM along with the data from any other source.
- Open the corresponding table, right click the column header and select Change to Lookup Column.
- In the Change to Lookup Column dialog that opens, select the column to look up.
- Click Ok
Please do note that you can create Lookup only to columns in the tables that are not from the same data source.
11. Can I join data from multiple tables to create reports?
Yes, you can join data from multiple tables to create the reports. Refer to Joining Tables in Zoho Analytics for detailed help on this.
12. What are Query Tables?
Zoho Analytics allow you to pull the data required by writing standard SQL SELECT Queries. This is called Query Tables. With Query Tables you can also combine data from different tables and create reports over the same. View this demo video to know about how to create Query Tables in Zoho Analytics.
Cross-Functional Analytics with Popular Business Applications
1. What are the popular business applications that I can integrate Dynamics CRM with?
You can import data from popular business applications listed below.
- MailChimp
- Zendesk
- QuickBooks
- Xero
- Teamwork Projects
- Google AdWords
- Google Analytics
- Zoho Projects
- Zoho Desk
- Zoho Finance
2. How can I analyze the data from the third party business applications along with Dynamics CRM?
To import data from the third party business apps,
- Open the Dynamics CRM database
- Click the Import Data button
- In the Create New Table tab that opens, select the application that you wish to import.
- Provide the necessary authentications
- Select the necessary modules and fields
- Select the schedule import options
- Click Create
3. Will the related modules from Dynamics CRM and other business application be created automatically?
No, a lookup relationship will not be created between the Dynamics CRM modules and the modules of the application that you are trying to import automatically.
To manually create a lookup relationship refer this help link.
Users, Sharing & Collaboration
1. How do I share the reports in Zoho Analytics with my colleagues?
You can share the default reports provided in the Dynamics CRM connector and the reports you have create, with other users in your portal. Refer to Sharing and Collaboration help page for more details on this.
Once you privately share a report to your colleagues they will be able to access the reports as you do. Refer here to know how to access the reports.
2. Why are other members in my organization not able to access the reports created?
When a Dynamics CRM Administrator configures the Dynamics CRM - Zoho Analytics connector, the tables and reports will be available only to him/her, by default. The Administrator has to share the 'Dynamics CRM Advanced Analytics' database with other members of the organization. Only then will the default reports be accessible by those members.
To know more, refer to Sharing and Collaboration help page.
3. How can other members in my organization create reports?
The Dynamics CRM Administrator who has setup the connector should share the tables present in 'Dynamics CRM Advanced Analytics' database with other members of the organization. Once this is done, the shared users can create reports based on those tables.
To know more, refer to Sharing and Collaboration help page.
4. What are the user roles available in Zoho Analytics?
Zoho Analytics offers three user roles - Administrator, Workspace Administrator and User. Click to know more about the Zoho Analytics User Model and User Roles.
5. Why can't other users edit the reports that I have shared to them?
This is the expected behavior. Only when the users being shared is set as a Workspace Administrators, they can edit the reports. If a normal user wants to edit the report, he/she will have to save the report with a new name using the Save As option toolbar. The User can edit this report.
6. Can I share the same report created to multiple users with different criteria associated, so that they see different data?
Yes, you can. Refer the topic Apply filter criteria.
7. Can I export a report/dashboard?
Yes, you can export the report/dashboard in various file formats such as CSV, EXCEL, PDF, HTML and Image. Click to know more.
8. How can I print the reports & dashboards created in Zoho Analytics?
In order to print the report/dashboard, you first need to export it. You can export the report in various file formats such as CSV, EXCEL, PDF, HTML and Image. Click to know more.
Note
- If you are a user to whom a report has been shared and you want to take a print, ensure you have been provided the Export permission by the Administrator to the report, only then you will be able to print the report.
9. How can I email reports & dashboards created in Zoho Analytics in a scheduled manner?
If you are the Administrator of the Zoho Analytics connector or a 'Workspace Administrator', you can schedule reports and dashboards to be emailed automatically. Refer to the email schedule section in this help documentation.
10. How do I embed my reports in my intranet, blog or presentation?
You can easily embed the reports & dashboards created in Zoho Analytics in your website, web application or blog. Refer Embedding in Web Pages/Blogs to know more about this.
Help & Support
1. How do I get technical support on Zoho Analytics connector?
We offer 24x5 technical support (Monday to Friday). In case if you need our assistance kindly do mail us your questions to support@zohoanalytics.com.
You can also reach out to us on our toll-free numbers -
United States: +1 (888) 900 9646
United Kingdom: +44 (20) 35647890
Australia: +61-2-80662898
India: +91-44-67447000
2. Can I have someone from Zoho do a Demo of this connector for me?
Yes, certainly. Register for a demo in this page.
Solution Catalog
You can access a catalog of useful solutions that will guide you in creating reports for widely asked Key Sales Performance metrics over the Microsoft Dynamics CRM data. Click to learn more.