- HOME
- BI & Analytics
- Business Intelligence for Enterprises
Business Intelligence for Enterprises
- Last Updated : August 13, 2026
- 118 Views
- 15 Min Read
Enterprise business intelligence (enterprise BI) brings together data from across an organization into a governed environment where employees can explore information, monitor performance, and make decisions using a consistent set of metrics. Unlike departmental reporting, enterprise BI supports thousands of users, multiple business functions, and complex governance requirements while ensuring everyone works from the same trusted data.
This guide explains what enterprise business intelligence is, how it differs from traditional BI, how enterprise BI platforms are implemented, and the key capabilities to evaluate when selecting a solution.
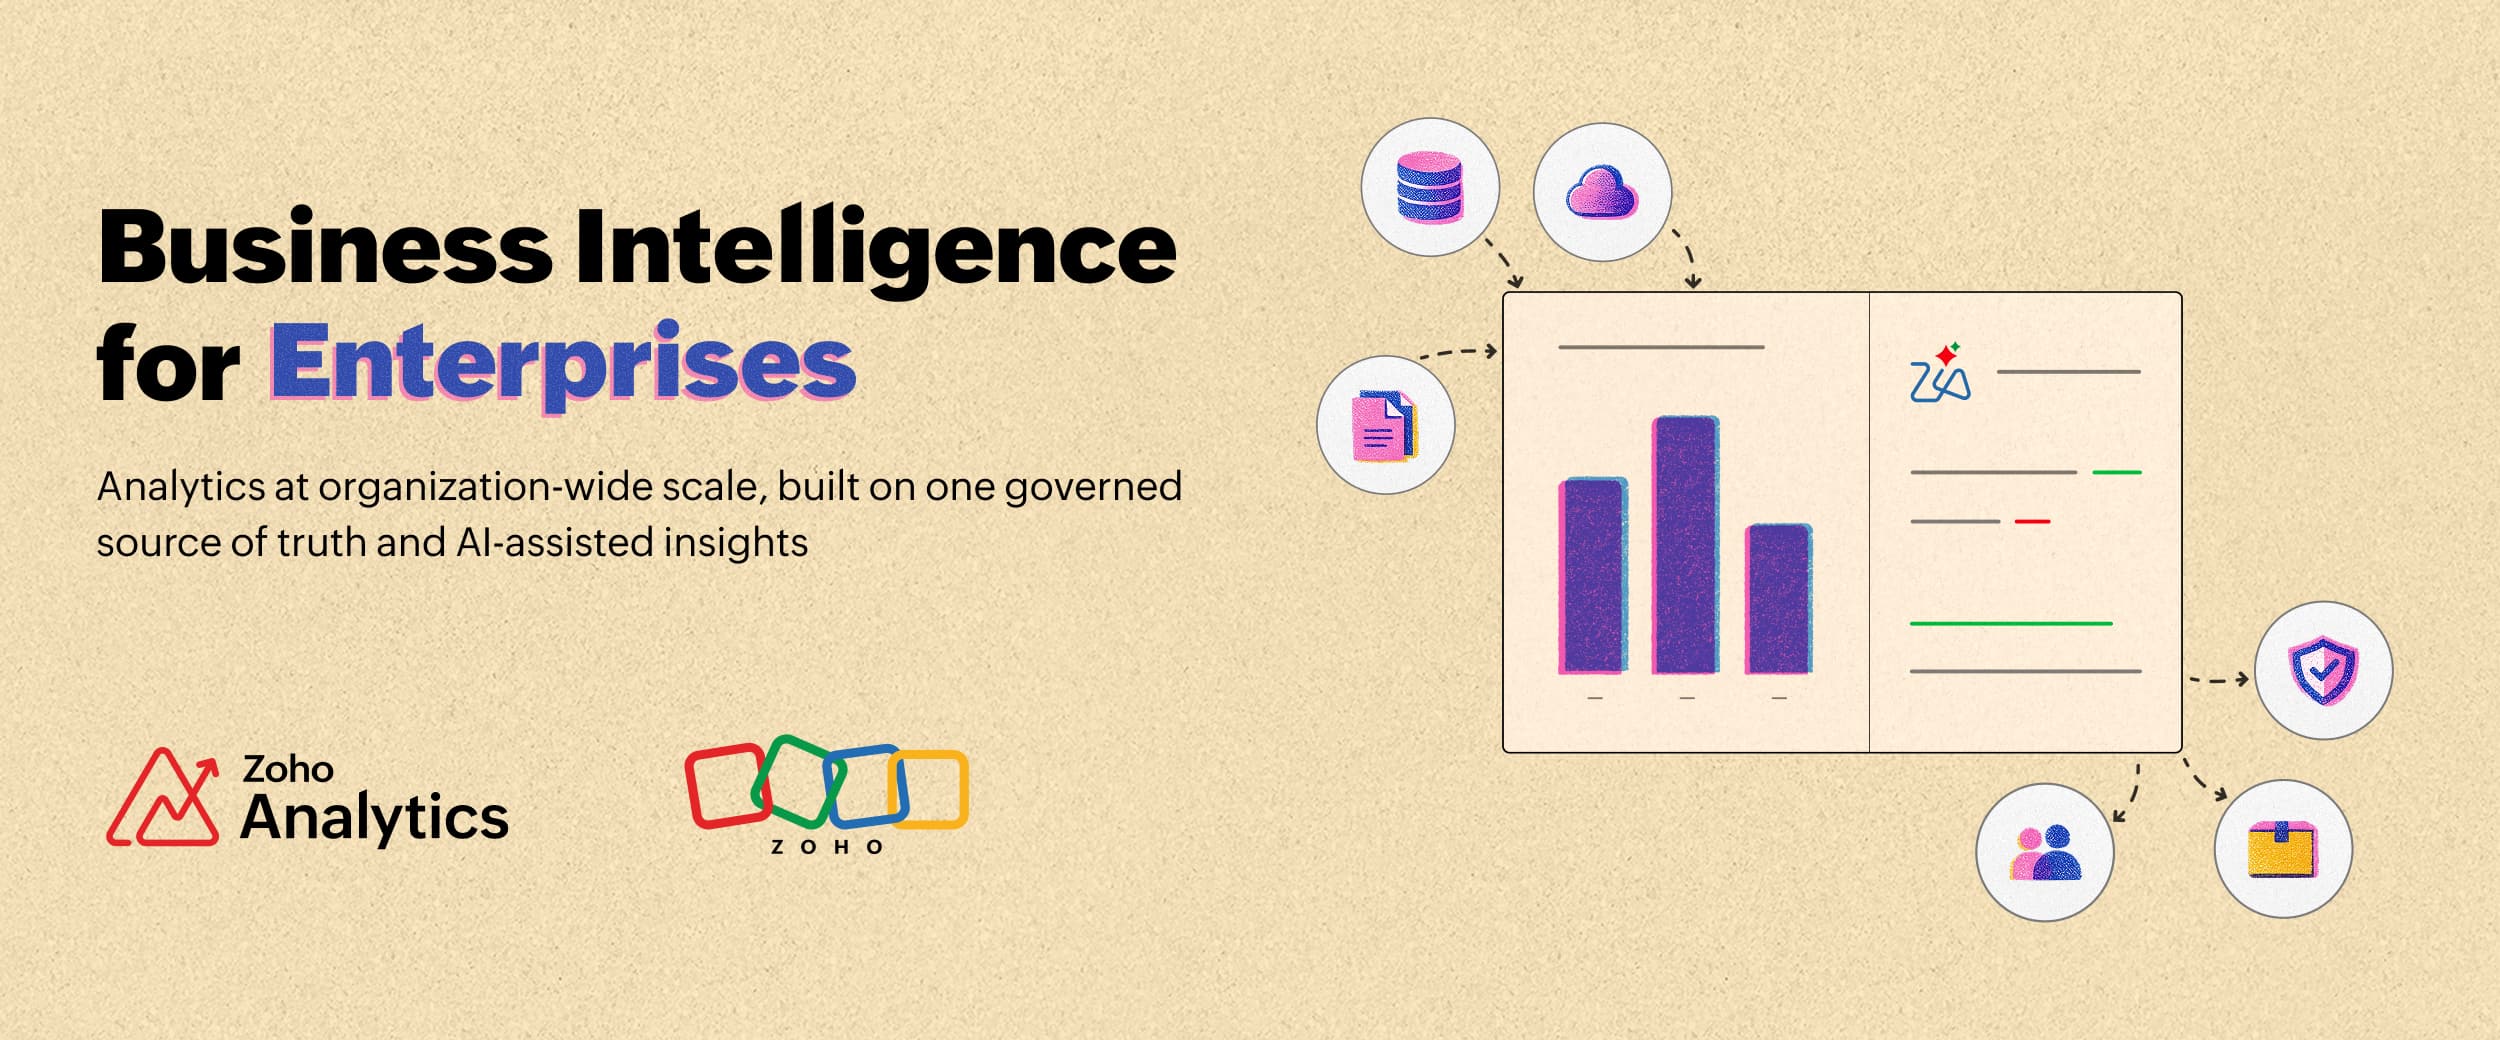
What Is Enterprise Business Intelligence?
Enterprise business intelligence is the practice of collecting, integrating, modeling, and analyzing data from across an organization to support decision-making at every level. Data from operational systems, cloud applications, databases, and other business sources is brought together into a governed environment, where reports, dashboards, and self-service analytics are delivered to both business and technical users.
What distinguishes enterprise BI from traditional BI is its scale. A departmental reporting solution may support a single team with its own dashboards and metrics. An enterprise BI platform, by contrast, must provide consistent reporting across finance, sales, operations, HR, and other business functions, often serving thousands of users simultaneously. That requires shared business definitions, centralized data pipelines, semantic modeling, role-based security, and governance controls that maintain consistency as the organization grows.
Enterprise adoption continues to expand as organizations generate larger volumes of operational data and place greater emphasis on data-driven decision-making. According to Grand View Research, the global business intelligence software market was valued at approximately USD 40.1 billion in 2025 and is projected to reach USD 81.5 billion by 2033, representing a compound annual growth rate (CAGR) of 9.3%.
Enterprise BI vs. traditional BI at a glance
| Dimension | Traditional / Departmental BI | Enterprise BI |
| Scope | Supports a single team, department, or business function | Supports the entire organization across multiple departments |
| Data sources | Connects to a limited number of systems, often with manual preparation | Integrates data from multiple operational systems through centralized pipelines |
| Source of truth | Metrics are maintained separately by individual teams | Uses a single governed source of truth across the organization |
| Metric definitions | Business metrics are defined independently for each report | Shared metric definitions are managed through a semantic layer |
| Governance | Basic permissions with limited governance | Role-based access, auditing, compliance, and centralized governance |
| Users | Primarily analysts and power users | Analysts, executives, managers, and self-service business users |
| Scalability | Best suited to smaller datasets and user groups | Designed to scale across large data volumes, departments, and thousands of users |
| Decision-making | Optimizes decisions within individual teams | Enables consistent decision-making across the organization |
How Does Enterprise BI Work?
Enterprise BI brings data from across the organization through a governed analytical process. Source data is connected and prepared, business definitions are standardized, and the resulting information is made available through reports, dashboards, and self-service analysis. The exact architecture varies by organization, but most enterprise BI environments include the following layers.
Data Integration
Data enters the BI environment from business applications, databases, cloud services, files, APIs, and other operational systems. Connectors and data pipelines automate much of this collection and preparation, reducing the dependence on manual exports and separately maintained datasets.
Data Storage
Depending on the architecture, consolidated data may be stored in a data warehouse, data lake, or similar analytical repository. Some BI environments also query source systems directly. The objective is to give users reliable access to data at the volume and speed required for enterprise reporting.
Data Modeling and the Semantic Layer
Raw data needs a consistent business meaning before it can be used across departments. The semantic layer defines metrics, dimensions, relationships, and calculation logic so concepts such as revenue, customer acquisition cost, or active customers are calculated consistently wherever they appear.
Analysis and Visualization
Once the data is prepared and modeled, users can work with it through dashboards, reports, visualizations, and ad hoc analysis. Business users interact with familiar metrics and dimensions rather than having to understand the underlying database structure.
Distribution and Governance
Enterprise BI also controls how analytical information reaches different users. Reports can be shared, scheduled, or embedded into other applications, while role-based permissions determine who can access specific data. Audit trails, lineage, and governance controls help administrators understand where data came from, how it is used, and who has access to it.
AI and Augmented Analytics
AI increasingly sits on top of the governed analytical layer. Natural-language querying allows users to ask questions without writing SQL, while capabilities such as automated insight generation, anomaly detection, and forecasting can help surface patterns that might otherwise require manual analysis. Agentic AI empowers all kinds of BI users to move faster from insights to action (Know more about AI in business intelligence).
Core Characteristics of Business Intelligence for Enterprise
The architecture explains how enterprise BI works. The next question is what a BI platform needs to support that model at enterprise scale.
Enterprise BI has to work across departments, data sources, and user groups without allowing reporting logic, metric definitions, or access controls to fragment along the way. That places different demands on the platform than a BI tool used by a single team.
Scalability
An enterprise BI environment needs to accommodate growing data volumes, more complex workloads, and large numbers of users without requiring the reporting architecture to be rebuilt as adoption expands. Performance under concurrent usage matters as much as the size of the underlying dataset.
A Governed Source of Truth
Teams should be able to work from a common, trusted data foundation rather than maintaining separate extracts and versions of the same information. Centralized governance helps prevent different departments from reaching conflicting answers because they are working from different datasets.
Consistent Business Definitions
A semantic layer gives business terms a shared meaning across the organization. Metrics, dimensions, relationships, and calculation logic are defined centrally so that a measure such as revenue or customer retention is calculated consistently across dashboards and departments.
Broad Data Connectivity
Enterprise data rarely lives in one system. A BI platform needs to connect with databases, data warehouses, cloud applications, files, APIs, and other operational sources so information from different functions can be analyzed together.
Governance and Security
Access needs to reflect the organization's existing roles and responsibilities. Role-based permissions, auditing, encryption, and appropriate governance controls help protect sensitive information while still making data available to the people who need it.
Self-Service Analytics
Enterprise BI should not turn the central analytics team into a report-request queue. Business users need tools to explore data, create reports, apply filters, and answer routine questions independently while continuing to work within governed datasets and metric definitions.
Flexible Distribution and Embedding
Insights need to reach users where work happens. Reports and dashboards may be shared directly, delivered on a schedule, or embedded within business applications and internal portals, with access controls preserved across each delivery method (Know more about embedded analytics platforms).
AI-Assisted Analysis
Modern enterprise BI increasingly uses AI to make analysis accessible to a wider group of users. Natural-language querying, automated insight discovery, anomaly detection, and forecasting can help users investigate data without requiring them to write queries or manually inspect every dashboard.
Advantages of Using Enterprise BI
Enterprise BI capabilities matter because they change how people across the organization access, interpret, and act on data. When integration, governance, shared business definitions, and self-service analysis work together, the benefits extend beyond the BI environment itself.
The value of enterprise BI comes from creating consistency at scale. Teams spend less time reconciling reports, analysts spend less time answering routine requests, and decision-makers can work from a more consistent view of business performance.
Faster, More Confident Decisions
Standardized metrics reduce the time spent determining which report or calculation is correct before a decision can be made. That matters when trust in organizational data remains an issue. According to the 2025 Data Integrity Trends and Insights Report from Precisely and Drexel University, 67% of organizations say they do not completely trust the data used for decision-making, compared with 55% a year earlier.
Fewer Data Silos
Enterprise BI brings information from different business systems into a common analytical environment, making it easier to examine relationships across departments rather than analyzing each function in isolation. The problem remains widespread: 68% of organizations identified data silos as a leading data management challenge in DATAVERSITY's 2024 Trends in Data Management survey.
More Capacity for IT and Analytics Teams
When governed self-service analytics platforms allow business users to answer routine questions independently, analysts spend less time producing recurring reports or responding to basic data requests. Their time can instead go toward data quality, modeling, advanced analysis, and more complex business questions.
Centralized Governance and Access Control
Enterprise BI provides a common framework for managing permissions, auditing data access, and applying governance policies across reporting environments. This is particularly important when sensitive information is being used by multiple departments, regions, and user roles.
Room to Scale
A well-designed enterprise BI environment can accommodate additional users, data sources, and analytical workloads as the organization grows. Teams can extend the reporting environment without creating a separate BI stack for every new department or use case.
Better Visibility Into Business Performance
Bringing governed data together gives decision-makers a more complete view of performance across functions. Instead of comparing independently maintained reports, teams can examine revenue, costs, operations, and other business measures using consistent definitions and use that evidence to inform planning and resource decisions.
How to Implement Enterprise BI: A Step-by-Step Framework
Enterprise BI is not simply a platform rollout; the data model, governance structure, and adoption plan have to be established alongside the technology.
A phased implementation helps organizations validate data, business definitions, and access controls before BI expands across departments. The following framework moves from defining the business need to building the data foundation, rolling out analytics, and improving the environment over time.
Step 1: Define the Business Objectives
Start with the decisions the BI environment needs to support rather than the dashboards you want to build. Identify the business questions each function needs answered, the KPIs used to answer them, and who is responsible for those measures. This gives the implementation a defined scope and provides a basis for measuring adoption later.
Step 2: Audit the Data Sources
Inventory the systems that contain the required data and assess their quality, ownership, structure, and refresh requirements. This is also the point to identify duplicate records, inconsistent fields, missing data, and systems that will require additional integration work.
Step 3: Choose the Data Architecture
Decide how data will reach the analytical environment and where it will be processed or stored. Depending on the organization's requirements, this may involve a data warehouse, data lake, direct connections to source systems, or a hybrid architecture. Refresh frequency and expected data volumes should be considered at this stage as well.
Step 4: Select the BI Platform
Evaluate platforms against the requirements established in the earlier steps. Data connectivity, governance, security, scalability, semantic modeling, self-service capabilities, and administration should carry more weight than the quality of a demonstration dashboard.
Step 5: Establish Governance and Ownership
Define who owns important datasets and metrics, who can access sensitive information, and who approves changes to shared definitions. Role-based permissions, security policies, auditing requirements, and governance responsibilities should be established before access expands across the organization.
Step 6: Build the Semantic Layer
Translate raw data structures into business definitions that users understand. Define metrics, dimensions, relationships, hierarchies, and calculation logic centrally so that reports across departments use the same interpretation of important business measures.
Step 7: Start With High-Priority Reports
Rather than attempting to recreate every existing report, begin with dashboards and reports tied to the highest-priority business decisions. Validate the underlying data and metric definitions with the people who will actually use them before expanding the reporting catalogue.
Step 8: Roll Out by User Group
Enterprise adoption rarely happens through access alone. Introduce the platform by function or use case, with training based on what each group needs to accomplish. Documentation, examples, and designated BI champions can help users become comfortable with self-service analysis without relying on the analytics team for every question.
Step 9: Measure and Expand
Track usage, query performance, report adoption, data quality issues, and recurring support requests after launch. Those signals help identify where users are struggling and where the BI environment should expand next. New data sources, dashboards, and user groups can then be introduced in controlled stages rather than through another large implementation project.
Use Cases of Business Intelligence Tools in Enterprises
Enterprise BI becomes useful when shared data is applied to decisions owned by individual teams. Finance may use the same underlying data to plan budgets that executives use to monitor performance, while operations and sales interpret it through metrics specific to their work. Common use cases span both business functions and industries.
By Business Function
- Finance teams use BI for budgeting, forecasting, variance analysis, cash flow monitoring, and consolidated reporting across business units. Instead of reconciling separate spreadsheets, teams can trace changes in financial performance back to the underlying departments, products, or regions.
- Sales leaders track pipeline coverage, quota attainment, win rates, forecasts, and territory performance. Combining CRM activity with historical sales data also helps managers identify where deals are slowing and where forecasts may need attention.
- Marketing teams compare campaign performance, acquisition channels, spend, and pipeline contribution in one environment. Connecting marketing and sales data makes it easier to see which activities generate leads and which ultimately contribute to revenue.
- Operations teams monitor inventory, fulfilment, supplier performance, capacity, and process efficiency. BI can help surface bottlenecks or changes in demand early enough for teams to adjust purchasing, production, or distribution plans.
- Human resources teams analyse headcount, hiring, attrition, compensation, and other workforce measures across departments and locations. Role-based access becomes particularly important because workforce reporting often contains sensitive employee information.
- Customer support leaders use BI to monitor ticket volumes, response and resolution times, recurring issue categories, and customer satisfaction. Combining support information with product or customer data can also help identify which accounts or issues require attention.
- Executive leadership use cross-functional dashboards to monitor financial, commercial, operational, and workforce performance together. The value is not simply putting more KPIs on one screen, but giving leadership a consistent view built from the same governed definitions used by individual departments.
By Industry
- Retailers use BI to analyse demand, inventory, basket composition, customer behaviour, and performance across stores and digital channels. These insights inform decisions ranging from replenishment to promotions and product assortment.
- Financial institutions apply BI to risk monitoring, transaction analysis, regulatory reporting, and fraud investigation. Governance, auditability, and granular access controls are especially important when analytical environments contain regulated or sensitive financial information.
- Healthcare organizations use BI to monitor operational performance, patient outcomes, capacity, and resource utilization. Different clinical and administrative roles can work from shared data while access controls restrict sensitive information appropriately.
- Manufacturers combine production, quality, inventory, and supply chain data to monitor throughput, identify defects, track downtime, and assess supplier performance. Bringing these measures together helps teams understand whether a production issue originates on the factory floor or elsewhere in the supply chain.
How to Choose an Enterprise BI Platform
Different use cases place different demands on a BI platform, but they rely on the same underlying requirements: reliable data integration, governance, scalability, and accessible analysis. Those requirements provide a practical framework for evaluating vendors.
Choosing an enterprise BI platform is therefore less about finding the product with the longest feature list and more about understanding how well it fits your data environment, governance model, users, and expected scale. A platform that works well for one department may become difficult to manage when it has to support multiple business units, thousands of users, and a growing number of data sources.
Data Integration
Start with the systems the platform needs to connect to today, then consider what may be added later. Native connectivity to databases, data warehouses, cloud applications, files, APIs, and other business systems reduces the amount of custom integration work required as the BI environment expands.
Scalability and Performance
Evaluate performance against realistic data volumes and concurrent usage rather than a demonstration dataset. Enterprise BI needs to remain responsive as more users, reports, data sources, and analytical workloads are added.
Governance and Security
Look at how permissions, sensitive data, and administrative controls are managed across the platform. Role-based access, auditing, encryption, data lineage, and appropriate compliance controls should work across departments without requiring separate governance processes for each reporting environment.
Semantic Modeling
A semantic layer helps prevent different teams from creating their own versions of important business metrics. Check whether definitions, calculations, dimensions, and relationships can be managed centrally and reused consistently across reports and dashboards.
Self-Service Analytics
Business users should be able to explore governed data and answer routine questions without depending on analysts for every report. Evaluate self-service tools with the people who will actually use them, not only with the technical team responsible for implementation.
AI-Assisted Analysis
Natural-language querying, automated insights, anomaly detection, and forecasting can make analysis accessible to a wider group of users. Evaluate how these capabilities work with governed business definitions and what controls exist over the data and context used to generate answers.
Sharing and Embedding
Analytics needs to reach users beyond the BI platform itself. Check whether reports and dashboards can be scheduled, shared securely, or embedded into portals and business applications while preserving the appropriate access controls.
Deployment Flexibility
Enterprise infrastructure and compliance requirements vary. Determine whether the platform supports the cloud, on-premises, or hybrid deployment model your organization requires, and whether capabilities differ between deployment options (Here's a comparison guide between cloud BI and on-premise BI).
Total Cost of Ownership
Licence price is only one part of the cost. Include implementation, infrastructure, integration work, administration, training, support, and ongoing maintenance when comparing platforms. Model these costs against the number of users and data volumes you expect to support over several years rather than evaluating only the initial deployment. (Here's a short guide about choosing the right BI tool)
Zoho Analytics addresses these requirements through broad data connectivity (find its list of featured connectors here), centralized data modeling, governance and security controls, self-service and AI-assisted analytics, embedding capabilities, and multiple deployment options. Organizations evaluating it for enterprise use should assess those capabilities against their own architecture, governance requirements, expected user base, and long-term cost model (Get started with exploring Zoho Analytics' pricing here).
Enterprise business intelligence: real-life case study
AQUAGROUP has been a pioneer in the field of motors and pumps, available and serviced through a wide network of over 1,400 exclusive dealers nationwide. AQUAGROUP's IT team manages 1,300 client systems that are connected to their data center. They were looking to deploy a robust analytics solution that caters to their diverse operational needs.
"We were on the lookout for an analytics tool to streamline daily operations, with a goal of accessibility to reports across the organization. Although Power BI showed potential, the need to enable it on every client system in our on-premises environment was a significant challenge. After exploring alternatives like Tableau and other free tools, we ultimately chose Zoho Analytics for the ease of its on-premises deployment.
Zoho Analytics seamlessly generated reports and dashboards that are embedded within our ERP system, offering robust functions that democratized access to insights across our organization. It became a crucial tool that provided tailored reports and dashboards. The support team played a pivotal role in ensuring a smooth experience for us, too. Their customer-centric approach showcased their reliability and commitment to resolving issues."
- Ravi Kumar Subramaniam, Head of Finance and IT Operations, AQUAGROUP
Read their detailed customer success-story.
Conclusion
Enterprise BI works when data from across the organization is governed by the same definitions, access rules, and reporting logic. Getting there requires more than connecting data sources and building dashboards. Integration, semantic modeling, governance, and adoption all need to work together so teams can spend less time reconciling numbers and more time using them.
The right BI platform should support that model as data volumes, users, and reporting requirements grow. Zoho Analytics brings data integration, centralized modeling, governance, self-service analytics, and AI-assisted analysis into one environment, with cloud, on-premises, and hybrid deployment options for different enterprise requirements.
Bring your enterprise data together and give teams a consistent foundation for analysis and decision-making.
[Get Started with Zoho Analytics]
Commonly Asked Questions on Enterprise BI
What is enterprise business intelligence in simple terms?
Enterprise business intelligence (enterprise BI) brings data from across an organization into one governed environment where teams can access consistent reports, dashboards, and analytics. Instead of each department working from separate datasets and definitions, everyone makes decisions using the same trusted business metrics.
What is a semantic layer in enterprise BI?
A semantic layer is a business-friendly layer that sits between raw data and analytics. It defines metrics, dimensions, and relationships once so every report and dashboard uses the same calculation logic. This keeps business measures such as revenue, profit, or customer retention consistent across the organization.
What is the difference between enterprise BI and traditional BI?
Traditional BI is typically designed for a single department and a limited number of data sources. Enterprise BI supports the entire organization by integrating data from multiple systems, applying centralized governance, standardizing business definitions through a semantic layer, and providing secure access for different user groups.
What are examples of enterprise BI tools?
Enterprise BI platforms include solutions such as Zoho Analytics, Microsoft Power BI, Tableau, Qlik, and Sisense. While their capabilities differ, enterprise BI platforms generally provide broad data connectivity, governance, semantic modeling, self-service analytics, and AI-assisted insights.
How do you implement enterprise BI?
Enterprise BI implementation typically begins with defining business objectives and KPIs, followed by auditing data sources, selecting a data architecture and BI platform, establishing governance, building a semantic layer, and developing priority dashboards. Organizations then expand adoption through training, ongoing monitoring, and continuous improvement.
What are the common use cases of enterprise BI?
Enterprise BI supports decision-making across finance, sales, marketing, operations, human resources, customer support, and executive leadership. Industry-specific applications include demand forecasting in retail, risk monitoring in financial services, operational reporting in healthcare, and production analysis in manufacturing.
Which BI platform is best for enterprise organizations?
The right platform depends on your data environment, governance requirements, user base, deployment preferences, and long-term scalability needs. Look for broad data integration, centralized governance, semantic modeling, self-service analytics, AI capabilities, and flexible deployment options. Zoho Analytics is one platform designed to support these enterprise requirements across cloud, on-premises, and hybrid environments.
 Ezra
EzraA storyteller with a passion for exploring and discussing everything related to data.