What is a KPI Dashboard? Examples, Templates, and Benefits

Effective decisions can be made using insights from data. But what are all the different data sources you refer to when you want to make decisions for your business? The more data sources you have, the more time it consumes and the less efficient the decisions are.
As someone who’s in a position to make important decisions, you need to stay on top of your organization’s performance. But we also understand how difficult it is to track multiple key metrics for an organization, as these metrics are often spread across different data sources.
That’s where KPI dashboards come in handy.

KPI dashboards are important for businesses of all sizes. Here are the fundamentals you need to know to get started with KPI dashboards:
- What are KPIs and why do they matter?
- What is a KPI dashboard?
- Top KPI dashboard examples
- What are the benefits of a KPI dashboard?
- How to create a KPI dashboard
- Best practices for creating KPI dashboards
- Common mistakes to avoid
What are KPIs and why do they matter?
KPIs are measurable values that indicate progress toward your goals. A KPI can be measured in terms of quality and quantity. For example, your organization’s sales and order amounts are quantitative KPIs, and product reviews and customer satisfaction rates can be qualitative KPIs.
With KPIs, you can figure out whether your business is progressing as expected, predict problems earlier, and make the right decisions at the right time.
What is a KPI dashboard?
KPI dashboards are a collection of key performance indicators (KPIs) in one place, giving you a bird’s-eye view of your business performance. With a KPI dashboard, you can compare and analyze all your KPIs in one place, identify where you are on your goals, and make decisions to achieve those goals.
Top KPI dashboard examples
A KPI dashboard will vary by business type and industry, based on the metrics they want to track. There’s no one-size-fits-all KPI dashboard template—every business has its own set of requirements, and the dashboard needs to be built in a way that helps them track their progress easily.
Here are some popular KPI dashboard examples for different industries:
Executive KPI dashboard
An executive KPI dashboard is mostly accessed by the management or leadership team. They need to track the critical KPIs of the company without spending much time, and take action based on trends.
Here’s a KPI dashboard example for the CEO of a software or SaaS company. We’ve blended data from Zoho CRM, Zoho Books, and Zoho Desk for this KPI dashboard. However, you’re not limited to only Zoho apps—you can choose to blend data from any of your preferred data sources.

(Click here to view an interactive version of this dashboard)
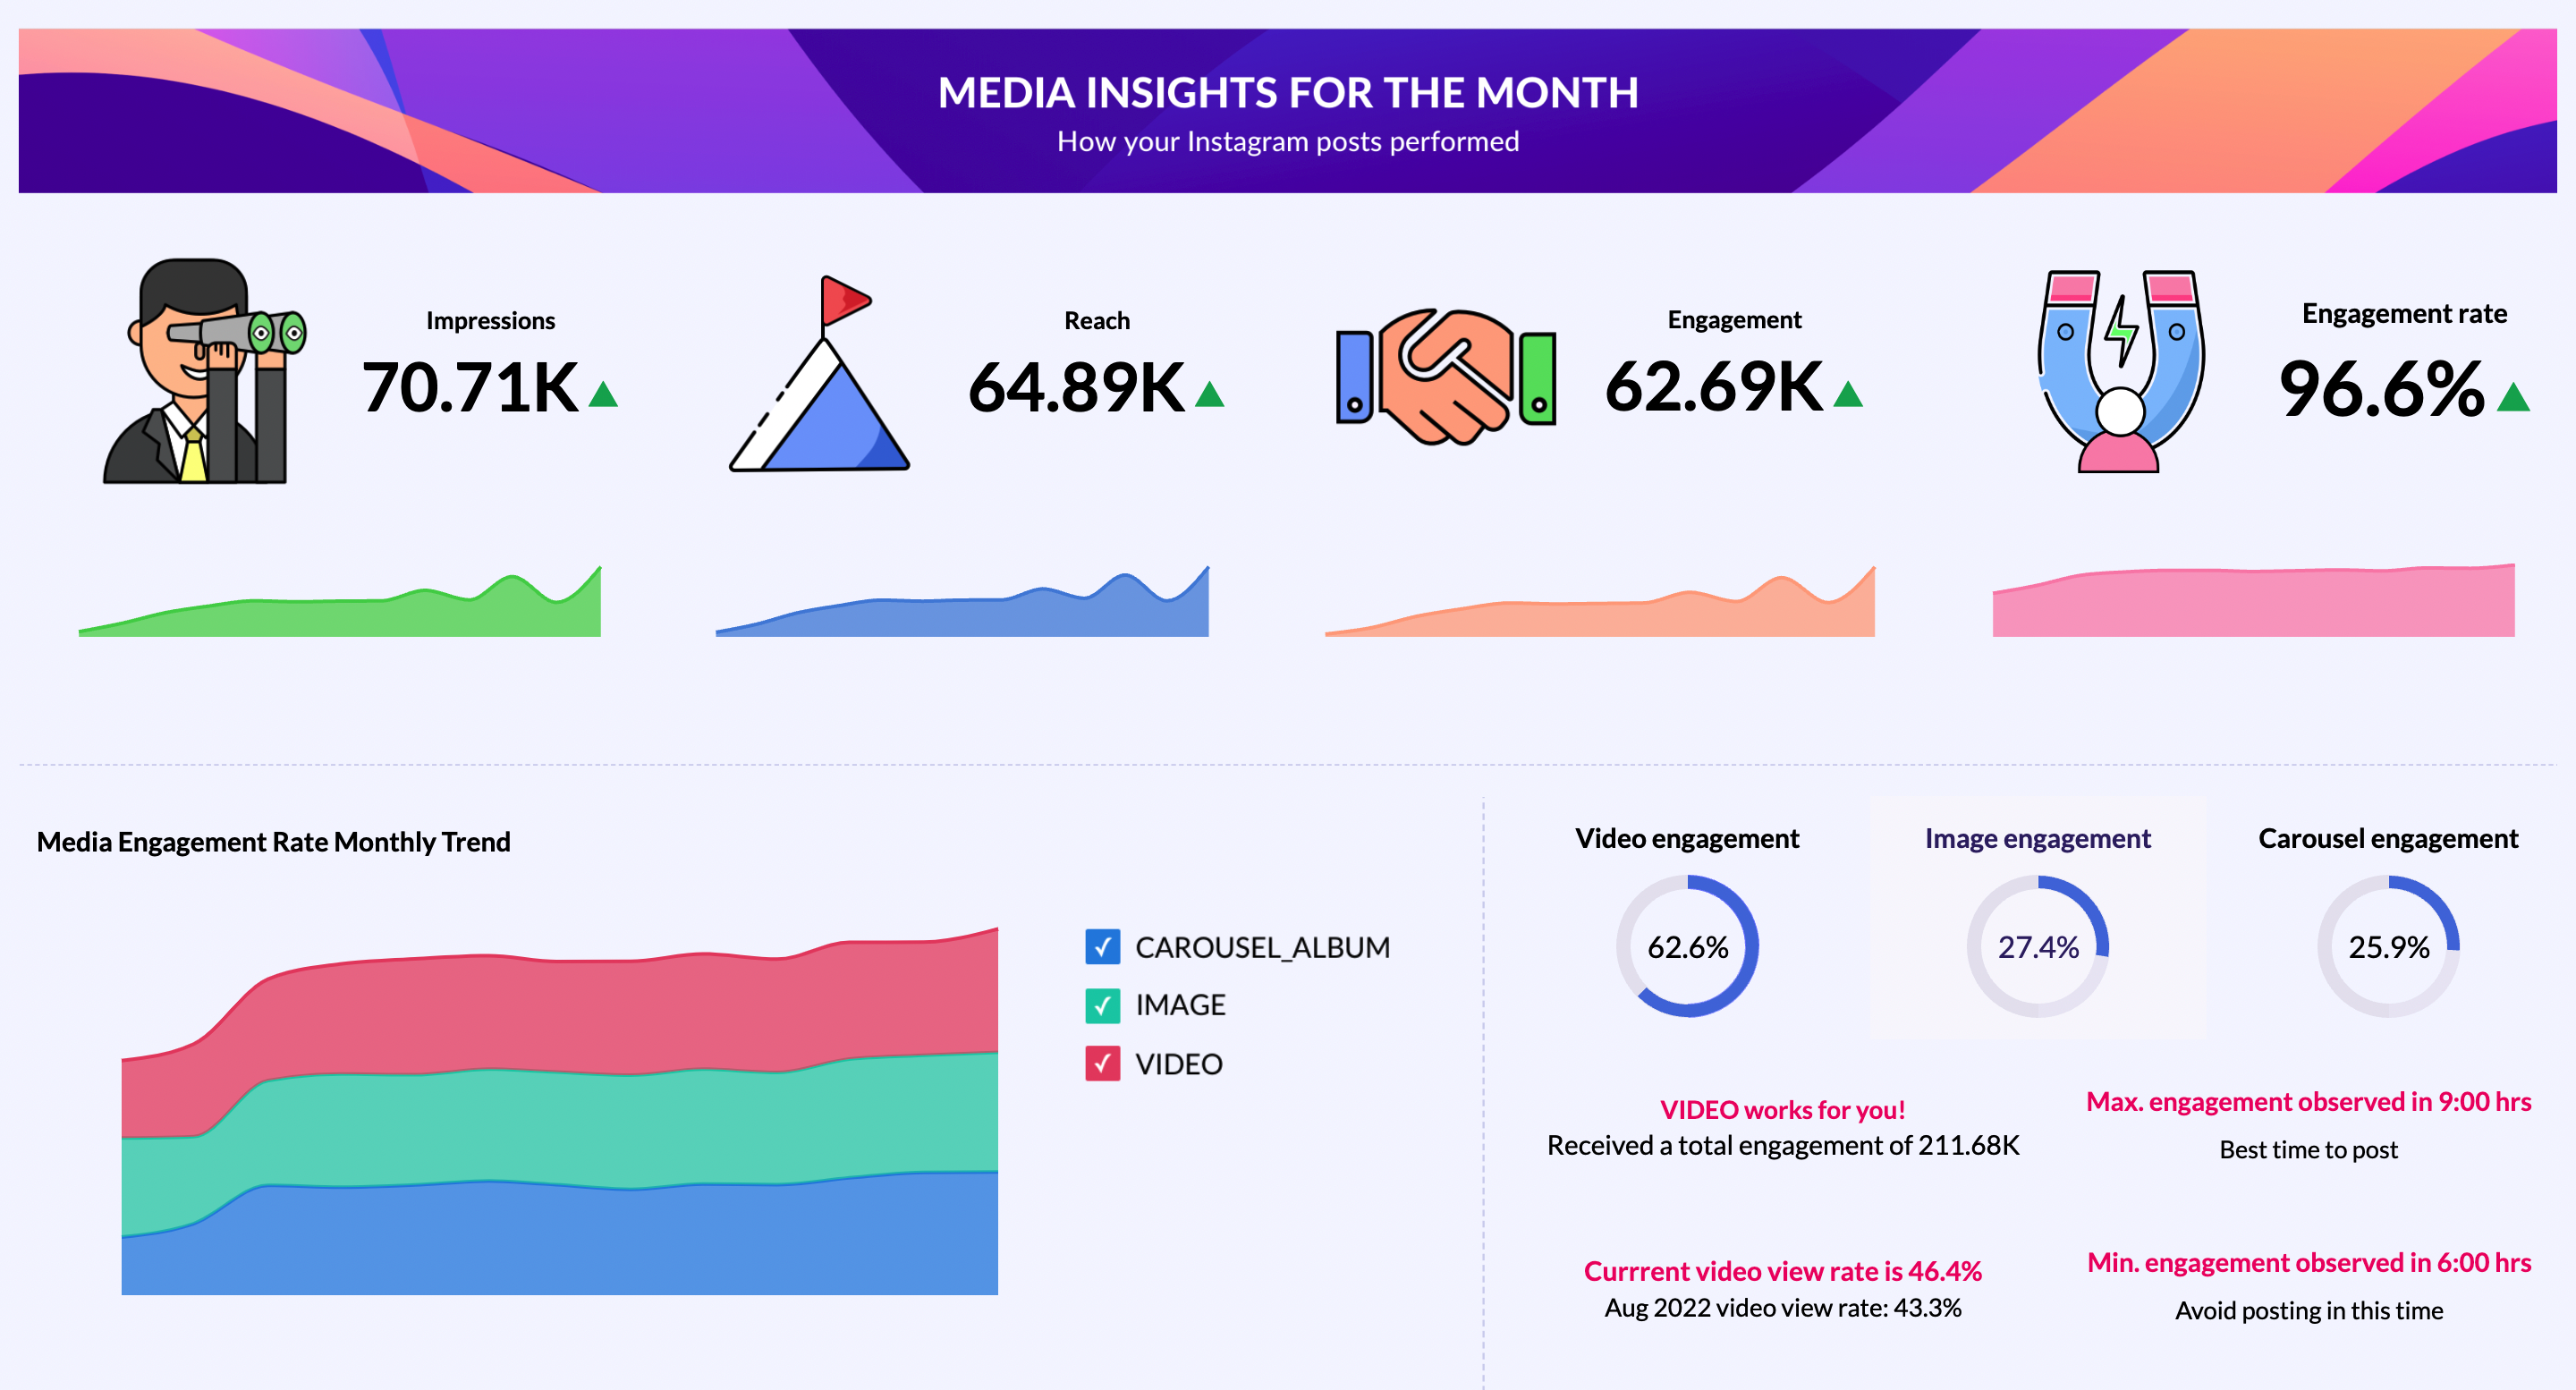
Social media KPI dashboard
Social media managers and agencies can make use of social media KPI dashboards, allowing them to track all their key metrics in one place. You can also easily share this dashboard with your managers and clients.
Here’s an Instagram KPI dashboard example:
(Click here to view an interactive version of this dashboard)
What are the benefits of a KPI dashboard?
Businesses that track KPIs reap a lot of benefits. With a well-designed KPI dashboard that is both visually appealing and relevant, you can:
- Access all metrics in one place: As you’ve seen in the dashboard examples above, you get all your relevant KPIs in a single view. You don’t have to juggle between different data sources anymore.
- Get insights from data in real time: The data in KPI dashboards gets updated in real time, so you get insights instantly. In addition, you can set data alerts for critical KPIs and get notifications on changes, at any time, from anywhere.
- Uncover trends and outliers: Identifying trends can help businesses with new ideas and opportunities. Thanks to data visualization, you can now unearth patterns in data, spot trends from KPIs, and remove outliers easily.
- Predict problems early: Businesses that employ data analytics software are forecasting their growth and performance with the help of artificial intelligence. With AI forecasting, you can spot problems that may arise in the future.
- Make better decisions: With insights and predictions gathered from business data, you can make timely decisions, devise or revisit strategies, and improve business performance.
How to create a KPI dashboard
To create an advanced KPI dashboard, you’ll have to use a modern BI app like Zoho Analytics.
Here’s how to create a KPI dashboard using Zoho Analytics:
- Sign up with Zoho Analytics.
- Import data from your preferred data source. A set of reports and dashboards will be automatically generated.
- Click the +Create button at the top-left corner and select Dashboard.
- Drag and drop the required KPIs from the left pane.
- Click the Widget button to add a custom widget. You can add as many widgets as you need.
- Add a title to the dashboard and save it.
Best practices for creating KPI dashboards
It might take some time to get the hang of KPI dashboards. That’s why we’ve put together a few tips to ease your learning process and help you get started:
- Keep it simple and select KPIs based only on your goals: The prime goal of creating a KPI dashboard is to access all relevant information in one place, and your dashboard design should not hamper that. Try to make the dashboard as simple as possible and pick only the critical KPIs.
- Ensure your data is clean and accurate: No matter how beautiful your dashboard is, it’s of no use if your data isn’t accurate and you can’t extract insights from it. That’s why you need to prepare your data and cleanse it, to ensure it’s accurate.
- Pick appropriate visualizations: While creating reports and KPI widgets, select the best chart or widget type to visualize your data. You can also refer to our chart picker guide to learn how to choose the appropriate visualizations for your reports.
- Use data storytelling: With your KPI dashboard, try to tell a story with data insights and guide the audience along. Break down complex data analysis into a simple narrative so that everyone can understand exactly what is happening.
- Avoid widgets that don’t add value: BI solutions offer a variety of widgets that solve different use cases. Just because you have multiple widget options doesn’t mean you have to use all of them. Keep only the widgets that add value to your data analysis.
Common mistakes to avoid
KPI dashboards are powerful and offer meaningful insights from data to make better decisions. When designed wrong, these dashboards can burn your valuable time and leave you with no meaningful insights to act upon.
Below are some of the mistakes you need to avoid while creating KPI dashboards:
- Selecting incorrect KPIs: If you’re not sure what to measure in regard to your business goals, you’re going to end up with incorrect KPIs on your dashboard. So it’s important to understand the performance and goals of the organization first, before picking the KPIs.
- Cluttering your dashboard with too many KPIs: While designing a KPI dashboard, you may feel the urge to include all the metrics available. This can lead not only to a dashboard cluttered with too many KPIs but also the overlooking of crucial KPIs.
- Choosing incorrect visualization types: Choosing an incorrect type of visualization for a report can lead to misinterpretation of data and missing critical insights. For example, selecting a pie chart when you should choose a geographical chart will only bring about more confusion.
- Arranging KPIs in no logical order: KPIs on a dashboard need to be arranged in a logical order to tell a story. A data story makes it easier for everyone in the organization to understand the business’ performance and issues.
- Not collaborating with the team: Instead of designing the dashboard on your own, it’s better to discuss it with your team and get their input. Including your team in the planning phase will help you identify issues you’ve missed.
Create KPI dashboards and more with Zoho Analytics
Now that you’ve learned what to do, and what not to do, it’s time for you to create your very own KPI dashboard. To create an effective dashboard, you can use a modern BI and analytics solution like Zoho Analytics. With Zoho Analytics, you can import and blend data from 250+ sources, try out multiple data visualizations, access auto-generated reports and dashboards, get accurate insights, and much more.
Sign up with Zoho Analytics for a free 15-day trial and start creating your KPI dashboards today.
You can also reach out to our analytics experts for a free personalized demo.
Have further questions or need clarification? Write to us at support@zohoanalytics.com!


Comments