- HOME
- BI & Analytics
- Build vs Buy a Dashboard Tool: The Right Choice in 2026
Build vs Buy a Dashboard Tool: The Right Choice in 2026
- Last Updated : June 5, 2026
- 145 Views
- 10 Min Read
Your team is making decisions off spreadsheets. Then someone on your teams says, "let's build a dashboard tool." Engineering team says two to three weeks and everyone agrees.
Two months later, the tool is ready and the Salesforce connector is already broken. Marketing numbers stopped updating. One engineer spends half a day every month just keeping it alive. Nobody changes anything because nobody remembers how it was built.
In 2026, building feels easier than ever. Vibe coding a working prototype is possible in hours. APIs are simpler. Good charting libraries are free. It looks cheap and fast.
But you are not just building a dashboard tool. Every time an API changes, someone has to fix it. Every time a manager wants a new number, someone has to add it. Every time the data looks wrong, someone has to dig in.
You should be aware of what does it cost to keep your internally built tool running.
This post covers real cost numbers on building vs buying a dashboard tool and questions you should be asking before making a decision.
What 'building a dashboard tool' actually means: 3 different things
They are not the same, and mixing them up leads to bad decisions.
The first is an internal reporting tool. Your team's sales numbers, support tickets, revenue, all pulled from different tools into one place. This is what most people are asking about. It is the focus of this post.
The second is something your customers see inside your product. Think analytics inside a SaaS app. The cost and the reasoning here are very different.
The third is something built quickly with an AI tool for a quick look at data.
When building a dashboard tool actually makes sense
There are real cases where building is the right call.
If your customers use the dashboard as part of your product, building often makes sense. You need full control over how it looks and works. Most off-the-shelf tools will not give you that without trade-offs. On a side note, modern dashboard tools like Zoho Analytics offer embedded analytics capabilities with full control and customization. You don't need to build your analytics engine from the scratch. You can focus on your core product offering.
If your numbers use a special formula that no other tool can replicate, you may need to build.
If your company has strict rules about where data can go and no outside tool qualifies, building may be your only option.
For everything else (internal reports, team numbers, and weekly summaries), building is usually harder and more expensive than it looks.
The real cost of building a dashboard tool
Most estimates only count the time it takes to build the first version. They leave out everything after.
Here are the numbers for a typical internal dashboard tool that pulls from three to five data sources.
The first version costs between $15,000 and $60,000 in developer time. That assumes two to four weeks of work at around $150 per hour. A simple setup with one or two data sources is on the low end. Add more data sources, user roles, and access controls and you are closer to $60,000. A more complex setup can go past $150,000.
That is the number most teams budget for. Based on what we see from teams that have migrated to Zoho Analytics from custom builds, it is rarely the number they end up spending.
Keeping the tool running costs about 20 to 30 percent of the build cost every year. On a $40,000 build, that is $8,000 to $12,000 per year before anything goes wrong.
APIs break. This is where most of the hidden cost lives. When it does, someone has to fix your tool. SMSI Group, a facility services company that moved from custom Excel-based reporting to Zoho Analytics, found their team was spending four to five hours on data analysis that now takes 15 minutes. That time was not going into their product. It was going into keeping their reporting alive.
Change requests add up too. A manager asks for one new number. That means a developer picks it up, reviews the code, makes the change, and pushes it live. At $150 per hour, even a small change costs $300 to $600. If ten people are asking for changes every few months, that is $15,000 to $30,000 a year in work that nobody budgeted for.
There is also the time your developers are not spending on your actual product. Three months building a reporting tool is three months not shipping features. That cost does not show up anywhere, but it is real.
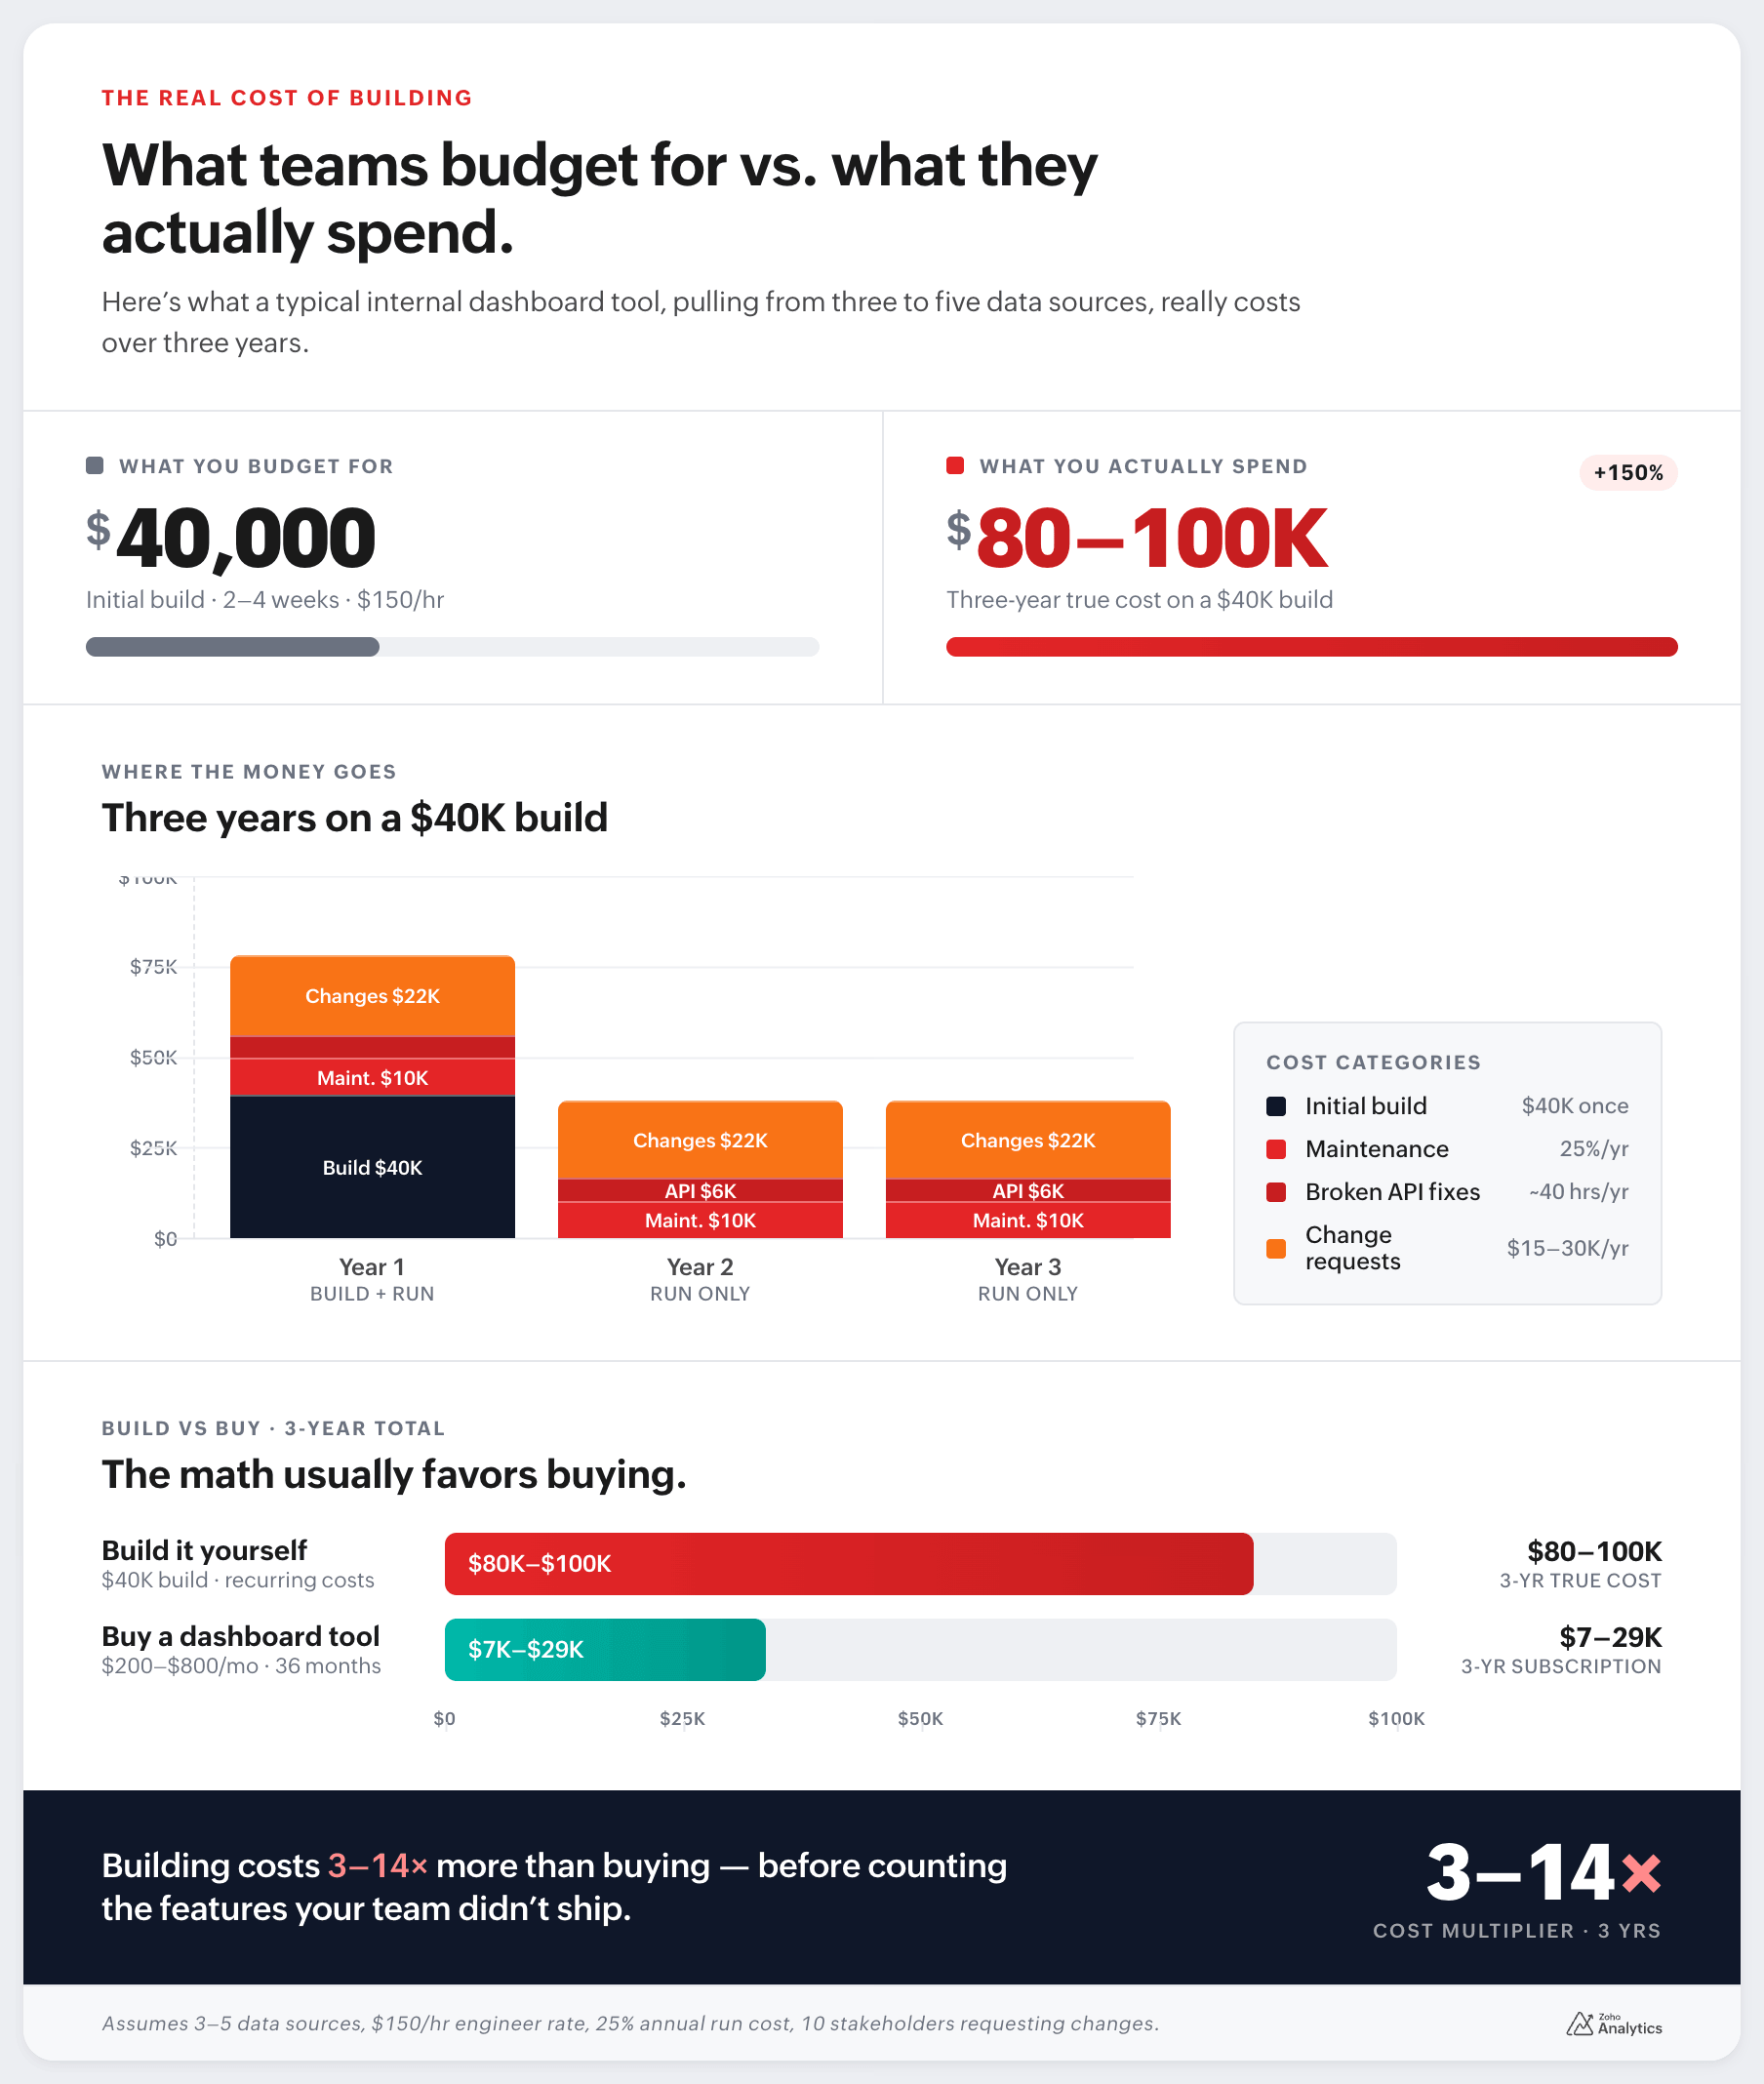
Add it all up over three years and a $40,000 build often ends up costing $80,000 to $100,000. A good dashboard software product costs $200 to $800 per month for most teams.
Using AI to build a dashboard tool
AI tools can help a developer build a working dashboard tool in a week or two. That used to take months. For exploring data or testing ideas, leveraging AI is useful and fine.
The problems come when that AI-built tool goes into daily use.
The numbers can be wrong and nobody knows it. AI writes code that produces a number. But that number might be calculated from the wrong column, filtered the wrong way, or added up incorrectly. The problem is it's difficult to connect the numbers to the dataset. You'll only find out when someone catches the error.
Access control usually does not work right. Setting up proper rules about who can see what is complicated. You only find out when someone sees data they should not.
Changes get harder over time. The first version is quick. But when a manager asks for something different, the code needs editing. If the original developer is gone or has forgotten how it works, even a small change can break things.
If the data stops updating or something breaks one day, there is no one to fix it.
AI is useful for a quick prototype. For something people rely on every day, you need something more solid.
Security is usually an afterthought
Your dashboard tool connects to important systems. Sales data, financial records, support history, operations data etc. The connection usually goes through an API.
When that is built quickly, security gets skipped. API keys end up stored in the wrong place. Permissions are set too broadly. Nobody sets up a log of who accessed what. AI-built tools are especially prone to this because speed is the whole point.
You do not notice until the dashboard is being used by dozens of people or until a security audit catches something.
A proper dashboard software tool handles login security, access control, and activity logs by default. Getting that right in a custom build takes weeks and is often still incomplete.
Five questions to ask before you decide
- Is this dashboard tool part of what your customers pay for? If yes, building may make sense. If it is internal, buy.
- Does your data need a special calculation no other tool can do? Most teams say yes before they check. Try building the formula in a modern tool first. It usually works.
- Do you have a developer who can maintain this for the next two years? Most teams say yes when planning the build. Ask again after six months.
- How often do your reporting needs change? If people ask for new numbers regularly, a custom build will slow you down. Every change goes through a developer.
- Where does your data need to live? Many BI tools now offer on-site installation or private cloud options. Check what is available before assuming you have to build.
Build vs. buy vs. AI dashboard tool: a quick comparison
| Factor | Build from scratch | AI / quick build | Buy a dashboard tool |
| Time to first dashboard | 2–8 weeks | Days to weeks | Hours |
| Year 1 cost | $40,000–$80,000 | $5,000–$20,000 | $2,400–$9,600 |
| 3-year total cost | $80,000–$120,000 | $30,000–$60,000 | $7,000–$30,000 |
| Maintenance | Your team handles it | Your team handles it | Vendor handles it |
| Data accuracy | You build the checks | Often unreliable | Handled for you |
| Access control | You build it | Usually not done right | Handled for you |
| Non-developer changes | Needs a developer | Needs a developer | Most changes are self-serve |
| Best for | Customer-facing products | Testing ideas | Internal reporting and customer-facing products (through embedded analytics) |
These numbers are estimates based on a mid-size internal tool connecting three to five data sources at $150 per hour developer time.
There is a third option most teams miss
You do not have to choose between building everything or buying a rigid tool.
Buy a BI platform for the core: connecting data, building charts, managing who can see what. Then use the platform's API or formula tools for the parts that are specific to your business.
A finance team uses it for their standard reports. The engineering team pushes their own data into the same platform through the API. Both teams can create dashboards without help from each other. The finance team does not need a developer to change a chart.
Many teams that try building first end up here. So, starting here saves you time and money.
What to look for in a dashboard tool
Five things matter.
- Pre-built connections to your data sources. A good tool should connect to your CRM, your ad platforms, your database, and give you data you can actually use right away.
- Self-serve for your team. If your managers still need to ask a developer for every change, you have not solved the problem.
- AI that gives real answers. Some tools let you type a question and get a chart back. That is useful if it is accurate. Ask about how it handles access rules before you trust it.
- Where your data lives. Check if the tool offers on-site or private cloud options if your company needs it.
- Fast changes on interactive dashboard views. Filters, date ranges, and breakdowns. Your team should be able to change these themselves.
Where Zoho Analytics fits
Zoho Analytics connects to over 500 data sources. For most common setups, you can connect your data and have a working business dashboard in under an hour.
It comes with pre-built dashboards for sales, marketing, finance, HR, and operations. So you are often starting from something useful, not a blank page.
For teams that need custom calculations, Zoho has a formula layer that handles most cases. There is also a visual pipeline builder for transforming data without code. For teams that need something more advanced, Python code transformation is available too. This matters because most teams that think they need to build have custom data needs.
Ask Zia is Zoho's AI layer. You type a question, it shows you a chart, key insights, and recommendations. Your operations manager can get an answer and send it to the team without touching the report settings.
Zoho Analytics runs in the cloud, on your own server, or on AWS and Azure. So if your data needs to stay in-house, there is an option.
It has been recognized in the Gartner Magic Quadrant for Analytics and Business Intelligence Platforms four years in a row, including 2026. The pricing plans grow with your team and do not charge per seat in a way that gets expensive fast.
Teams that have made the switch have seen real results. Zegal, a legal tech company, had their team manually downloading data from multiple sources and combining it in spreadsheets. After switching, they automated the whole process. Their words: "Earlier, reports took us hours to create. With Zoho Analytics, our work gets done faster than ever before." Norman, an Australian business services firm, saved thousands of manual reporting hours per year and removed the need for additional software spend by pulling their CRM, finance, and call data into a single place.
Compare that to a $40,000 build that costs $10,000 a year to keep running. Against $300 to $500 a month for Zoho Analytics, you can easily see the difference.
Build vs buy a dashboard tool: the verdict
For most teams, the answer is buy.
Building is recommended if:
- your dashboard is something customers pay for or interact with as part of your product.
- your data requires a very specific calculation no tool can handle.
Everything else, internal reporting, team metrics, operational views, is something a good BI platform handles faster, cheaper, and with less ongoing work than a custom build.
The three-year cost of a custom build typically runs $80,000 to $100,000 when you include maintenance and change requests. A capable dashboard software product costs a fraction of that. You also get security, access control, and self-service built in, things that take months to get right in a custom build and are often still incomplete.
If you are leaning toward AI to speed up a build, use it to test ideas. Do not run it for your whole team without checking the numbers and setting up proper access controls first.
If you want to see how far you get before committing to anything, Zoho Analytics has a 15-day free trial. Connect your first data source, explore the best dashboard tools on the platform, and build something before you decide.
Frequently asked questions
1. Is it cheaper to build a dashboard tool than to buy one?
In most cases, no. The first version of a custom build looks affordable because teams only count the developer's time to ship it. What they miss is the ongoing cost: keeping integrations running, handling change requests, and the developer time. Buying is almost always cheaper once you look past the first three months.
2. Can I just use AI to build a dashboard tool?
You can use AI to build a working prototype quickly, and that is genuinely useful for testing ideas. The problem is what happens when that tool goes into daily use. AI-built dashboards often have wrong calculations that nobody catches until a bad decision gets made, access control that shows everyone everything, and code that nobody understands well enough to change. For something your team relies on every day, it needs proper data checks, user permissions, and an owner who can maintain it.
3. How much does it cost to build an internal dashboard tool?
A simple internal dashboard tool connecting one or two data sources costs around $15,000 to $25,000 in developer time. A mid-complexity setup with three to five data sources, user roles, and access controls runs $40,000 to $60,000. A more complex build with multiple integrations, custom logic, and proper security infrastructure can go past $150,000. These are just the build costs. If you add 20 to 30 percent of that every year for maintenance, plus $300 to $600 per change request, and the three-year number is typically two to three times the original estimate.
4. How long does it take to build a dashboard tool?
A basic version takes two to four weeks of focused developer time. A version that is actually ready for your whole team to use, with proper logins, access controls, reliable data connections, and the ability to handle change requests, takes two to four months.
 Pradeep V
Pradeep is a product marketer at Zoho Analytics with a deep passion for data and analytics. With over eight years of experience, he has authored insightful content across diverse domains, including BI, data analytics, and more. His hands-on expertise in building dashboards for marketing, sales, and major sporting events like IPL and FIFA adds a data-driven perspective to his writing. He has also contributed guest blogs on LinkedIn, sharing his knowledge with a broader audience. Outside of work, he enjoys reading and exploring new ideas in the marketing world.