Teamwork Desk Advanced Analytics
Zoho Analytics for Teamwork Desk enables you to easily analyze your helpdesk data in Teamwork Desk. With this, you can slice and dice your helpdesk data for analysis and derive key metrics to transform them into actionable business insights.
General
- What is Zoho Analytics?
- Why Teamwork Desk Advanced Analytics connector?
- What are the benefits of using the Teamwork Desk Advanced Analytics over the reporting module in Teamwork Desk?
Setup
- How do I setup the Teamwork Desk Advanced Analytics connector?
- How long should I wait for my Teamwork Desk data to initially appear in Zoho Analytics?
- I received an email which said 'Setup Process Failed'/'Synchronization Process Failed'. What should I do?
- How frequently can I synchronize my data with Zoho Analytics?
- Can I edit the Teamwork Desk connector Synchronization setting?
- Can I perform an ad hoc synchronization from Teamwork Desk?
- What are the modules in Teamwork Desk to create reports?
- Can I set up the Teamwork Desk advanced analytics connector in any other existing workspaces?
- Can I import data from multiple Teamwork Desk Sites? If yes, how?
- How do I remove this integration?
Reporting Features
- How do I create reports using this connector?
- What are the report types supported by Zoho Analytics?
- Can I modify the default reports that have been created by the Zoho Analytics connector? If so, how?
- How do I create reports using fields/columns across different modules?
- What is 'Formula' in Reports?
- What are the default formulas added by Zoho Analytics, on setting up this connector?
- How do I create custom formulas in Zoho Analytics?
- Can I add/modify data in the Teamwork Desk data tables in Zoho Analytics?
- Can I add new columns to the Teamwork Desk data tables in Zoho Analytics?
- Can I add/import new data tables in this workspace to create reports & dashboards?
- Can I combine data from other sources with the data from Teamwork Desk to create reports and dashboards?
- Can I join data from multiple data tables to create reports?
- What are Query Tables?
Cross-Functional Analytics with Business Applications
- What are the popular business applications that I can integrate Teamwork Desk with?
- How can I analyze the data from the business applications along with Teamwork Desk?
- Will a relationship (lookup) be created between Teamwork Desk and the other business applications that I integrate Teamwork Desk with?
- Can I combine data from Teamwork Desk and Teamwork projects to create reports?
Users, Sharing & Collaboration
- How do I share the reports in Zoho Analytics with my colleagues?
- Why are other members of my company not able to access the reports that I create?
- How can other members of my company create reports?
- Why can't other users edit the reports that I have shared with them?
- Can I share the same report created to multiple users with different criteria associated, so that they see different data?
- Can I export a report/dashboard?
- How can I print the reports & dashboards created in Zoho Analytics?
- How can I email reports & dashboards created in Zoho Analytics in a scheduled manner?
- How do I embed my reports in my intranet, blog or presentation?
Help & Support
- How do I get technical support on Zoho Analytics connector?
- Can I have someone from Zoho do a demo of this connector for me?
Solutions
- How will Teamwork Desk Advanced Analytics help do effective helpdesk analytics?
- How do I keep track of the performance of the agents and analyze the quality of my support team?
- What are the insights that I can gain by performing customer Analytics?
General
1. What is Zoho Analytics?
Zoho Analytics is an on-demand reporting and business intelligence solution that helps you derive insights on your business data through its powerful reporting and analytical capabilities. You can create dynamic reports in minutes, with no IT help.
It offers the following important capabilities:
- Complete Online Reporting & Business Intelligence service accessible anytime and anywhere!
- Easy to adopt 'Spreadsheet-like' interface with powerful drag & drop based reporting features for quick report creation.
- Visual Analysis capability for in-depth analysis and to slice & dice your data
- Supports a wide range of reporting capabilities like Dashboards, Charts, Pivot Tables, Summary, and simple Tabular reports. Supports creation of KPI widgets in dashboards to analyze the performance.
- Supports data import from a variety of file formats like Excel, JSON, HTML etc. Also supports data import from cloud storage and Web URLs. Supports periodic scheduling of import.
- Integrated with Teamwork Desk to empower your helpdesk data with the powerful reporting capabilities in Zoho Analytics.
- Zoho Analytics is integrated with popular business applications like Google Analytics, Salesforce CRM etc.
- You can also integrate your own applications with Zoho Analytics using Zoho Analytics API.
- Blend & merge data from across different sources to create meaningful business reports
- With an advanced formula engine, you can derive key business metrics from your data. Also supports SQL (Structured Query Language) driven querying for powerful report creation.
- Real-time collaboration by sharing data and reports in read or read-write modes with your colleagues & friends.
- Export and Print reports in variety of formats. Notify reports via email.
- Publish reports for wider consumption. Embed reports within your websites, web applications and blogs.
- Highly secure through user login with support for HTTPS (SSL connection). All your data and reports are hosted in highly secure datacenters. (Refer Security and Privacy)
- Supports Logo Rebranding.
2. Why Teamwork Desk Advanced Analytics connector?
Teamwork Desk Advanced Analytics Connector enables you to import your helpdesk data in Teamwork Desk into Zoho Analytics for advanced reporting and analysis. This connector brings in all the capabilities of Zoho Analytics described above to Teamwork Desk users.
- A full-featured business intelligence (BI) and reporting tool that can slice & dice your Teamwork Desk data to create any report/dashboard you require.
- Over 75+ reports and dashboards that anyone using Teamwork Desk will find great value in.
- Create your own reports and dashboards based on not only your Teamwork Desk data but also from any other data sources and popular business applications
- Share reports and dashboards with your colleagues.
- Schedule and email your reports whenever you want.
- Export your reports as PDF, HTML, Excel, CSV and image files.
- Embed your reports in websites, blogs etc.
3. What are the benefits of using the Teamwork Desk Advanced Analytics over the inbuilt Reporting module in Teamwork Desk?
The advantage of using the Teamwork Desk Advanced analytics add-on over the reports tab inside Teamwork Desk is tabulated below.
| Reporting Module in Teamwork Desk | Teamwork Desk Advanced Analytics |
| Users cannot create new reports. They can only view the basic default reports available in Teamwork Desk. | It offers over 25+ chart types along with pivot, summary and tabular views. |
| Cannot create new dashboards. | Users can easily create dashboards using the drag and drop interface. |
| Cannot create new KPI Widgets. | Allows creation of KPI widgets to track and monitor the key performance metrics. Supports 6 types of single number widgets and 2 types of chart type widgets. |
| The reports cannot be shared | You can share the reports and dashboards that you create to any user. All that the user has to do is sign in to Zoho Analytics to view the report. |
| Does not allow the users to email the reports. | Users can not only email reports to users but also schedule emails. |
| Does not allow the users to embed the reports that they create. | Users can embed the reports that they create in a website or blog. |
| Does not offer formula engine. | Offers a powerful formula engine. |
| Limited customizations. | Offers a wide range of customizations. |
Setup
1. How to Setup Teamwork Desk Advanced Analytics Connector?
Also refer,
- How to create reports using this connector
- How to Create Charts
- How to Create Pivot Tables (Matrix Views)
- How to Create Dashboards
- Video demos
2. How long should I wait for my Teamwork Desk data to initially appear in Zoho Analytics?
After configuring the connector, you might have to wait about five minutes for the connection to be established. You will receive an email notification once the import is complete. If you access the workspace before the initial fetch, it will not display any data.
3. I received an email which said 'Setup Process Failed'/'Synchronization Process Failed'. What should I do?
The import/sync process of your Teamwork Desk data can sometimes fail due to some technical glitch. You will receive a mail notification of the occurrence. Let's look at the two cases associated with this issue.
Case 1: You will receive the Setup Process Failed mail when there is a failure during the initial fetch. In this case, we request you to:
- Open the workspace in which you have set up the connector.
- Click the Data Sources button in the side panel.
- From the Data Sources tab click the Retry Now link.
If the issue persists, please write to onprem-support@zohoanalytics.com.
Case 2: You will receive the Synchronization Failed mail if there is a failure during the data synchronization process. In this case, Zoho Analytics will retry the data sync process. You will be notified again in case of a failure. Please note that the import schedule will get suspended after five successive failures. In such case, please write to onprem-support@zohoanalytics.com.
4. How frequently can I synchronize my data with Zoho Analytics?
You can choose to synchronize your data at these intervals mentioned below.
- 3 Hours
- 6 Hours
- 12 Hours
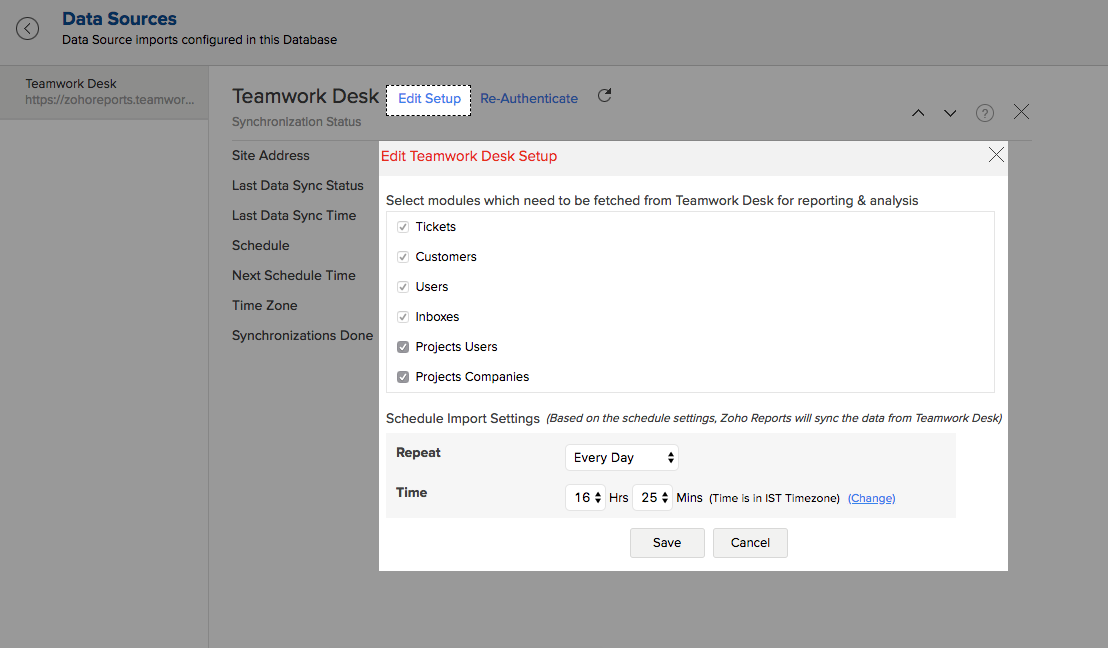
5. Can I edit the Teamwork Desk connector Synchronization setting?
Yes, you can edit the Teamwork Desk connector synchronization setting if you are the Account admin who had set up the connector for Zoho Analytics.
To perform this sync:
- Open the Teamwork Desk Insights workspace.
- Click the Data Sources button in the side panel.
- In the Data Sources tab that opens, click the Edit Setup link.
- Make the necessary changes, and click Save.
6. Can I perform an ad hoc synchronization from Teamwork Desk?
Yes.
To synchronize your data on ad hoc basis:
- Login to your Zoho Analytics account.
- Open the corresponding workspace.
- Select the Data Sources button from the side panel.
- In the Data Sources tab that opens, click Sync Now.
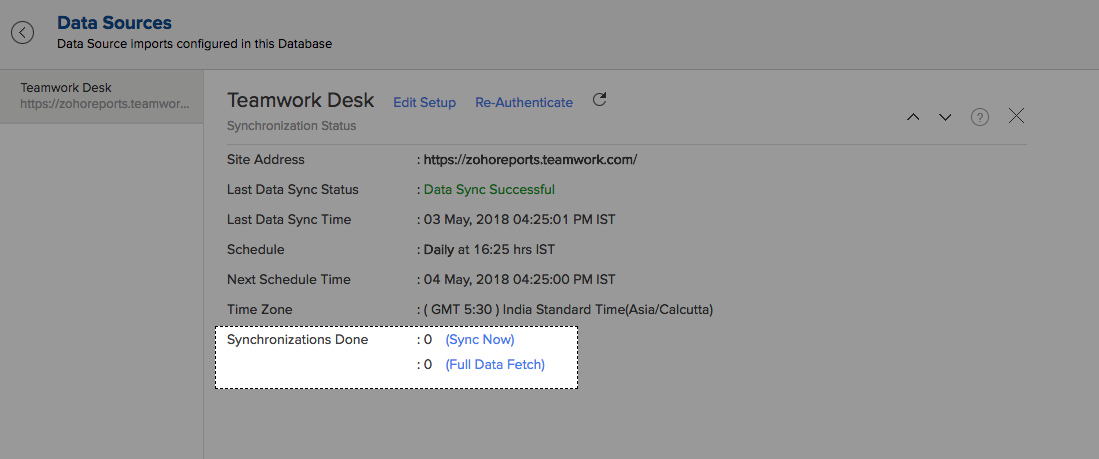
- Teamwork Desk data will get instantly synchronized.
Note:
To fetch the entire data, click Full data fetch link. This will fetch the entire data from Teamwork Desk and therefore will take a few additional minutes.
7. What are the modules available in Teamwork Desk on to create reports?
Data from the following modules get synced into Zoho Analytics.
- Tickets
- Customers
- Inboxes
8. Can I set up the Teamwork Desk advanced analytics connector in any of the existing workspaces?
Yes. To set up Teamwork Desk advanced analytics in an existing workspace:
- Open the workspace into which you want to import your Teamwork Desk data.
- Click the Import Data button in the Explorer tab or Select Create > New Table/Import Data.
- In the Create New Table tab, select Import from Teamwork Desk.
- From the Import from Teamwork Desk dialog, authenticate your Teamwork Desk account.
- Select the modules that need to be imported into Zoho Analytics.
- Select the necessary schedule import options in the Schedule Import Settings section and click Next.
Your Teamwork Desk data will be imported into your workspace. Please refer the setup presentation.
9. Can I import data from multiple Teamwork Desk Site?
Yes, you can configure multiple Teamwork Desk accounts to synchronize with Zoho Analytics in the same workspace or in a different workspace.
To import data from multiple sites into the same workspace,
- Open the workspace in which you have setup the connector
- Click the Import Data button in the Explorer tab or select New > New Table/Import Data.
- In the Create New Table window that opens, select Import from Teamwork Desk.
- In the Import from Teamwork Desk dialog that opens, input the necessary details.
- Select the entities and their corresponding fields.
- Select the necessary schedule import options in the Schedule Import Settings section.
- Click Create.
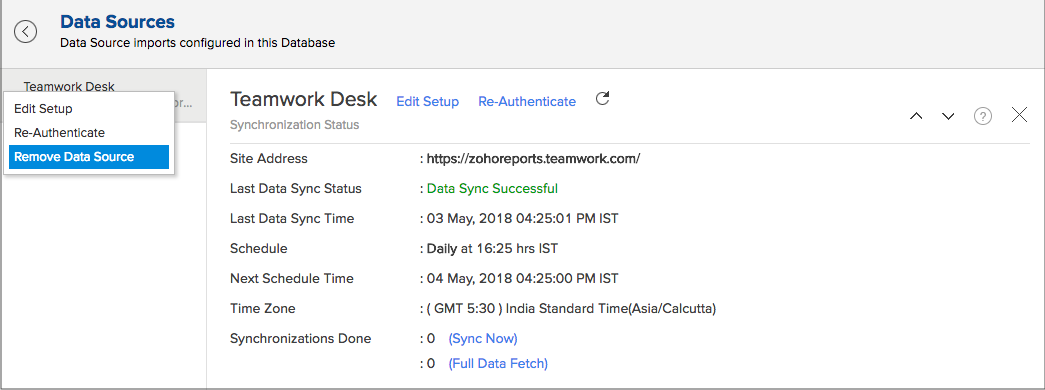
10. How do I remove this integration?
- Log in to your Zoho Analytics account.
- Open the corresponding workspace.
- Select the Data Sources button from the side panel, and if multiple connectors are setup, select Teamwork Desk from the options listed.
- In the Data Sources tab that opens, click the Settings icon, and select Remove Data Source as shown in the snapshot.
Reporting Features
1. How can I create reports using this connector?
You can easily create custom reports in the form of charts, pivot tables, summary and tabular views in Zoho Analytics. Click the corresponding links to learn more about creating reports. These reports can also be organized together to form intuitive dashboards. Refer this documentation to learn more about creating dashboards.
2. What are the report types supported by Zoho Analytics?
Zoho Analytics supports a wide variety of reports.
- Charts
- Pie
- Bullet
- Dial
- Bar
- Stacked bar
- Line
- Smooth Line
- Scatter
- Combination
- Area
- Stacked Area
- Web
- Funnel
- Doughnut
- Bubble
- Packed Bubble
- Table View
- Pivot tables (Matrix Views)
- Summary view
- Tabular view
- Dashboards (multiple reports arranged in the same page)
- KPI Widgets
3. Can I modify the default reports that have been created by this connector? If so, how?
Yes, you can modify the default reports if you are the workspace admin.
To modify the reports, click the Edit Design button in a report's toolbar and you will be able to make the changes. If you are just a user who's been shared the report, save a copy of the report by clicking Save > Save As. Now you can edit the newly copied report.
4. How do I create reports using fields/columns across different modules?
Columns from across different Teamwork Desks modules are joined by default. Therefore, you can create reports by simply dragging and dropping the respective columns into the report builder.
5. What is 'Formula' in reports?
Formulas are calculations that you could define using the powerful formula engine in Zoho Analytics to help create required reports. Refer Adding Formulas in Zoho Analytics to know more.
6. What are the default formulas added by Zoho Analytics, on setting up this connector?
The default formulas from Zoho Analytics are listed below. You can view these formulas by opening the corresponding table and selecting Add > Edit Formulas from the toolbar.
The table lists all the default formulas that will be created in the Tickets table.
| Formula Name | Formula | Formula Type | Description |
| Ticket Age in Days | datediff(currentdate( ),"Created At") | Formula Column | Number of days since the ticket was created |
| Shift (Ticket Creation) | if(hour("Created At") >= 12 and hour("Created At") <= 18,'Afternoon Open',if((hour("Created At") > 18 and hour("Created At") <= 24) OR (hour("Created At") >= 0 and hour("Created At") < 6),'After Hours Open',if(hour("Created At") >= 6 and hour("Created At") < 12,'Morning Open','-NA-'))) | Formula Column | The time period (part of the day) when the ticket was created.
|
| Status Group | if(("Status" in ('Solved' ,'Closed')),'Completed',if(("Status" in ('Deleted')),'Deleted','In Progress')) | Formula Column | Displays the status of the ticket. |
| First Reply Time (hrs) | "First Response Time"/60 | Formula Column | Displays the number of hours between the time a ticket is created, and the first reply for a ticket. |
| Completion Age Tier | if(isnull("Resolution time (hrs)"),'Not Resolved',if("Resolution time (hrs)"<=6,'0 - 6 Hours',if("Resolution time (hrs)">6 and "Resolution time (hrs)"<=12,'6 - 12 Hours',if("Resolution time (hrs)">12 and "Resolution time (hrs)"<=24,'12 - 24 Hours',if("Resolution time (hrs)">24 and "Resolution time (hrs)"<=48,'24 - 48 Hours','Above 48 Hours'))))) | Formula Column | Age tier of the completed ticket. Possible options are
|
| First Reply Time Age Tier | if(isnull("First Reply Time (hrs)"),'Not Responded',if("First Reply Time (hrs)"<=2,'0 - 2 Hours',if("First Reply Time (hrs)">2 and "First Reply Time (hrs)"<=5,'2 - 5 Hours',if("First Reply Time (hrs)">5 and "First Reply Time (hrs)"<=8,'5 - 8 Hours',if("First Reply Time (hrs)">8 and "First Reply Time (hrs)"<=12,'8 - 12 Hours',if("First Reply Time (hrs)">12 and "First Reply Time (hrs)"<=24,'12 - 24 Hours','Above 24 Hours')))))) | Formula Column | Age tier of the First reply for the tickets. Possible options are:
|
| Ticket Age Tier | if( "Ticket Age in Days">=0 and "Ticket Age in Days" <=15 , ' 0 - 15 Days', if( "Ticket Age in Days">15 and "Ticket Age in Days" <=30 , '16 - 30 Days', if( "Ticket Age in Days">30 and "Ticket Age in Days" <=45 , '31 - 45 Days', if( "Ticket Age in Days">45 and "Ticket Age in Days" <=60 , '46 - 60 Days', if("Ticket Age in Days">60, 'Over 60 Days','Invalid Age'))))) | Formula Column | Age tier of the tickets in days from the time it was created. Possible options are
|
| Resolution time (HRS) | "Resolution Time"/60 | Formula Column | Displays the resolution time of the ticket in hours |
| % Resolved | ((countif("Tickets"."Status Group" = 'Completed')) / (count ("Tickets"."Id")))*100 | Aggregate | Percentage of the tickets resolved |
| Satisfaction Rate | (countif("Tickets"."Happiness Rating"='great')/countif("Tickets"."Happiness Rating"='great' OR "Tickets"."Happiness Rating"='bad' OR "Tickets"."Happiness Rating"='ok'))*100 | Aggregate | Displays the satisfaction rating of the customer. |
| Resolved Tickets | countif("Tickets"."Status Group"='Completed') | Aggregate | Provides the count of resolved tickets |
| Fast Resolution count (< 2 hrs) | countif("Tickets"."Resolution time (hrs)"<2) | Aggregate | Provides the count of tickets responded within 2 hours |
| Unresolved Tickets | countif("Tickets"."Status Group"='In Progress') | Aggregate | Provides the count of unresolved tickets |
| Unsatisfied responses count | countif("Tickets"."Happiness Rating"='bad') | Aggregate | Provides the count of unhappy customers |
| Solved Tickets - In Time | countif("Tickets"."Ticket handling Mode"='In Time' AND "Tickets"."Status Group"='Completed') | Aggregate | Number of tickets solved in time |
| Resolved Tickets - MTD | mtd("Tickets"."Resolved Tickets","Tickets"."Solved At") | Aggregate | Provides the count of resolved tickets in Month to Date |
7. How do I create custom formulas in Zoho Analytics?
You can create your own formulas by clicking Add > Formula Column/Aggregate Formula on the table. Refer the Adding Formulas in Zoho Analytics help page to learn in detail.
8. Can I add/modify data in the Teamwork Desk data tables in Zoho Analytics?
No, you cannot add/modify data in the Teamwork Desk data tables. Data from Teamwork Desk modules gets automatically synced into Zoho Analytics in the different tables (one table for each module). You cannot edit any of this data or add new data records from within Zoho Analytics.
However, you can add new tables and add/import data into it, to create reports combining it with the data from Teamwork Desk.
9. Can I add new columns to the Teamwork Desk data tables in Zoho Analytics?
No, you cannot add new columns. But, you can add Formula Columns and Aggregate Formulas (i.e., calculated fields) to these tables to help you create powerful reports. Refer Adding Formulas to learn more.
10. Can I add new data tables in this Workspace to create reports & dashboards?
Yes, you can add new data tables. Click New > New Table to add a new table in the existing Teamwork Desk workspace.
With this feature, you can import data from other sources or add them manually into your workspace to analyze and create reports combining this with your Teamwork Desk data. You can also import data from other business applications like Google Analytics, Salesforce CRM, etc.
Refer:
- How to Import data from files and feeds into Zoho Analytics
- How to Import data from local databases using Upload tool
- Import data from popular Business Applications
- How to Import data using Zoho Analytics API
11. Can I combine data from other sources with the data from Teamwork Desk to create reports and dashboards?
Yes, you can combine data from your other sources with your Teamwork Desk data for analysis. To do this, you need to add/import a new data table into the Teamwork Desk workspace as explained in the previous question and then define a look-up to join it with the table from Teamwork Desk.
To define a lookup relationship between two tables, it is essential that the tables have at least one column which is common between them. Follow the below steps to look up a column from Teamwork Desk along with the data from any other source.
- Open the corresponding table, right-click the column header and select Change to Lookup Column.
- In the Change to Lookup Column dialog that opens, select the column to look up.
- Click OK
Click here to learn more.
12. Can I join data from multiple tables to create reports?
Yes, you can join data from multiple tables to create the reports. Refer to the previous question for detailed help on this.
13. What are Query Tables?
Query Table is a feature that enables you to prepare data for easy reporting and analysis. You can combine data from one or more tables in a workspace and create specific data views using the standard SQL SELECT queries.
These data views are similar to tables and you can perform operations such as report creation, sharing, and even create another Query Table over an existing Query Table. You can create Query Tables for filtering datasets, batching datasets together (union), transforming data, applying SQL query functions, joining datasets and more. Learn more.
Cross-Functional Analytics with Popular Business Applications
1. What are the popular business applications that I can integrate and analyze Teamwork Desk with?
You can import and analyze data from all the applications that Zoho Analytics offers integration with. Please refer to our Integrations page to know more.
2. How can I analyze the data from the third party business applications along with Teamwork Desk?
To import data from the third party business apps,
- Open the Teamwork Desk workspace.
- Click the Import Data button.
- In the Create New Table tab that opens, select the application that you wish to import.
- Provide the necessary authentication.
- Select the necessary modules and the schedule import options.
- Click Create.
Once the data gets imported into the Teamwork Desk workspace, you can create lookup relationships or write query tables to join these tables.
3. Will a lookup relationship between the related modules from Teamwork Desk and other business application be created automatically?
A lookup relationship will not be created automatically between the Teamwork Desk modules and the modules of the application that you are trying to import. You will have to manually link the tables using a look-up relationship.
To manually create a lookup relationship refer this help link.
4. How can I combine data from Teamwork Desk and Teamwork Projects to create reports?
You can easily import data from Teamwork Projects into you Teamwork Desk workspace in Zoho Analytics. To do this, head to the Teamwork Desk workspace and click the +Create button from the side panel. Click the New Table / Import Data option, and follow the steps detailed in this presentation.
Users, Sharing & Collaboration
1. How do I share the reports in Zoho Analytics with my colleagues?
You can share the default reports provided in the Teamwork Desk connector and the created reports with other users in your Sites. Refer the Sharing and Collaboration help page for more details on this.
Once you privately share a report to your colleagues, they will be able to access the reports. Refer here to know how to access the reports.
2. Why are other members of my company not able to access the reports that I create?
When a Teamwork Desk Administrator configures the Teamwork Desk - Zoho Analytics connector, the tables and reports will be available only to him/her, by default. The Administrator has to share the workspace with other members of the company. Only then will the default reports be accessible by those members.
To know more, refer the Sharing and Collaboration help page.
3. How can other members of my company create reports?
If you add a user as a Workspace Admin in the Teamwork Desk workspace created in Zoho Analytics, the workspace admin will be able to access all data & reports, create new reports, and do any operation that you could on the workspace.
To know more, refer the Sharing and Collaboration help page.
Note:
- If you add a user as a Workspace Admin in the Teamwork Desk workspace created in Zoho Analytics, the user will be able access all the data & reports, create new reports and do any operation that you could do on the workspace.
4. Why can't other users edit the reports that I have shared to them?
This is the expected behavior. If the user being shared to is a workspace admin, they can edit the reports. If a normal user wants to edit a report, they can save the report in their account under a different name using the Save As option, after which it can be edited.
5. Can I share the same report created to multiple users with different criteria associated, so that they see different data?
Yes, you can. Refer to the topic Apply filter criteria.
6. Can I export a report/dashboard?
Yes, you can export the report/dashboard in various file formats such as CSV, EXCEL, PDF, HTML, and Image. Click to know more.
7. How can I print the reports & dashboards created in Zoho Analytics?
In order to print the report/dashboard, you first need to export it. You can export the report in various file formats such as CSV, EXCEL, PDF, HTML and Image. Click to know more.
Note:
- If you are a user to whom a report has been shared and you want to take a print, ensure that you are provided with the Export permission on the report by the Workspace Admin.
8. How can I email reports & dashboards created in Zoho Analytics in a scheduled manner?
If you are the Account Admin of the Zoho Analytics connector or a Workspace Admin, you can schedule reports and dashboards to be emailed automatically. Refer the email schedule section to learn more.
9. How do I embed my reports in my intranet, blog or presentation?
You can easily embed the reports & dashboards created in Zoho Analytics in your website, web application or blog. Refer Embedding in Web Pages/Blogs to know more about this.
Solution
1. How will Teamwork Desk Advanced Analytics help me do effective Helpdesk analytics?
Teamwork Desk Advanced analytics helps you analyze your customer service data, track the right metrics and managing them proactively. This enables you to perform effective helpdesk analytics. Read this blog to know more.
2. How do I keep track of the performance of the agents and analyze the quality of my support team?
Teamwork Desk advanced analytics comes with handpicked domain specific reports and dashboards. The Agent performance dashboard gets generated automatically once you set up the integration between Zoho Analytics and Teamwork Desk. This dashboard consists of a list of insightful and data-driven reports that will help you analyze the performance and quality of your support team.
3. What are the insights that I can gain by performing customer Analytics?
Zoho Analytics offers a default customer analytics dashboard that enables you to derive deep insights on your customer data. This dashboard contains handpicked reports such as customer satisfaction vs resolution time, deadline compliance etc. Read this blog to learn more.
Help & Support
1. How do I get technical support on Zoho Analytics connector?
We offer 24x5 technical support (Monday to Friday). In case if you need our assistance kindly do mail us your questions to onprem-support@zohoanalytics.com.
You can also reach us on our toll-free numbers:
- United States: +1 408 454 4202
- India: +91-44-46447058 Extn: 6222
2.Can I have someone from Zoho do a demo of this connector for me?
Certainly. Please register for a demo on this page.