- What are Embedded Dashboards?
- How to Embed a Dashboard
- Real-World Examples of Embedded Dashboards
- Benefits of Embedded Dashboards
- Key Features of an Embedded Dashboard
- The Best 3 Embedded Dashboard Tools in 2026
- Best Practices for Designing an Embedded Dashboard
- How to Choose the Right Embedded Dashboard Solution
- Getting Started with Zoho Analytics
What are Embedded Dashboards?
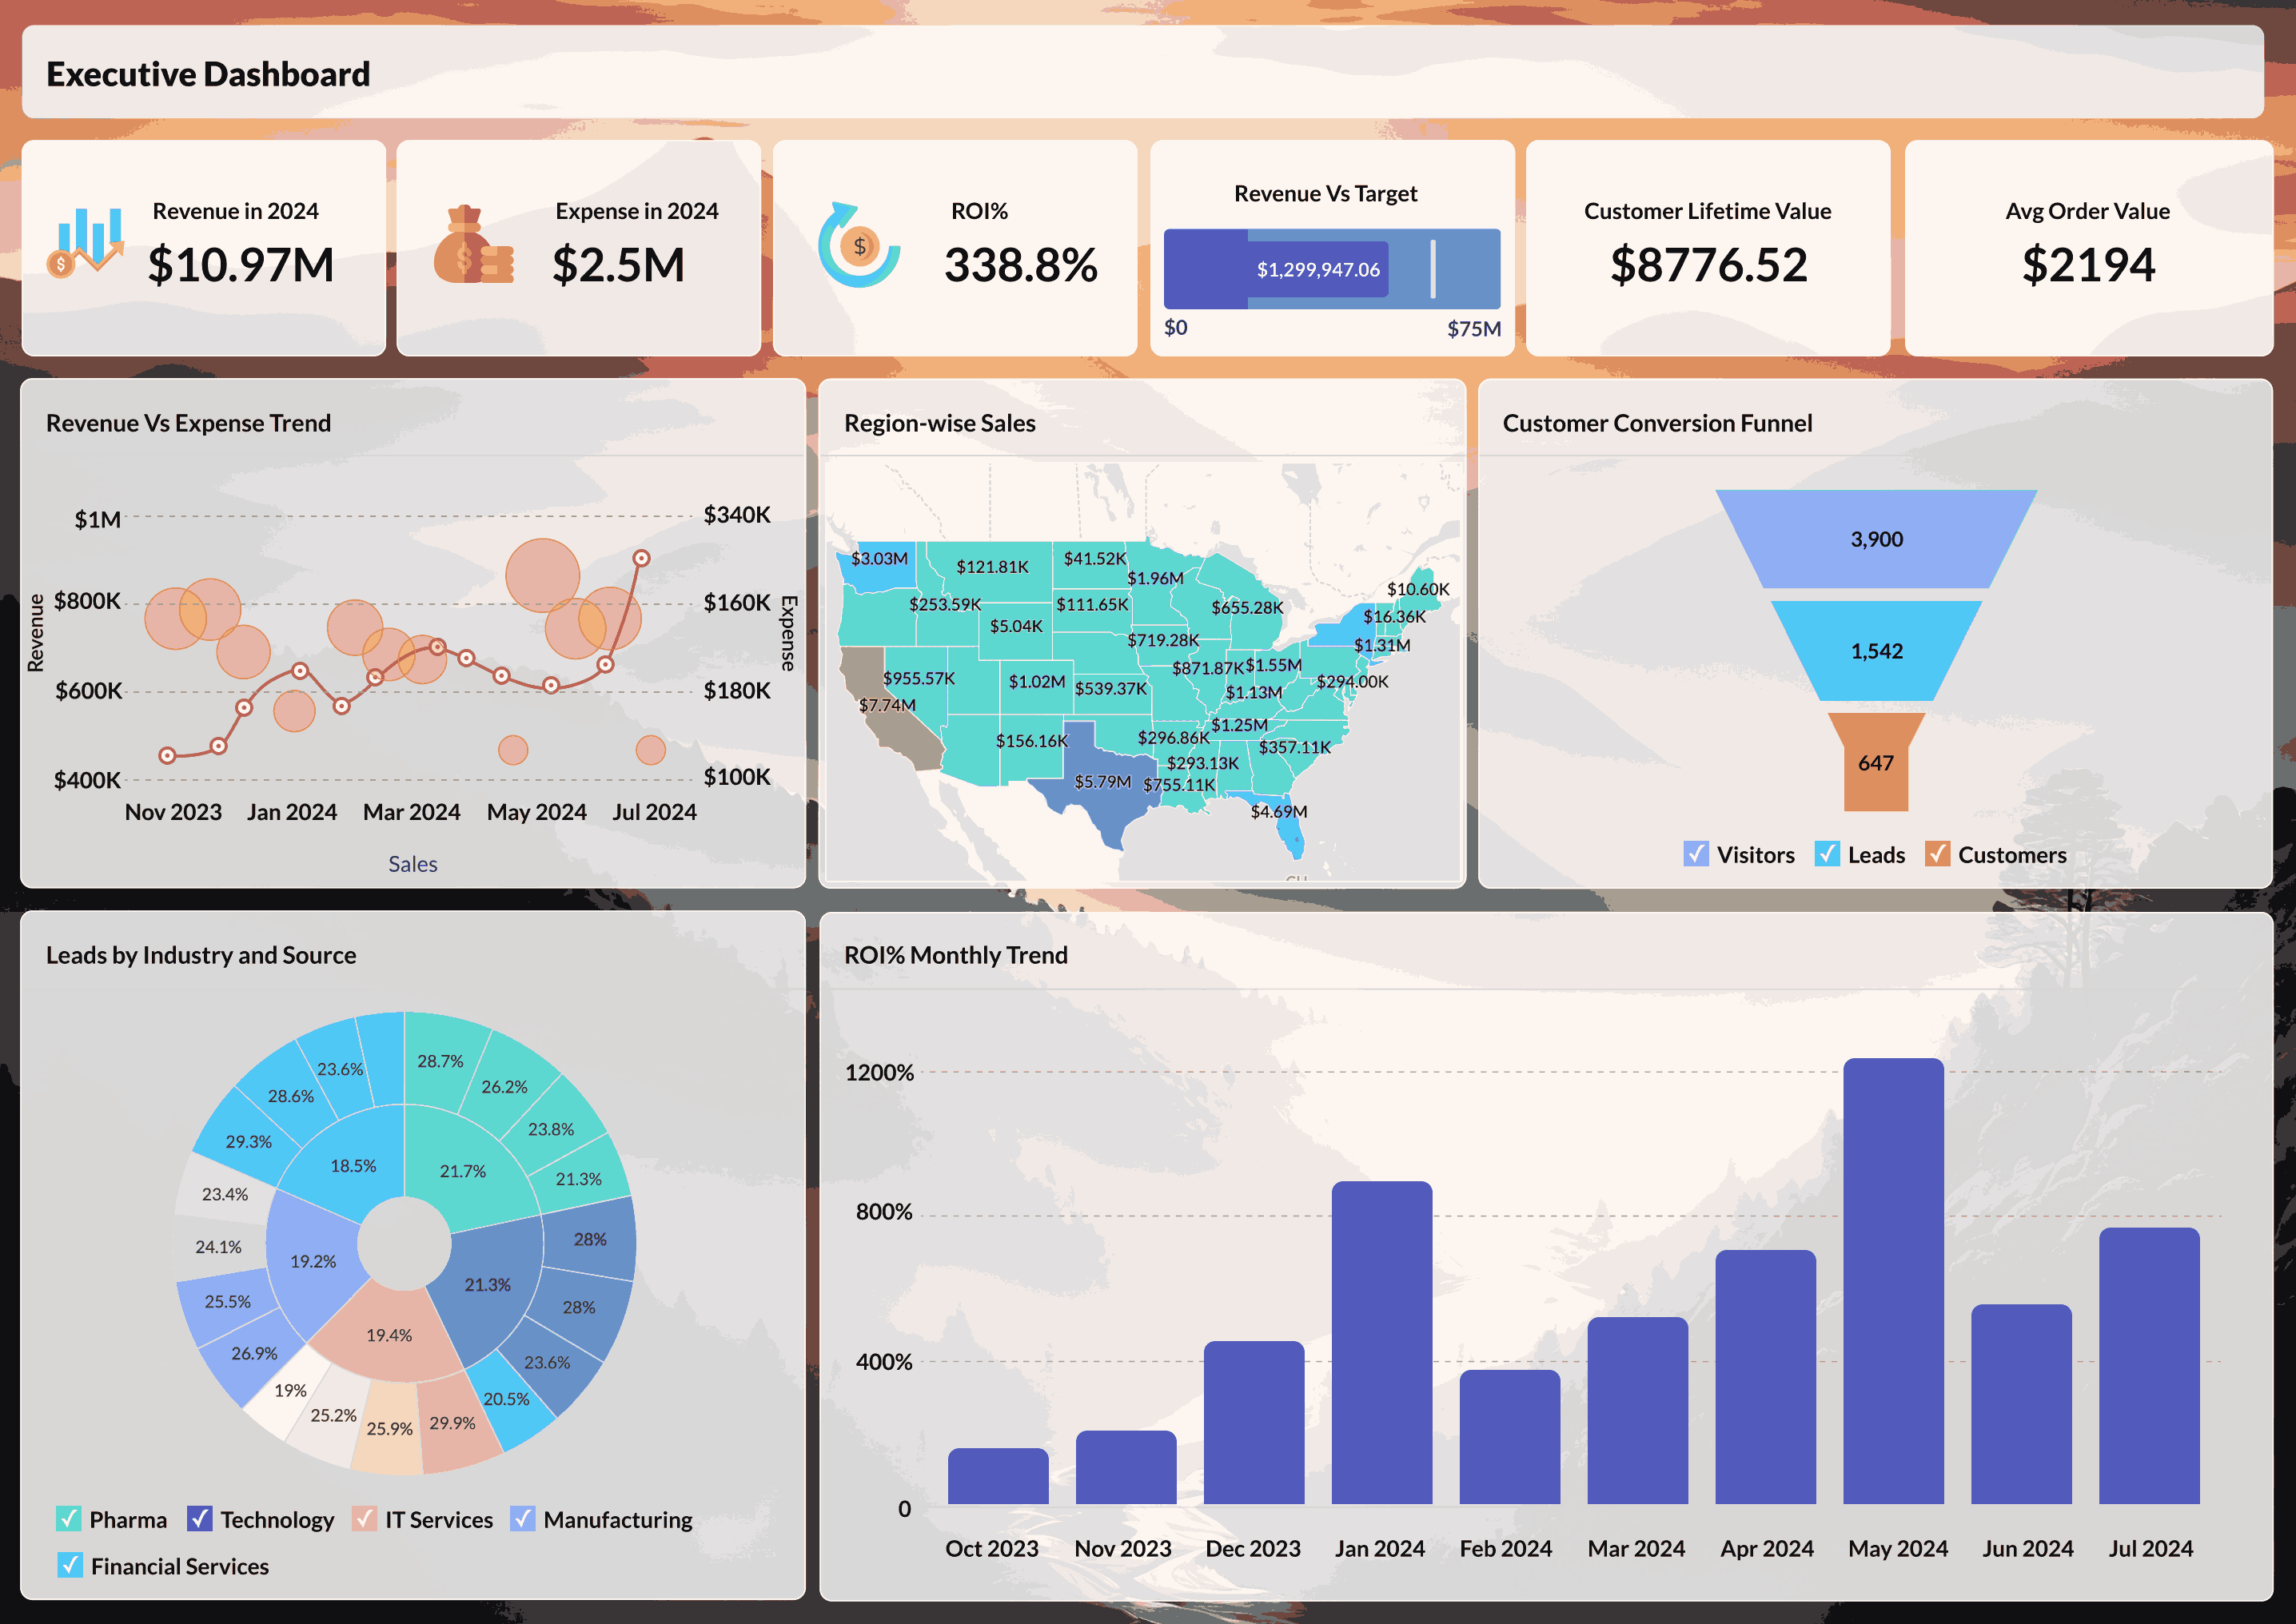
Embedded dashboards are interactive reporting interfaces integrated directly into business applications. Rather than opening a separate business intelligence platform, users can view charts, KPIs, tables, and other visualizations within the software they already use to complete their work.
Keeping reporting within the application allows users to review relevant business information at the point where decisions are made. For example, a sales manager working in a CRM can monitor pipeline performance without switching to another reporting tool, while a customer accessing a SaaS portal can track product usage from the same interface they use every day.
Modern embedded BI dashboards go beyond displaying static reports. They typically support filtering, drill-down analysis, sorting, and other interactive controls that allow users to explore data, investigate trends, and answer follow-up questions without relying on an analyst to create new reports. For a broader understanding of dashboard design and reporting practices, see our guide to the business intelligence dashboard.
How to Embed a Dashboard
Embedding a dashboard involves more than displaying charts within an application. It requires planning how users will access data, how permissions will be managed, and how the dashboard will integrate with the surrounding product experience. The following steps outline a typical implementation process.
Step 1: Define the audience and reporting requirements
Begin by identifying who will use the dashboard. Internal teams, customers, and partners often require different views of the same underlying data. Establish the dashboards, metrics, filters, and access permissions each audience needs before moving into implementation.
Step 2: Select an embedding method
The integration approach depends on the level of customization your application requires.
- iFrame embedding places a dashboard inside an application using a URL. It is straightforward to implement and works well for internal reporting or simpler deployments, although customization options are more limited.
- API integration provides greater control over authentication, user interactions, and application workflows. This approach is commonly used when analytics needs to integrate closely with existing product functionality. Learn more about available embedded reporting tool and integration options.
- JavaScript SDKs allow developers to embed dashboards with deeper customization, making analytics behave more like a native component of the application.
Step 3: Configure authentication and permissions
Integrate the dashboard with your application's authentication system using technologies such as OAuth, SAML, or JWT. Role-based access controls and row-level security should ensure users only see the information available to their role or tenant.
Step 4: Connect to your data sources
Configure the dashboard to retrieve data from the appropriate source, whether that's an operational database, cloud data warehouse, API, or other reporting layer. Live or scheduled data synchronization helps keep reports current while reducing the need for manual exports or spreadsheet-based reporting.
Step 5: Align the dashboard with your product
Apply your organization's branding through logos, colors, typography, navigation, and layout so the dashboard reflects the same visual experience as the surrounding application.
Step 6: Validate before deployment
Before rolling out the dashboard, test performance using realistic data volumes and concurrent users. Verify that authentication, permissions, and data isolation behave as expected, and confirm the experience across desktop, tablet, and mobile devices.
Real-World Examples of Embedded Dashboards
Embedded dashboards appear across a wide range of software products, helping users monitor performance, track activity, and make decisions without switching to a separate reporting platform. While the use cases differ across industries, the underlying idea remains the same: analytics is delivered alongside the work it supports.
1. SaaS products
Customer-facing dashboards often display product adoption, feature usage, subscription trends, or account health within the application itself. This allows customers to monitor their own data without exporting it into another analytics tool. Learn more about SaaS embedded analytics

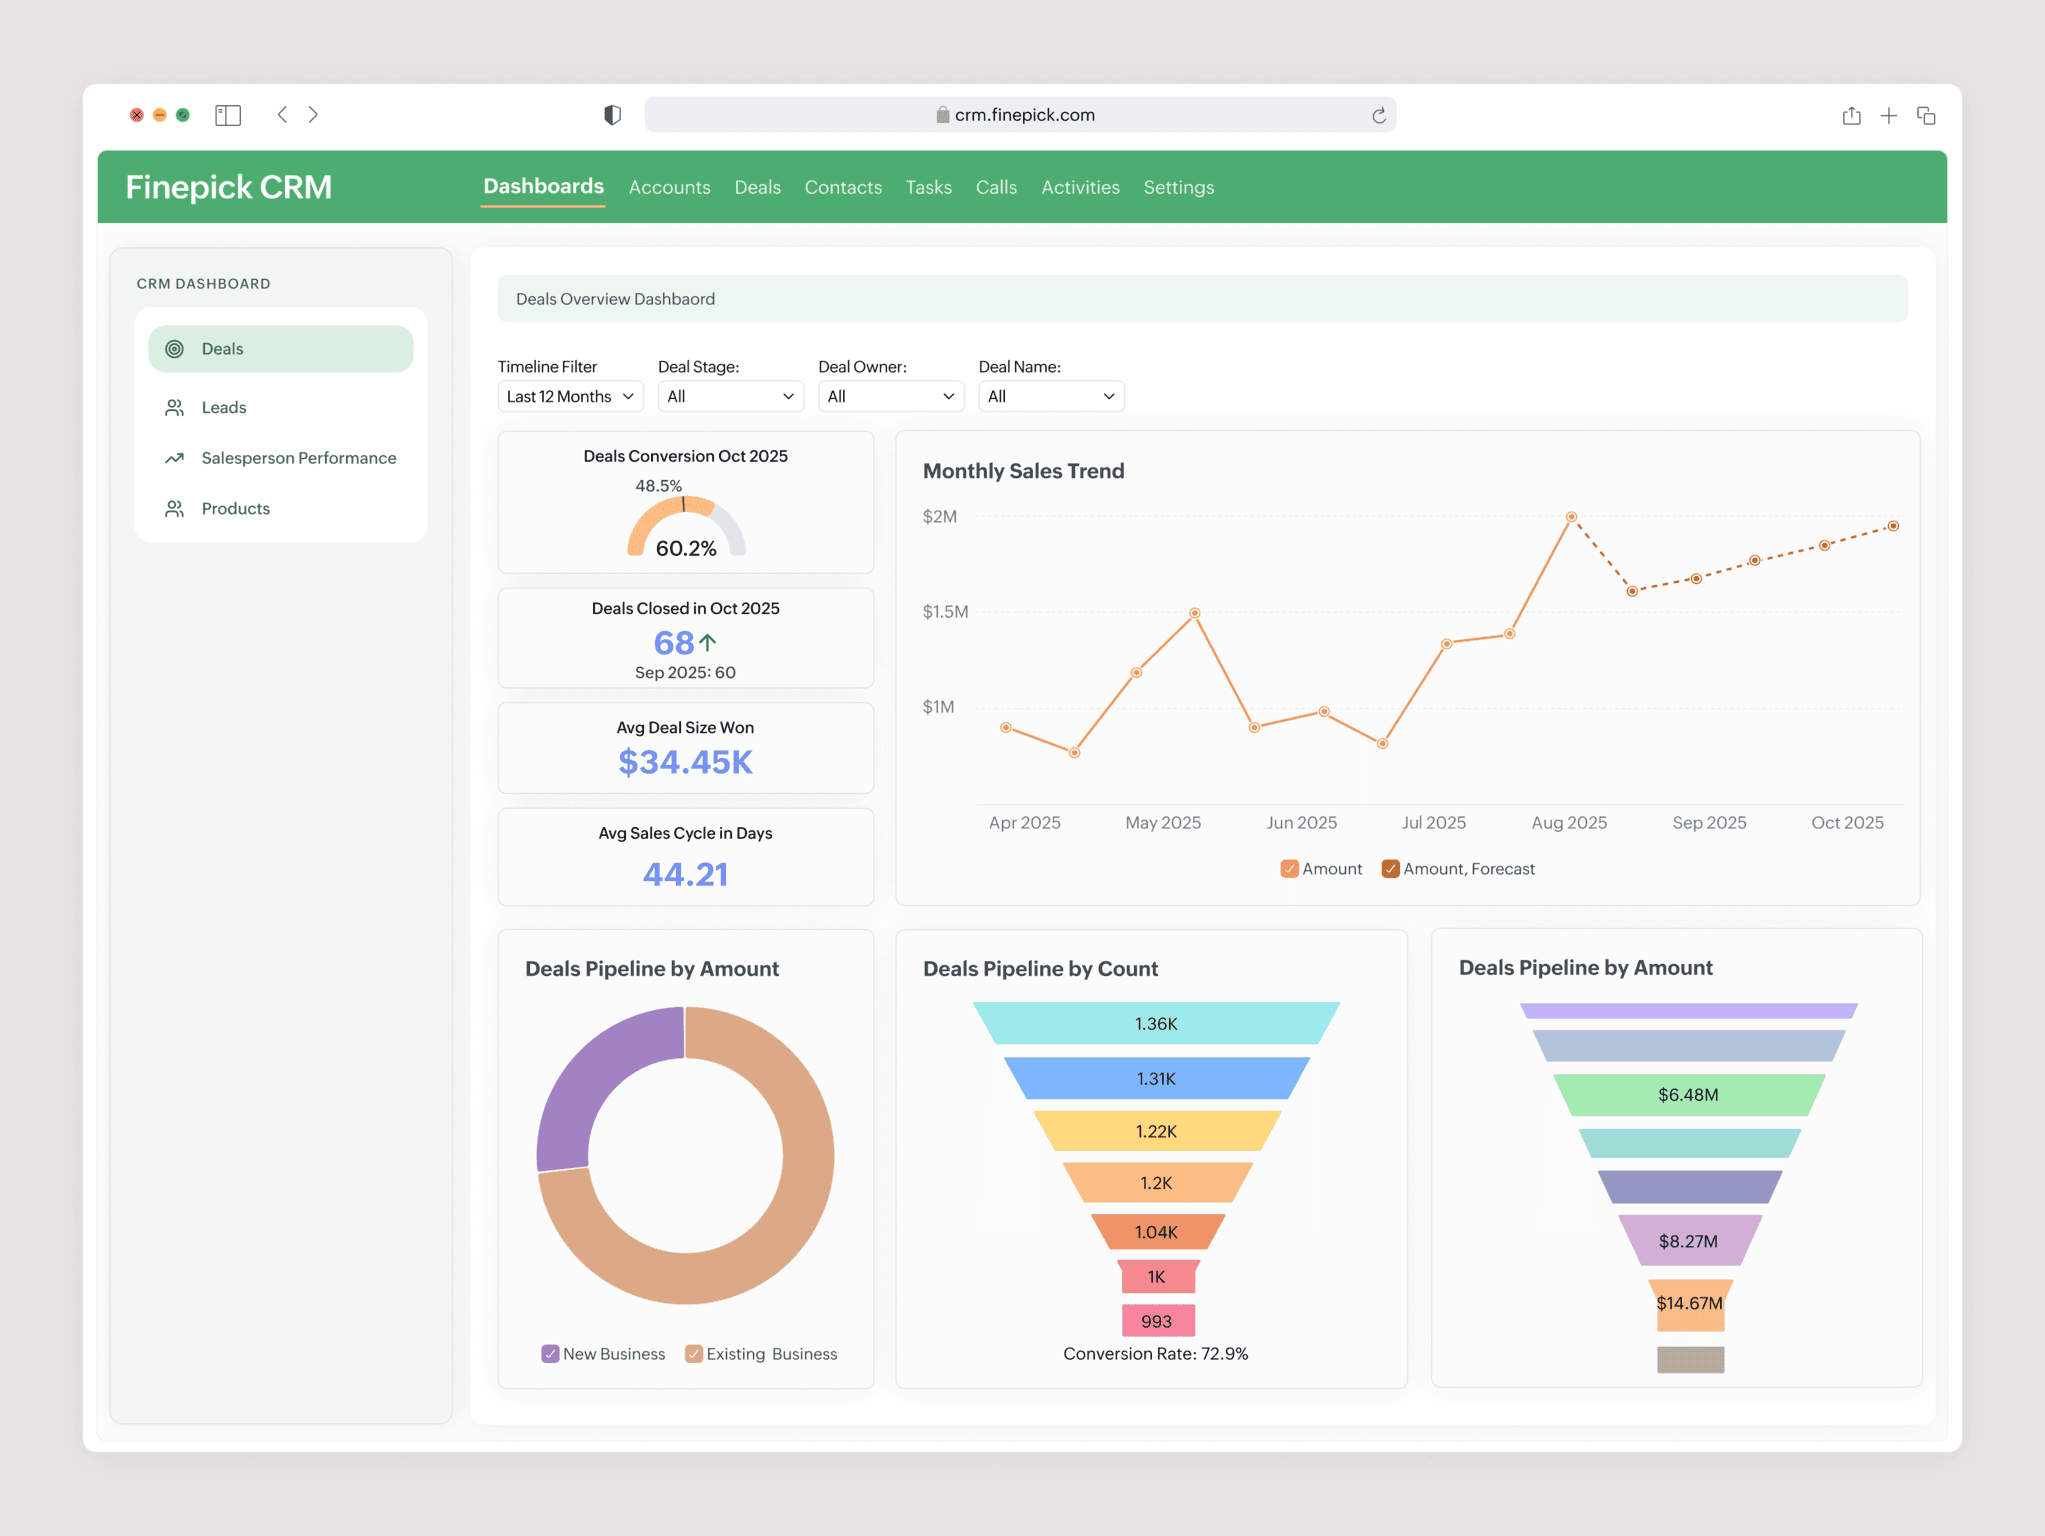
2. CRM and sales applications
Sales teams can review pipeline health, conversion rates, revenue forecasts, and account activity directly from customer records. Having these metrics available within the CRM helps representatives evaluate opportunities without interrupting their workflow. Explore more examples of embedded analytics for sales.
3. E-commerce platforms
Merchants frequently use embedded dashboards to monitor orders, inventory levels, product performance, customer behavior, and fulfillment metrics from a single administrative interface. Bringing these insights together helps teams respond more quickly to operational changes.

4. Consumer applications
Banking, personal finance, and fitness apps commonly present spending patterns, savings progress, workout history, or health trends through embedded dashboards. In these products, analytics helps users understand their own information without requiring specialist reporting knowledge. (Know more about embedded analytics for FinTech)
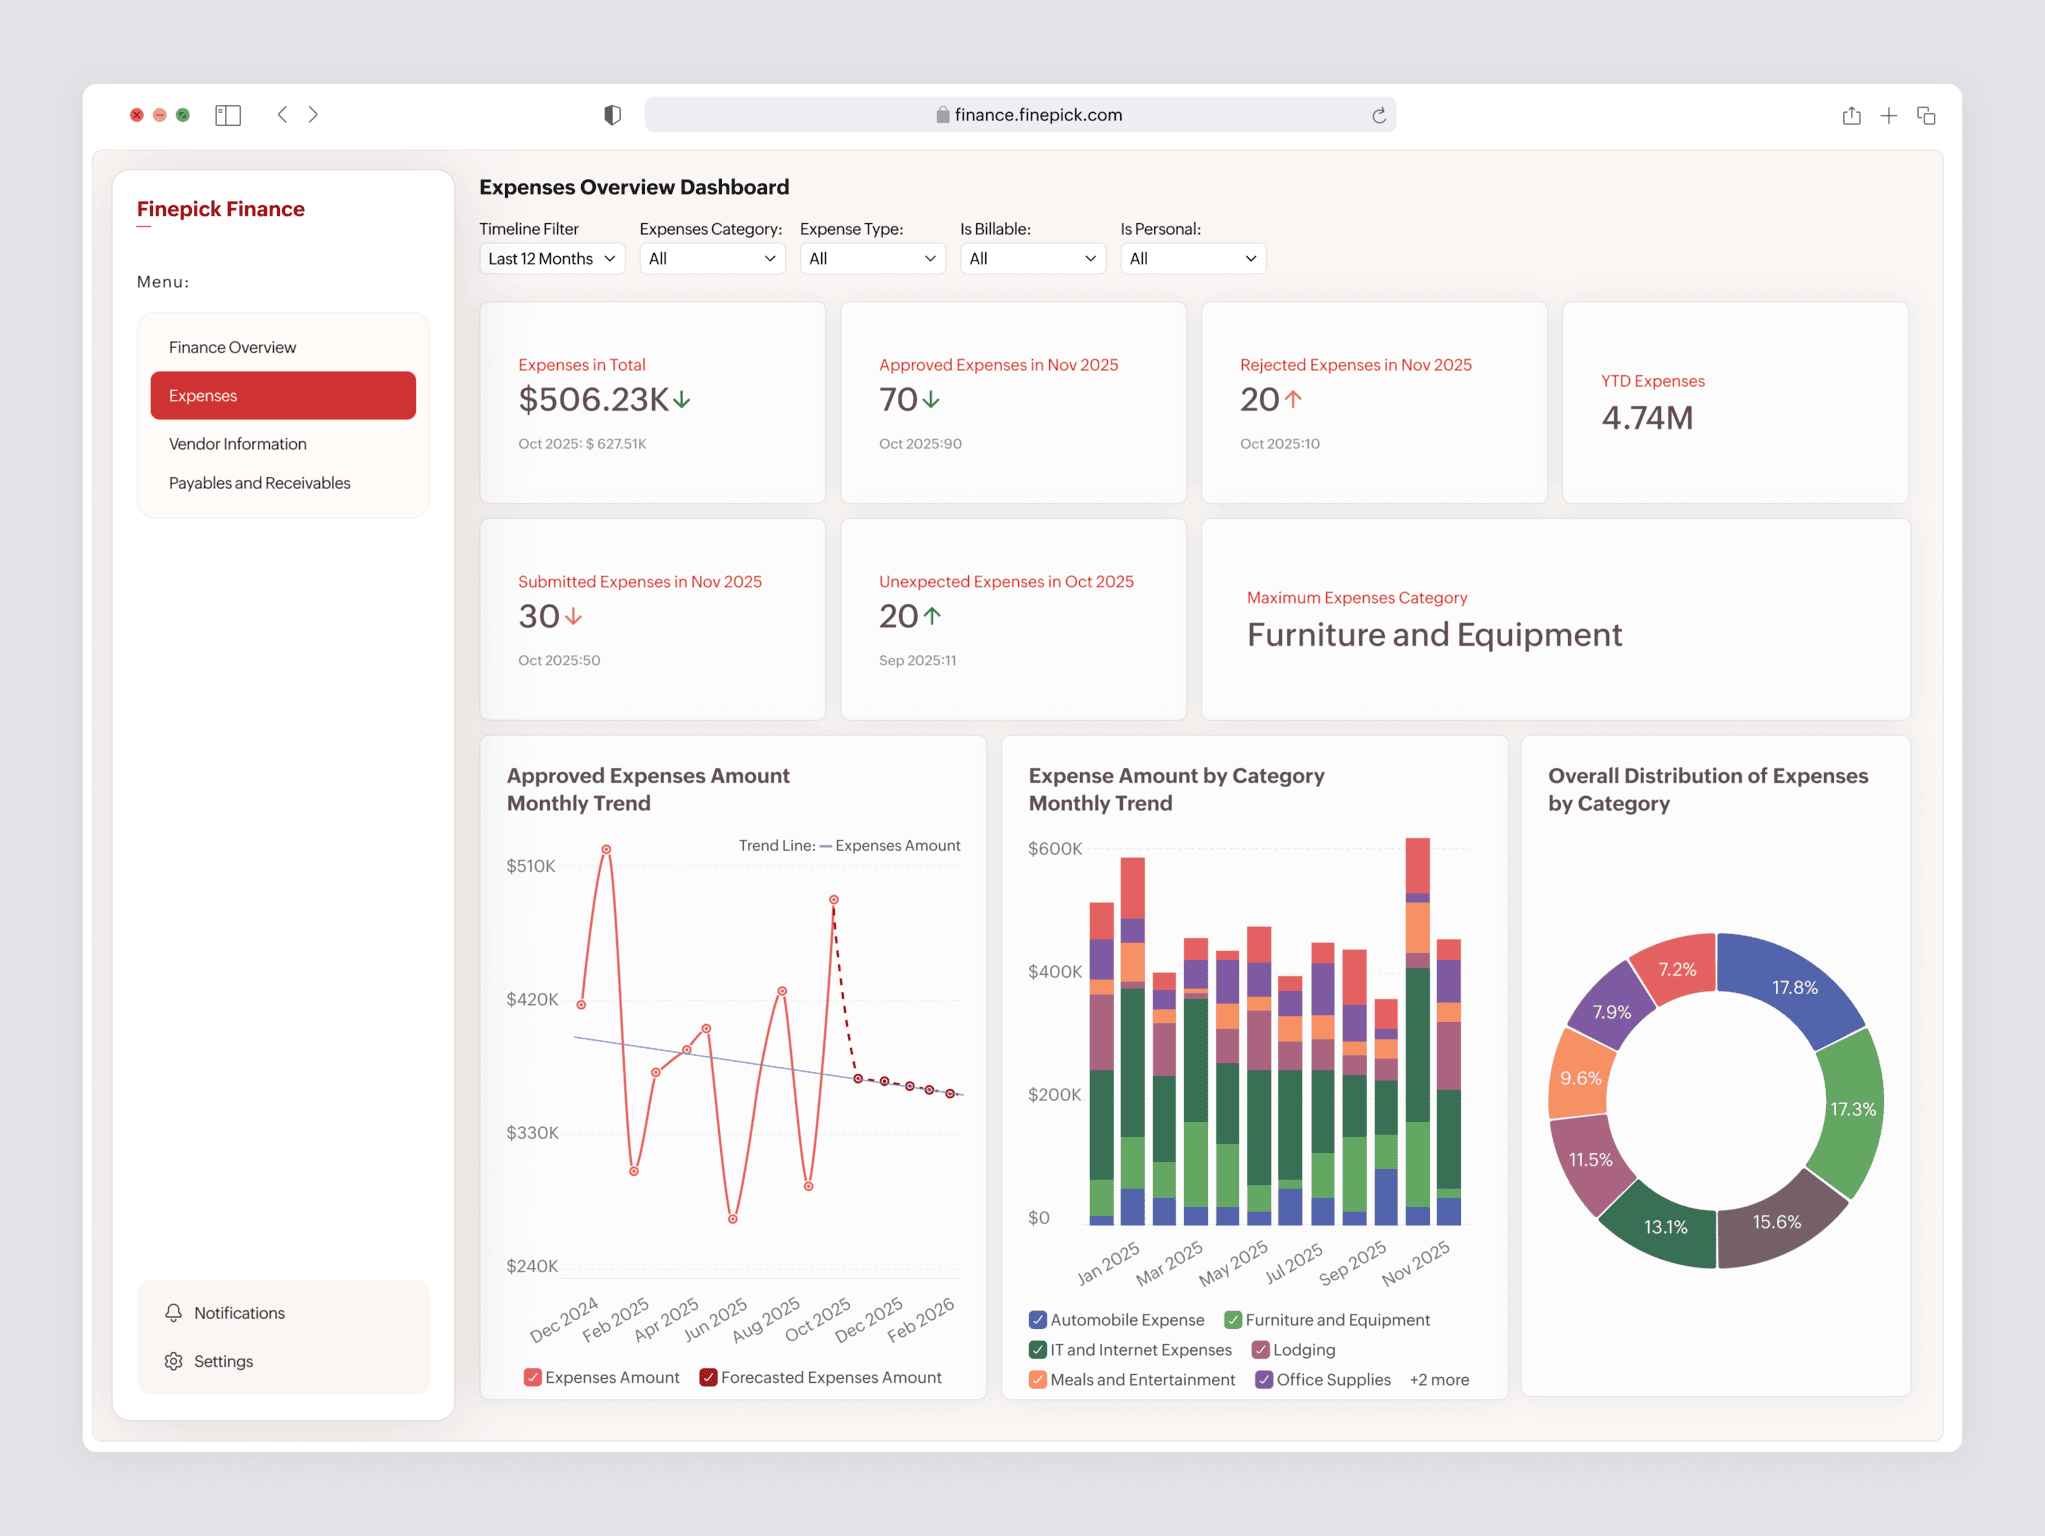
Across these examples, the dashboard becomes part of the product experience rather than a separate destination for reporting. Users can access the information they need while continuing the task they are already performing, reducing unnecessary context switching and making analytics more accessible.
Benefits of Embedded Dashboards
Embedded dashboards make business information easier to access by presenting it within the applications people already use. Instead of treating reporting as a separate activity, they bring operational data closer to everyday tasks, making it simpler for users to monitor performance and respond to changing conditions.
Support faster decision-making
When dashboards update with current data, users can evaluate trends and performance without waiting for scheduled reports or exporting information into spreadsheets. This helps teams respond to issues while they're still relevant.
Reduce manual reporting
Keeping reports within the application reduces the need to switch between multiple tools, compile recurring spreadsheets, or recreate the same analysis for different stakeholders. Users can access the information they need from a single interface.
Encourage regular use of analytics
Analytics becomes more accessible when it's part of the product experience rather than a separate destination. With dashboards available during day-to-day work, more users are likely to consult data as part of their routine activities.
Increase the value of software products
For software vendors, embedded dashboards add reporting capabilities without requiring customers to adopt another analytics platform. Customer-facing insights can strengthen the overall product experience and support premium features or service offerings.
Provide business context
Numbers are most useful when they appear alongside the processes they describe. Displaying operational metrics within the surrounding workflow helps users interpret information in context instead of viewing reports in isolation.
Key Features of an Embedded Dashboard
An embedded dashboard should do more than display charts within an application. It should integrate with existing workflows, present current information, and support secure access while remaining flexible enough to grow with the product. The following capabilities are commonly found in mature embedded dashboard implementations.
In-context integration
The dashboard should integrate naturally with the surrounding application, following the same navigation, layout, and visual design. A consistent interface helps users move between operational tasks and reporting without interrupting their workflow.
Real-time or scheduled data updates
Dashboards should retrieve current information through live connections or scheduled refreshes, depending on business requirements. Keeping reports synchronized with underlying data improves the reliability of operational and customer-facing reporting.
White-labeling and branding
Customer-facing deployments often require dashboards to match the application's visual identity. Support for custom logos, colors, typography, themes, domains, and navigation helps create a consistent experience. Learn more about white-label reporting tools.
Access control and security
Authentication methods such as Single Sign-On (SSO), along with role-based and row-level security, help ensure users can access only the reports and data appropriate to their permissions.
Performance and scalability
An embedded dashboard should remain responsive as data volumes, concurrent users, and reporting complexity increase. Efficient query processing and scalable architecture become increasingly important as deployments grow.
Interactive analysis
Features such as filtering, drill-down, sorting, searching, and cross-filtering allow users to explore data beyond predefined reports and investigate questions without creating new dashboards.
Responsive design
Dashboards should adapt to desktop, tablet, and mobile screens while preserving usability and core functionality across devices.
Self-service capabilities
Visual report builders and drag-and-drop design tools enable business users to create or customize dashboards with minimal technical assistance, reducing dependence on development teams for routine reporting changes.
The Best 3 Embedded Dashboard Tools in 2026
Choosing an embedded dashboard platform involves more than comparing visualization features. Integration options, customization, security, pricing, and long-term scalability all influence how well a platform fits your product. The following three platforms are among the most commonly evaluated for embedded dashboard deployments. For a broader comparison, explore our complete guide to dashboard tools.
1. Zoho Analytics
Zoho Analytics is designed for SaaS providers, ISVs, OEMs, and enterprises that need customer-facing dashboards with minimal implementation complexity. It supports white-labeling, live data connectivity, interactive dashboards, and flexible embedding through iFrames, REST APIs, and SDKs, making it suitable for organizations that want a complete embedded dashboard platform without building the underlying analytics infrastructure.
2. Microsoft Power BI
Power BI is a common choice for organizations that already use Microsoft services such as Azure, Microsoft Fabric, or Microsoft 365. Power BI Embedded supports customer-facing dashboards and integrates well within the Microsoft ecosystem, although branding flexibility, licensing, and long-term pricing should be evaluated before deployment. Learn more about how Zoho Analytics compares with Power BI.
3. Tableau
Tableau is widely recognized for its visualization capabilities and analytical flexibility. Tableau Embedded is well suited to organizations that require advanced visual analysis and extensive dashboard customization, though licensing models and total cost of ownership become important considerations as deployments scale. See how Zoho Analytics compares with Tableau.
When comparing embedded dashboard platforms, evaluate not only reporting features but also deployment flexibility, white-label capabilities, security, scalability, developer tooling, and the long-term cost of supporting customer-facing analytics.
Best Practices for Designing an Embedded Dashboard
An effective embedded dashboard presents information in a way that's easy to understand, supports the task at hand, and remains usable as data volumes and user needs evolve. The following practices can help improve both usability and long-term maintainability.
Design for specific user roles
Different users require different information. Rather than presenting every metric to every audience, create role-based dashboards that surface only the reports, KPIs, and actions relevant to each group. This keeps the interface focused and reduces unnecessary complexity.
Keep layouts simple and consistent
Arrange related information together and establish a clear visual hierarchy using spacing, alignment, and consistent sizing. Limiting unnecessary visual elements makes important information easier to locate and interpret.
Match visualizations to the data
Choose chart types that reflect the question being answered. Line charts work well for trends over time, bar charts support comparisons across categories, while pie or donut charts are generally better suited to showing proportions within a whole. Selecting appropriate visualizations improves readability and reduces the effort required to interpret results.
Use visual styling purposefully
Apply colors consistently, reserve accent colors for important changes or exceptions, and use typography to guide attention through the dashboard. A restrained visual design often communicates information more effectively than one with excessive styling or decoration.
Build security into the design
Security should be considered throughout the dashboard design process, not added after deployment. Role-based permissions, row-level security, and appropriate authentication controls help ensure users only see the information intended for them.
Keep information up to date
Dashboards are most valuable when they reflect current business conditions. Depending on operational requirements, use live connections or scheduled data refreshes so users can rely on the information presented.
Optimize for performance across devices
Test dashboards using realistic data volumes, concurrent users, and different screen sizes. Fast loading times and responsive layouts help ensure the dashboard remains usable across desktop, tablet, and mobile environments.
Organizations integrate dashboards into ERP, CRM, HRM, and finance applications so employees can monitor KPIs, operational performance, and departmental metrics while carrying out day-to-day work. This reduces reliance on separate reporting tools and recurring spreadsheet-based analysis.
How to Choose the Right Embedded Dashboard Solution
Choosing an embedded dashboard solution involves more than comparing feature lists. The platform should align with your product architecture, deployment model, security requirements, and long-term growth plans. Evaluating these areas early can help avoid costly migration or redevelopment later.
Integration and deployment
Review how the platform integrates with your application. Support for APIs, SDKs, authentication methods, and multiple embedding options can simplify implementation and provide greater flexibility as your product evolves (Know more about embed API).
Scalability
Consider how the platform performs as data volumes, users, and reporting requirements increase. A solution that works well during a proof of concept should also be able to support production workloads without requiring significant architectural changes.
User experience
Evaluate how users interact with the dashboard. Features such as filtering, drill-down analysis, responsive layouts, and intuitive navigation help make reporting easier to use across desktop and mobile devices.
Security and compliance
Confirm that the platform supports your organization's security requirements, including Single Sign-On (SSO), role-based access control, row-level security, encryption, and any industry-specific compliance standards relevant to your business.
White-label customization
If analytics will be customer-facing, assess the level of branding control available. Custom domains, themes, navigation, logos, and visual styling all contribute to delivering a consistent product experience (Know more about white-label BI).
Vendor support and total cost of ownership
Look beyond the initial subscription price. Compare implementation support, documentation, service-level agreements, pricing as usage grows, and the ongoing cost of maintaining the deployment over time.
Getting Started with Zoho Analytics
Choosing an embedded dashboard platform is as much about implementation as it is about features. Zoho Analytics combines flexible embedding options, white-label customization, interactive dashboards, AI-powered embedded analytics, and enterprise security within a single platform, making it easier to deliver customer-facing analytics without building the supporting infrastructure from scratch.
If you're evaluating an embedded dashboards solution for your application, explore how Zoho Analytics fits your product, deployment model, and reporting requirements with a personalized demo. You can also request a custom pricing quote based on your implementation needs.
Schedule a DemoGet a Price QuoteEmbedded Dashboard FAQs
How do embedded dashboards improve user experience?
They place analytics inside the tools people already use, so users find insight without switching applications or exporting data. This context keeps analysis next to the decision, reduces friction, and makes reporting feel like a natural part of the product.
What are the key components of embedded dashboards?
The core parts are live data connectivity, a customizable design that matches the host application, interactive controls like filtering and drill-down, access control and security, and API integration that keeps data flowing between the dashboard and its sources.
What are the popular data visualizations in embedded dashboards?
Common choices include line and bar charts for trends and comparisons, pie charts for parts of a whole, tables for detail, maps for location data, and gauges for tracking a single KPI against a target.
How do you design effective embedded dashboards?
Design for the specific user by showing only relevant data, keep the layout clean and uncluttered, choose charts that fit each question, use color and type with intent, and connect live data so insight stays current.
What are the use cases of embedded dashboards?
They appear in SaaS products, enterprise systems like ERP and CRM, customer portals, e-commerce platforms, and regulated fields such as healthcare and finance, giving users real-time insight inside the workflow where decisions are actually made.
Looking for a white-label dashboard solution we can embed inside our app. What should we consider?
When you are embedding dashboards inside your own app, the decision is mostly technical, not cosmetic. Branding matters, but the factors that determine whether the embed holds up are the integration method, how authentication passes through, and how the solution isolates data per user. Work through these in order:
Integration method:iframe for the fastest path, a JavaScript SDK for tighter interaction with the rest of your app, or an API for full control over rendering and provisioning. Choose by how deeply the dashboards need to react to actions elsewhere in the product(Know more about embedded dashboards).
Per-user data isolation:Role-based access enforced server-side, so each user sees only their own rows. In a multi-tenant app this is a security control, not a display setting.
Native theming and branding:Dashboards should inherit your app's fonts, colors, and layout, with vendor branding removed and the whole thing served from your domain, so users read it as part of the product.
Performance at scale:Confirm how the embed behaves as concurrent users climb, not just in a single-viewer demo.
Performance at scale:Confirm how the embed behaves as concurrent users climb, not just in a single-viewer demo.
Maintenance and stability:Check whether platform updates can break your embed, and whether the API is versioned, since a breaking change to embedded analytics is expensive to chase down later.
Zoho Analytics covers this stack: embedding through iframe or API, single sign-on, role-based access for tenant isolation, white-label theming on your own domain, and connectivity to 500 or more data sources so the embedded dashboards can draw from whatever your app already uses.
What's the best way to deliver embedded dashboards inside a customer portal?
- iframe embedding with signed URLs: The fastest route. Each dashboard loads through a secure, permission-scoped URL, so a customer sees only their own data. Best when you need to ship quickly without deep front-end work.
- JavaScript SDK embedding:Loads dashboards directly into your portal's front end for tighter interaction and custom event handling. Best when the dashboards need to respond to actions elsewhere in the portal(Know more about embedded reporting tool).
- API-driven white-label embedding:Full control over rendering, theming, and user provisioning. Best for multi-tenant SaaS portals that need dashboards to look native and scale across many customer accounts(Know more about embedded analytics architecture).
The best way to deliver embedded dashboards inside a customer portal is to embed them through a secure, tokenized method that authenticates each user, isolates their data, and matches the dashboards to your portal's design. Three delivery options cover most portal scenarios:
Whichever method you choose, four things determine whether the delivery holds up in production: row-level security to keep tenant data separate, single sign-on so users aren't asked to log in twice, theming that inherits your portal's fonts and colors, and a hosting model that scales with your customer count(Know more about embedded analytics for SaaS).
Can you suggest customer-facing analytics tools that can be embedded into our SaaS platform?
Customer-facing analytics platforms should support secure embedding within a multi-tenant product. The important question is whether authentication, data permissions, and tenant separation continue to work after analytics is placed inside your application. Also consider how much control developers have over the experience. Some products need complete dashboards, while others need individual charts or more customized analytics interfaces. Zoho Analytics supports customer-facing embedding and access controls designed to restrict users to the data available to them.
What are the best survey reporting tools for creating branded, white-label client reports?
Survey platforms collect responses well, but their built-in reporting is rarely brandable or flexible enough for client delivery. For branded, white-label survey reports, pair your survey tool with an analytics platform that owns the reporting layer. Look for three things: connectivity that pulls survey responses in automatically, white-label reporting across logo, colors, and domain, and self-service dashboards each client can explore on their own. Zoho Analytics brings survey data from Zoho Survey and other tools into live, branded dashboards, so agencies and research firms report under their own name instead of exporting static charts. You can blend survey results with other client data and schedule branded reports automatically. For analytics embedded inside a product, the same reports work as embedded dashboards or through an embedded reporting tool.
Can you suggest customer-facing analytics tools with enterprise-grade security?
Start with the security and compliance requirements your own customers expect you to meet. Verify how a vendor handles authentication, authorization, encryption, auditing, and tenant separation, then check which certifications apply to the service and deployment you plan to use. For regulated deployments, requirements may also include data residency or industry-specific controls. Zoho Analytics provides role-based and data-level access controls, SSO, and additional security and governance capabilities. Verify individual certifications and compliance requirements against Zoho’s current documentation before procurement.
How much control do developers get over embedded analytics?
The first choice is what you embed. Zoho Analytics lets developers embed a complete dashboard or a single view, including individual charts, pivots, tabular views, and query tables. So you can place a full dashboard on a reporting screen and drop one chart into a different part of the app, both from the same platform, rather than being forced to embed everything as one block.
The second choice is how deeply it integrates. iframe embedding places a dashboard through a URL and is fast to implement, with more limited customization. The Embed API and JavaScript SDKs let developers embed dashboards with deeper control, so the analytics behave like a native component and match your product's theme and interactions.
Access is controlled per embedded view through role-based and row-level permissions, so each user sees only the data they should. For the full detail on enforcing separation across many customer accounts, see embedded analytics for SaaS.