
In this article
- What is Collaborative BI?
- Why your business needs Collaborative BI
- Evolution from Traditional BI to Collaborative BI
- Core benefits of implementing Collaborative BI
- Must-have features for a modern Collaborative BI tool
- Top Collaborative BI tools in 2026
- How to implement Collaborative BI and foster adoption
Key takeaways
- Collaborative BI connects people, data, and decisions in one unified platform, enabling all teams to explore data, discuss, and act on insights together in real-time.
- It removes data silos, and makes analytics accessible to everyone, from executives to frontline teams.
- The right collaborative BI tool transforms analytics into a shared, real-time experience.
- Features like shared workspaces, real-time comments, controlled access, and AI-assisted insights empower teams to move from insights to action faster.
- Zoho Analytics delivers an end-to-end collaborative platform, helping teams co-create, share, and act on insights effortlessly within a secure, enterprise-ready environment.
What is Collaborative BI?
Collaborative Business Intelligence (Collaborative BI) is an analytics approach that connects people, data, and decisions in one platform. Teams across departments can work on the same data, comment on dashboards, share reports, and act on findings together - without exporting files or switching tools.
Most BI tools were built for analysts. Everyone else waited for the report to arrive. Collaborative BI changes that. Executives, sales reps, operations leads, and frontline employees can all interact with the same data, ask questions directly on a dashboard, and make decisions without going through a reporting queue.
Why Your Business Needs Collaborative BI
Here's what typically happens. A sales team exports data from Salesforce, finance pulls numbers from QuickBooks separately, and both reports don't match by end of quarter. Someone spends two days reconciling. The meeting gets delayed. The decision waits.
That's a data silo problem. And it's more common than most organizations admit.
A 2024 survey by Dresner Advisory Services found that 44% of organizations already use some form of collaborative analytics, with another 37% planning to adopt it within two years. [Source: Dresner Advisory Services, Wisdom of Crowds BI Market Study].
With collaborative Business Intelligence you can:
- Pull every stakeholder into one shared analytics workspace - no more "which version is correct" conversations.
- Speed up decisions by discussing data in context, not in a separate email thread three levels removed from the actual number.
- Give operations, sales, and leadership access to the same figures at the same time.
Evolution from Traditional BI to Collaborative BI
Business intelligence has come a long way - from static reports to interactive, team-driven analytics. Traditionally, BI was limited to analysts and IT teams who generated reports for others. This created delays, bottlenecks, and disconnected insights.
From isolated insights to shared decisions
Traditional BI ran on a specific workflow: an analyst gathers data, builds a report, and sends it out. The manager reads it, has questions, and waits for the next version to find the answers.
The cycle takes days. Sometimes weeks. By the time the decision gets made, the data is already old.
That model made sense when collecting and analyzing data was expensive and slow. It doesn't anymore. Teams generate data constantly from CRMs, ad platforms, finance tools, support tickets, and spreadsheets, and the window to act on it is short.
Why the old setup no longer works
Most BI tools were designed for one-directional reporting. An analyst builds a report. It goes to leadership. Leadership looks at it once. Nobody adds context. Nobody updates it when conditions shift midweek.
Meanwhile, the marketing team is working from a different dashboard. Operations has its own spreadsheet. When those three sets of numbers show up in the same meeting, someone has to explain why they don't match, and that conversation eats the rest of the hour.
The data exists. Getting everyone to trust the same version of it is where things break down.
What collaborative BI changes
Teams can share dashboards inside the platform. Comments and questions go directly on the chart or metric they relate to. When a revenue number spikes, the discussion about what happened, happens on that number and not in a chat thread where the context is already gone.
Instead of exporting reports or waiting for approvals, teams can:
- Share dashboards across departments without attaching PDFs to emails.
- Comment and discuss findings on the data itself.
- Make decisions based on the same numbers, not parallel versions of them.
Core Benefits of Implementing a Collaborative BI Strategy
The challenge
In most organizations, data lives in silos. Teams create their own reports, interpret numbers differently, and make isolated decisions. This disjointed approach slows down response times, causes inconsistencies, and creates confusion instead of clarity - leading to missed opportunities.
The solution
A collaborative business intelligence strategy breaks down these barriers by uniting analytics, communication, and action in one connected workspace. Teams can explore data, share insights, and discuss outcomes in real-time, all within the real-time BI platform - without switching between tools or relying on email threads. This unified approach ensures that everyone is working with the same context and clarity.
The outcome
A collaborative BI strategy leads to results that are both immediate and measurable. When teams work from shared insights, decision cycles speed up significantly, removing delays that often stall execution. Studies show that companies leveraging collaborative BI experience over 40% improvement in team productivity and responsiveness.
This shared visibility strengthens coordination across departments, leading to smoother operations and more reliable, insight-driven decisions. Many businesses also report over 30% gains in operational efficiency, as teams shift from isolated analysis to unified action. With everyone working in sync, organizations achieve stronger outcomes, quicker responses, and smarter decisions that directly impact growth.
Collaborative BI doesn't just make analytics more social - it makes it more strategic. When people come together around data, they act faster, align better, and make smarter decisions that drive measurable business growth.
Here's how different teams benefit from collaborative BI:
- Leadership: Gain a complete view of performance across departments and ensure every decision aligns with business goals.
- Analysts: Save time by sharing contextual insights directly within dashboards, reducing back-and-forth requests and repetitive reporting.
- Operations: Collaborate in real-time to identify inefficiencies, optimize processes, and act on KPIs faster.
- Sales and Marketing: Work together using shared campaign dashboards to measure ROI, improve targeting, and boost conversion rates.
- Everyone: Access insights, comment, and co-create reports, making analytics a team-driven experience.
By integrating collaboration into every stage of the analytics process, businesses turn BI from a reporting software into a powerful decision-making ecosystem - one that drives alignment, agility, and measurable growth.
Must-Have Features for a Modern Collaborative BI Tool
A lot of BI tools call themselves collaborative. Most of them mean you can share a link. Here's what real collaboration looks like in practice, and what to check before you commit to a platform.
- 1. Real-time collaboration
- 2. Role-based access and controlled sharing
- 3. Single unified workspace
- 4. Built-in communication capabilities
- 5. Version control and audit tracking
- 6. Integration with everyday apps
- 7. AI-powered insights and automation
- Why these features matter
1. Real-time collaboration
Teams should be able to comment directly on a dashboard widget - not export the chart and paste it into Slack with a note attached. When revenue spikes in a particular month, the conversation about "why" should happen on that metric, not separated by three tool switches.
2. Role-based access and controlled sharing
Not every team member needs edit access. A finance team might need view-only access to a sales dashboard. An external stakeholder might need access to one report but nothing else. Fine-grained permissions keep data accurate while making it visible to the people who need it.
3. Single unified workspace
If sales pulls from Salesforce and marketing pulls from HubSpot and neither feed connects to the same environment, collaboration breaks at the data level before it even begins. Look for a platform that brings all sources into one place.
See how business intelligence reporting works across connected data sources.
4. Built-in communication capabilities
When discussion moves outside the BI tool, into email, into Slack, into a separate document, the context gets separated from the data. A comment attached to a chart stays useful. The same comment in a chat thread three days later doesn't. Built-in communication keeps the conversation tied to what it's actually about.
5. Version control and audit tracking
When a report changes, teams need to know what changed, who changed it, and when. This isn't just about accountability, it's about being able to trace a number back to its source when someone questions it in a board meeting.
6. Integration with everyday apps
Slack, Microsoft Teams, Zoho Cliq, Google Workspace - if insights can't reach the platforms people already check, they won't get acted on. Integration isn't optional. It's how insights move from the BI platform into actual workflow decisions.
7. AI-powered insights and automation
Natural language queries let non-technical users ask questions in plain English like "What were our top 5 products by revenue last quarter?" without writing SQL or waiting for an analyst. Automated alerts flag anomalies before anyone catches them manually. This is an area where AI business intelligence tools are changing how non-technical teams interact with data.
Why these features matter
When these features are in one platform, discussion stays attached to data. Teams don't need to reconcile context from different tools. That's when collaboration actually moves decisions instead of just making them feel more social.
Top Collaborative BI Tools in 2026: A Comparison
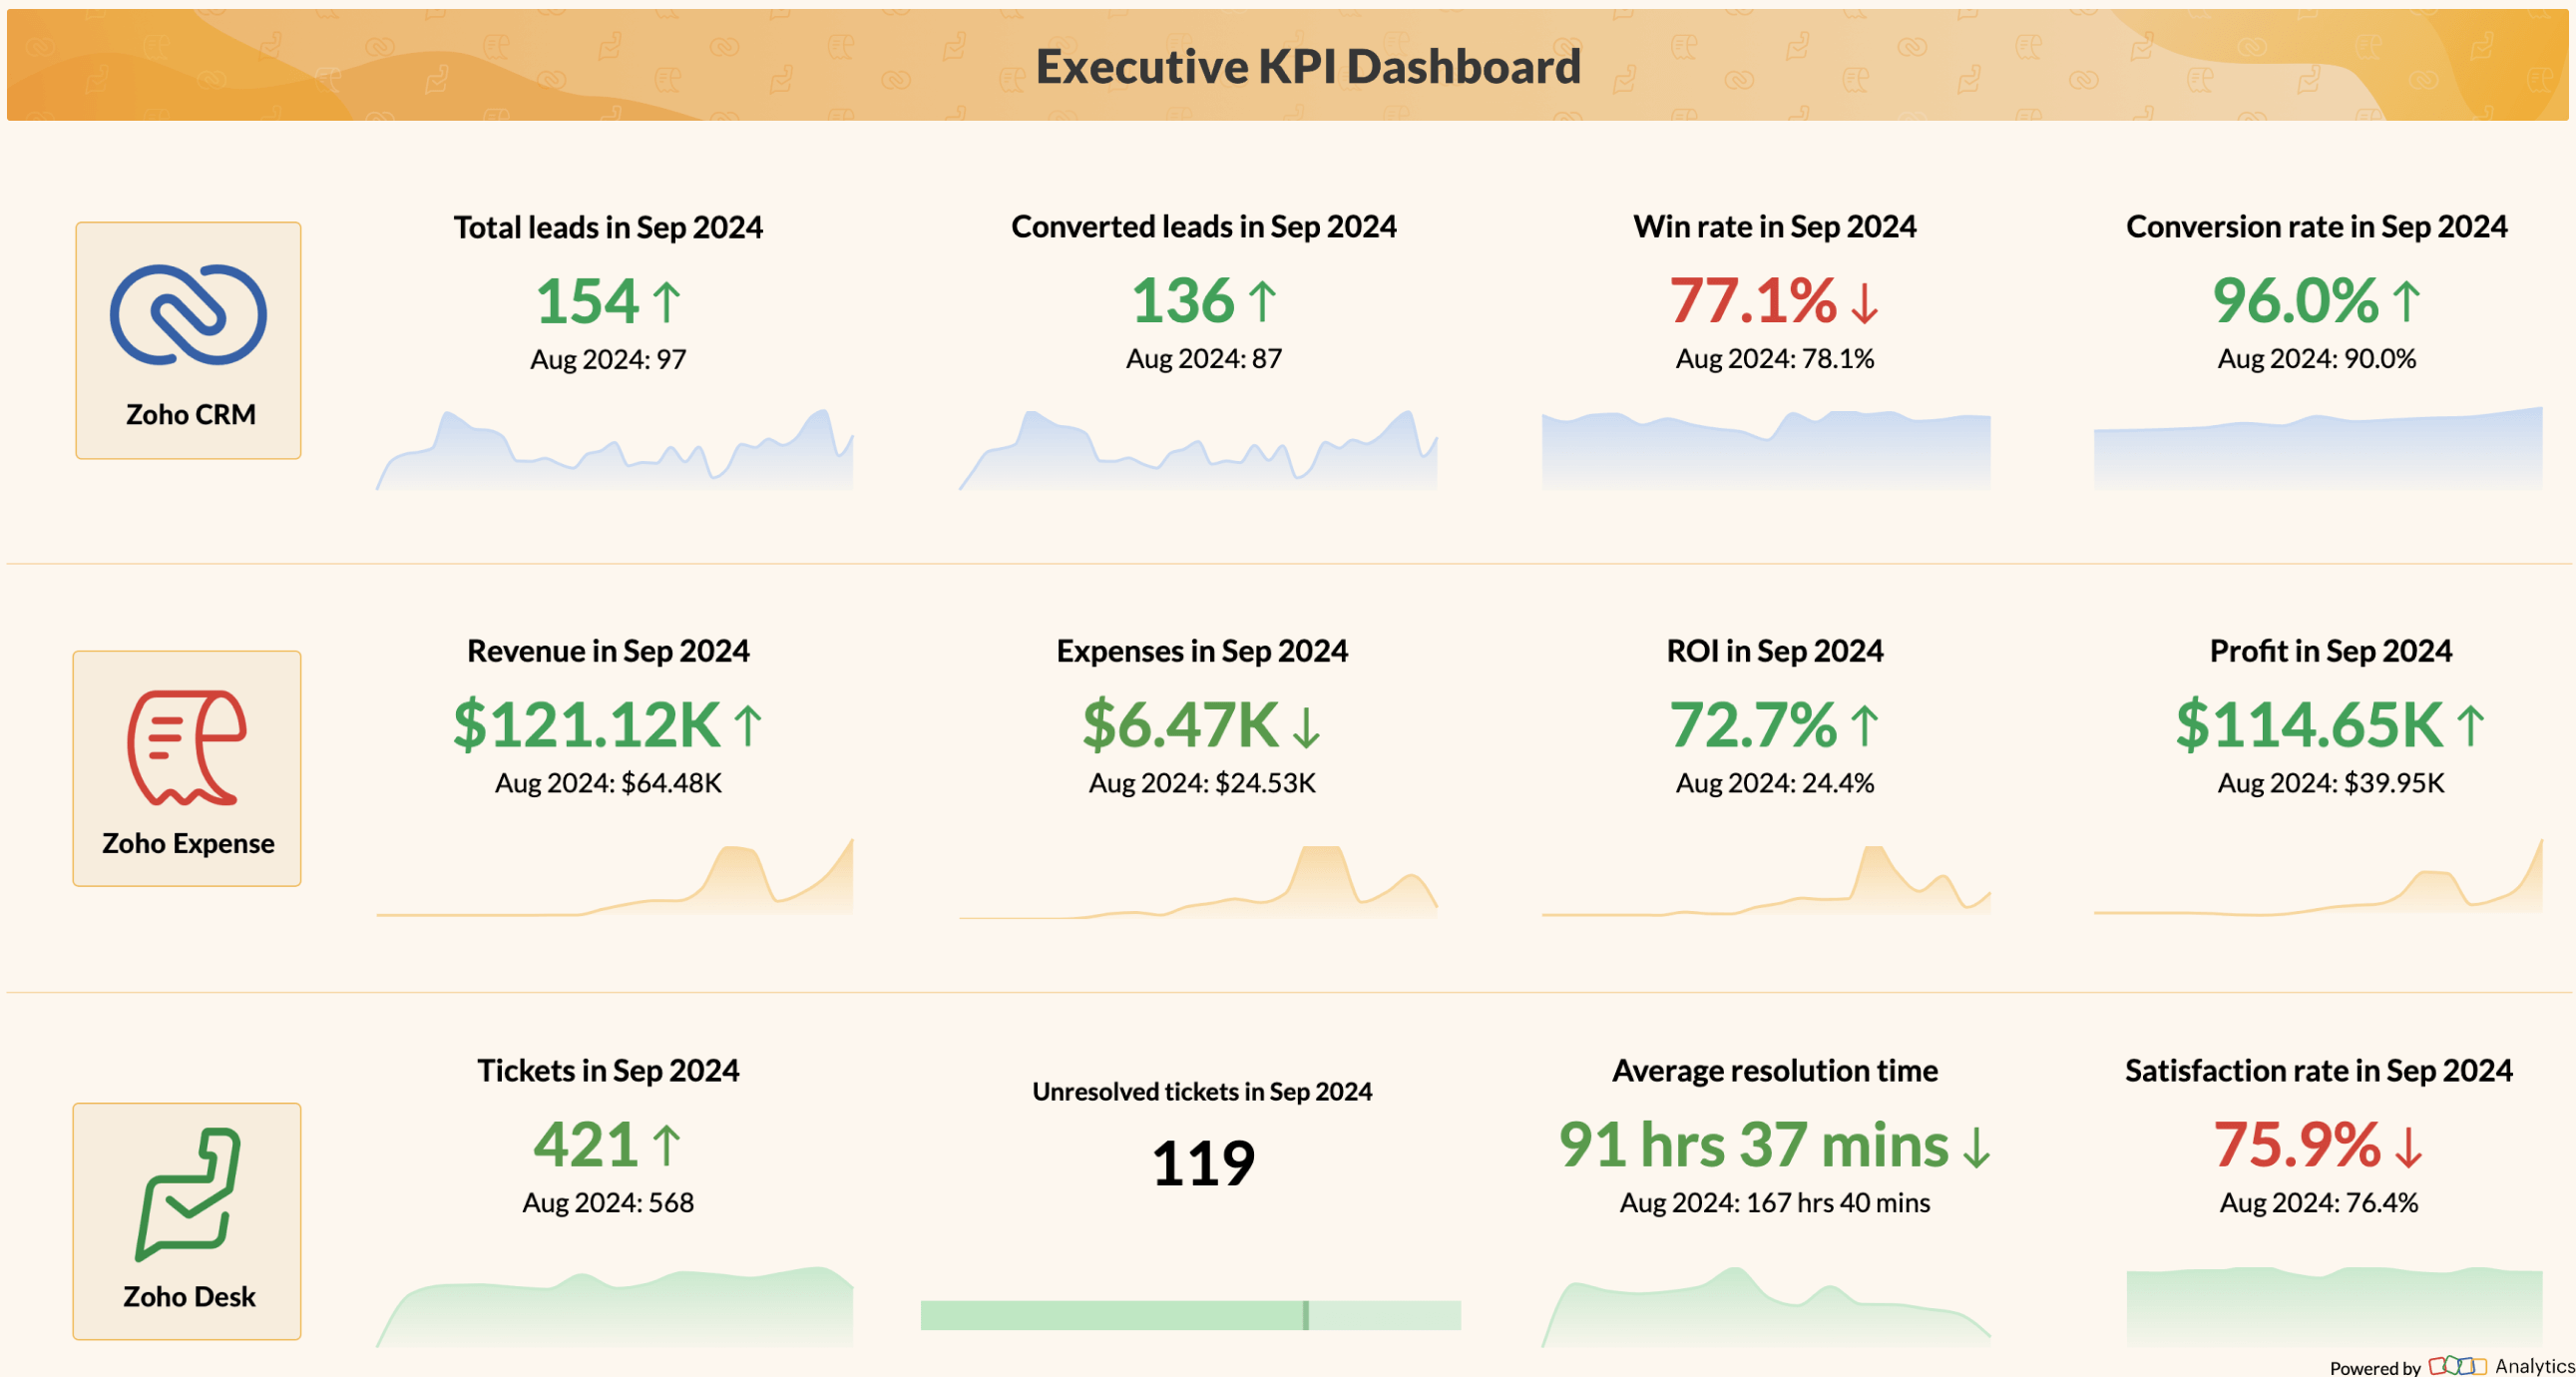
Zoho Analytics
Zoho Analytics is a self-service BI platform where teams can discuss data inside the platform. No need to export a chart and paste it elsewhere, comments go directly on dashboards, and access is controlled at a granular level, so you can share a sales report with external stakeholders without giving them access to everything else.
The AI assistant, Zia, handles natural language queries, automated reports, and anomaly detection. For teams that want one place to connect data sources, build reports, and discuss findings, Zoho Analytics covers the full workflow.
Best for: Growing businesses and enterprises that want self-service analytics with built-in collaboration and strong access control.
Learn more about how BI dashboards support team-based reporting in Zoho Analytics.
Microsoft Power BI
Power BI works well inside the Microsoft ecosystem. If your team already uses Teams, Excel, and SharePoint, the integration is close. Comments and annotations work inside dashboards, and the security model is enterprise-grade. But it gets harder to use outside Microsoft tools since the experience is built around that ecosystem.
Best for: Organizations already on Microsoft 365 that want a BI tool with proven enterprise security and native integration with Teams and Excel.

Explore the full comparison between Zoho Analytics and Power BI
Tableau
Tableau's data visualization capabilities are ahead of most competitors. The chart types, flexibility, and handling of large datasets make it strong for teams that need to explore data visually. Collaboration features like comments, shared views, permission-based publishing are solid. But Tableau is not the cheapest option, and the learning curve for building advanced reports is real for non-technical users.
Best for: Organizations where visualization quality is the priority and teams include both technical analysts and business users.

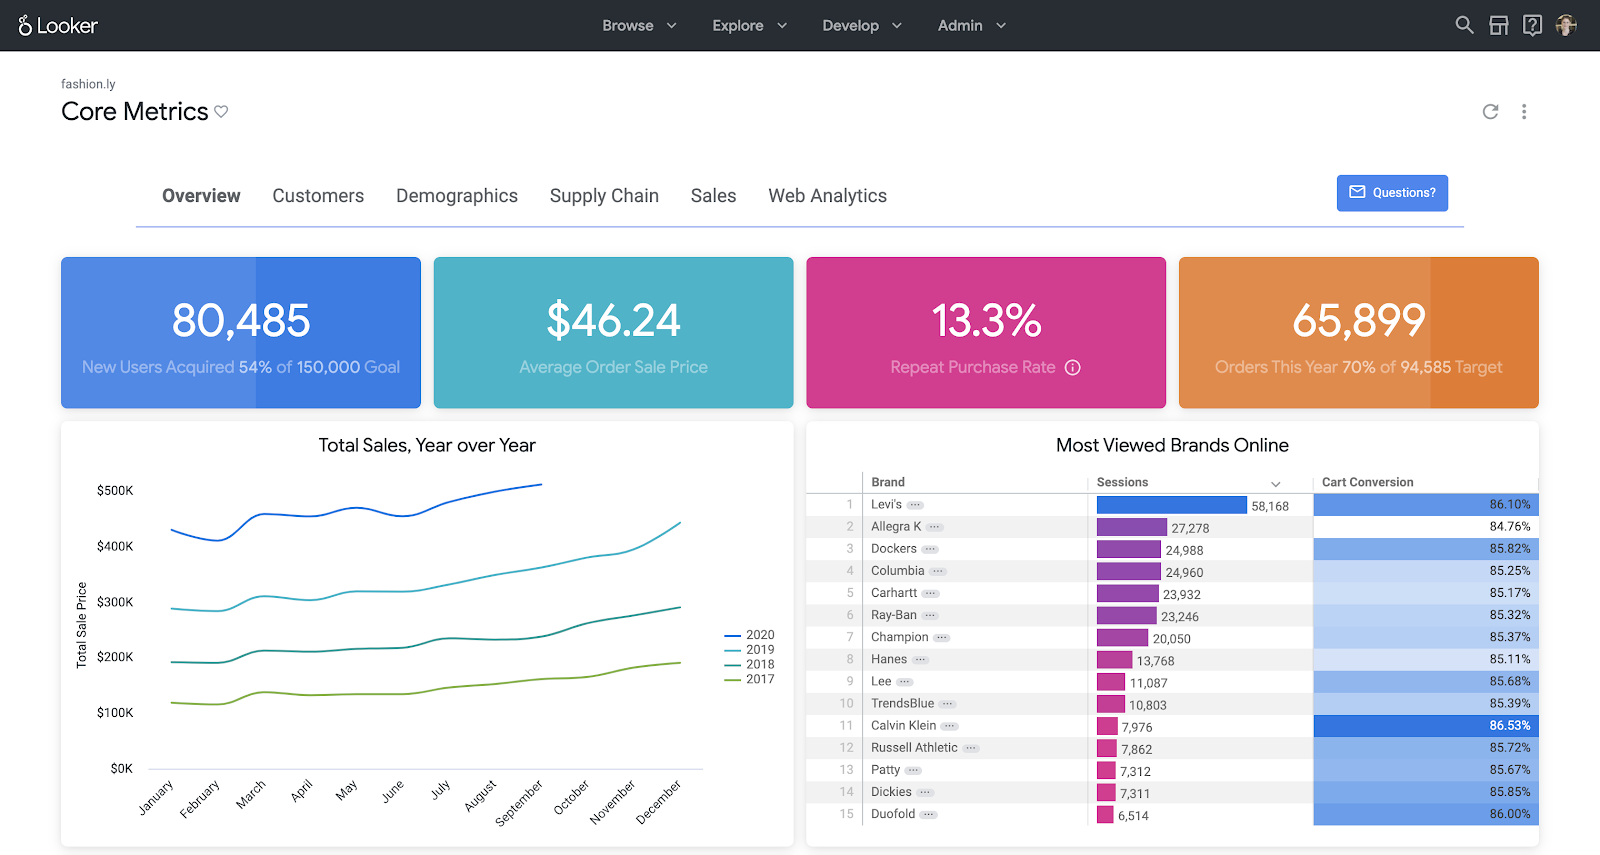
Looker
Looker's data governance model is its main advantage. LookML means everyone queries the same definitions - no debate about what "active customer" across finance, sales, and marketing. Integration with Google Workspace is tight, and if your data infrastructure is on Google Cloud and BigQuery, Looker is worth a serious look.
Best for: Companies on Google Cloud that need strong data governance alongside collaborative access.
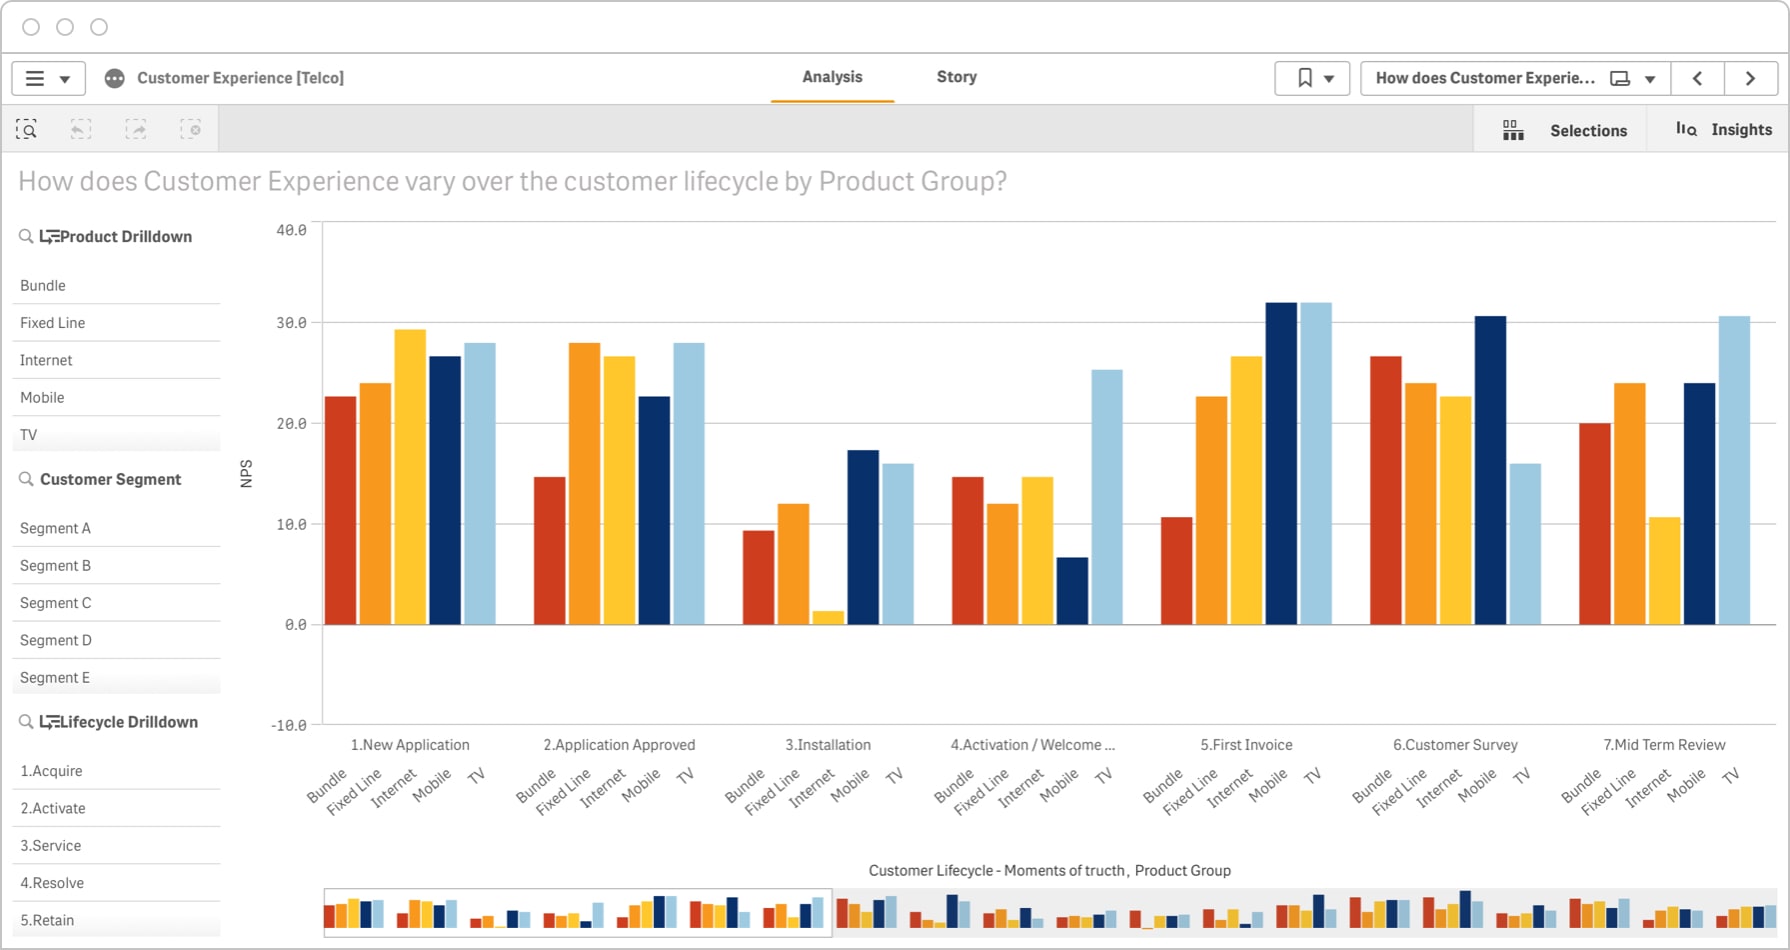
Qlik
Qlik's associative engine lets users explore connections across datasets that other tools might not surface. Click on one data point and see everything related to it across your entire dataset. Collaboration happens through shared boards and notes inside Qlik Cloud.
Best for: Mid to large organizations that want flexible data exploration with centralized management
Check out the full comparison between Zoho Analytics and Qlik
For a broader look at how these platforms compare, see our full guide on how to choose the right BI tool for your team size and data stack.
Quick comparison: Collaborative BI tools
Here is a quick comparison between the Collaborative BI tools:
| BI tool | Collaboration features | Sharing and access | Version control | Best for |
|---|---|---|---|---|
| Zoho Analytics | Built-in comments, in-context discussions | Shared workspaces with granular permissions | Full revision history | Teams that want end-to-end collaborative business intelligence |
| Microsoft Power BI | Collaboration via Microsoft Teams and dashboard comments | Shared workspaces (Microsoft ecosystem) | Basic versioning | Organizations using Microsoft 365 |
| Tableau | Dashboard comments, shared views | Projects & folder-based sharing | Limited revision history | Teams focused on visual data storytelling |
| Looker | Real-time collaboration through governed models | Shared spaces; deep Google Workspace integration | Git-powered version control | Companies needing strong data governance |
| Qlik | Notes, shared boards & discussions | Shared collections | App-level version history | Teams wanting flexible, associative exploration |
How to Implement Collaborative BI and Foster Adoption
Getting a BI tool in place is the easy part. Getting teams to actually use it together and trust the numbers it shows takes more planning.
Here's what works in practice:
- 1. Agree on what you're measuring before anyone opens a dashboard
- 2. Connect all your data sources into one environment
- 3. Choose a platform where discussion stays inside the data
- 4. Make it easy for non-technical users
- 5. Start with the people already drawn to data
- 6. Treat the setup as something that changes over time
1. Agree on what you're measuring before anyone opens a dashboard
If sales counts a "closed deal" at contract signing and finance counts it at payment clearing, no platform fixes that disconnect. Document your core KPIs, assign ownership, and make sure every team that touches those numbers uses the same definitions. This is the foundation everything else depends on.
2. Connect all your data sources into one environment
Collaborative BI only works when everyone looks at the same data. Connect your CRM, ad platforms, finance tools, support ticketing system, and any other data sources into a single environment. This is what removes the "which version is correct" conversation from your meetings.
If you're bringing data together from cloud-based sources, see how cloud BI makes that easier without heavy IT involvement.
3. Choose a platform where discussion stays inside the data
Look specifically for shared dashboards, built-in comments and annotations, role-based access control, and automated alerts. When discussion moves to email or chat, the context separates from the data and the collaboration breaks.
For a full list of what to check, see our breakdown of features in modern BI tools.
4. Make it easy for non-technical users
Adoption drops sharply when the tool feels like it was built only for analysts. Offer ready-to-use dashboard templates for common use cases. Use AI-powered analytics with natural language queries so people can ask questions in plain English. Show teams how to tag a colleague on a metric and that alone changes how people think about data as a shared resource.
5. Start with the people already drawn to data
Every organization has a handful of people who naturally look for data before making a decision. Give them the tools, let them build interactive dashboards their teams actually use, and let that spread. Mandated adoption rarely sticks the same way organic adoption does.
6. Treat the setup as something that changes over time
Metrics shift. Priorities change. A dashboard that was central in Q1 might be unused by Q3. Set a quarterly review of your most-used reports. Ask teams what's missing, what's confusing, and what they've stopped opening. That feedback is what keeps the environment relevant.
Start Your Collaborative BI Journey with Zoho Analytics
Collaboration is where true data intelligence begins - and Zoho Analytics makes it effortless. Break down data silos, connect every department, and empower teams to explore insights together in real-time. Turn every dashboard into a space for meaningful discussion and data-driven decisions with:
- Built-in commenting
- Easy sharing
- Role-based access
Frequently Asked Questions
What is collaborative BI?
Collaborative BI is a way of working with analytics where teams interact with data together inside one platform. Users can share dashboards, comment on specific metrics, discuss findings, and act on insights without switching to email or a separate chat tool.
What is the difference between traditional BI and collaborative BI?
- Traditional BI: Traditional BI tools produce reports that move from analyst to stakeholder in one direction. The stakeholder reads the report, has questions, and waits for the next version to find answers.
- Collaborative BI: Collaborative BI makes that process two-way. Anyone can open the dashboard, ask a question directly on the data, tag a teammate, and get an answer - inside the same platform where the report lives.
What are the key benefits of using a collaborative BI tool?
- Four things change when teams use collaborative BI:
- Decisions happen faster because questions get answered in context, not through email chains.
- Everyone works from the same numbers, which removes the version-conflict problem.
- Non-technical users can explore data directly without waiting for an analyst.
- Accountability improves because comments and changes are logged against the specific data they relate to.
Which BI tool is best for collaboration?
- Zoho Analytics, Power BI, Tableau, Looker, and Qlik all have collaborative features. But the best tool for collaboration is Zoho Analytics because of it's deepest built-in collaboration, threaded comments, granular permissions, full revision history, and in-context discussions, without requiring a Microsoft or Google subscription as a prerequisite. Power BI is the stronger choice if your team is already inside Microsoft 365. Tableau is better when visualization quality is the top priority.
Which BI tool offers collaborative commenting and version history?
- Most major tools include basic commenting. Zoho Analytics goes further with threaded comments, activity , version tracking, and fine-grained sharing permissions. Looker has Git-powered version control. Power BI has basic versioning tied to its workspace model. Tableau has limited revision history through its project and folder structure.
How do you create a collaborative analytics environment?
- To create a collaborative analytics system, start with shared KPI definitions. Connect your data sources into one platform. Choose a BI tool where discussion happens on the data and not in a chat app running parallel to it. Set role-based access so the right people see the right data. Then review and update the setup quarterly based on what teams are actually using and what they've stopped opening.