• 16K

    Customers

  • 3M

    Users

What is Business Intelligence?

Business Intelligence (BI) is the art of transforming raw data into clear, actionable insights that guide smarter decisions. It's where numbers become narratives by connecting the dots across your organization, right from sales and marketing to finance and operations, to show you not only what's happening in your business, but why it's happening and what step to take next.

Imagine BI as your organization's sense of sight. It collects information from multiple sources, organizes it, and turns it into intuitive dashboards, reports, and visual stories. With this unified view, you can uncover hidden trends, monitor performance in real-time, and plan confidently for the future.

Today's modern BI tools go beyond static reports. They use automation, AI, and predictive analytics to highlight anomalies, recommend actions, and make data exploration effortless for everyone, not only data experts.

Simply put, Business Intelligence transforms data into direction, helping businesses of every size see clearly, act decisively, and grow intelligently.

Illustration showing how Business Intelligence transforms data into actionable insights and visual reports

Want to see how BI looks in action? Explore an interactive BI demo

Book a demo

How does Business Intelligence work?

Business Intelligence follows a simple yet powerful flow. An end-to-end process that turns raw data into actionable insights. It brings information from across your organization into one unified space, and transforms it into visuals that drive confident decisions.

Connect your data

Start by bringing in data from different sources like spreadsheets, business apps, databases, and cloud services into a single, unified workspace.

Prepare and transform

Cleanse, blend, and organize the imported data. Remove duplicates, correct inconsistencies, and create meaningful relationships between datasets to ensure accuracy.

Analyze and visualize

Explore your data through reports and dashboards. Identify patterns, track key metrics, and discover trends that reveal the hidden patterns through interactive data visualizations.

Get instant insights

Built-in intelligence identifies anomalies, highlights key changes, and predicts outcomes, helping you make informed, proactive decisions.

Diagnostic insights dashboard showing contextual alerts and instant business intelligence

Share and collaborate

Securely share dashboards, schedule reports, and enable real-time collaboration across teams and keep everyone aligned and data-driven.

Business Intelligence collaboration dashboard showing team sharing and real-time data collaboration

Traditional BI vs Modern BI: Comparison

Business Intelligence has come a long way from being a tool used only by data experts to becoming a self-service platform that empowers everyone in an organization to make informed decisions.

Aspect
Traditional BI
Modern BI
AccessibilityControlled by IT teams, with limited user accessAccessible to everyone through self-service dashboards and visual tools
DeploymentOn-premises with complex infrastructureCloud-first, flexible, and scalable
SpeedSlow and static. Insights delivered after processingReal-time dashboard with interactive reports for instant insights
TechnologyManual data preparation and static analysisAI-driven insights, automated data prep, and predictive analytics
CollaborationReports shared manually via emailsCollaborative dashboards, alerts, and contextual discussions
CostExpensive licensing, upgrades, and maintenanceAffordable, subscription-based pricing models
ScalabilityHard to scale and maintainScales easily with growing data and user needs

Traditional BI focuses on "what happened". Modern BI focuses on "why it happened" and "what to do next".

The benefits of Business Intelligence

Improved decision making

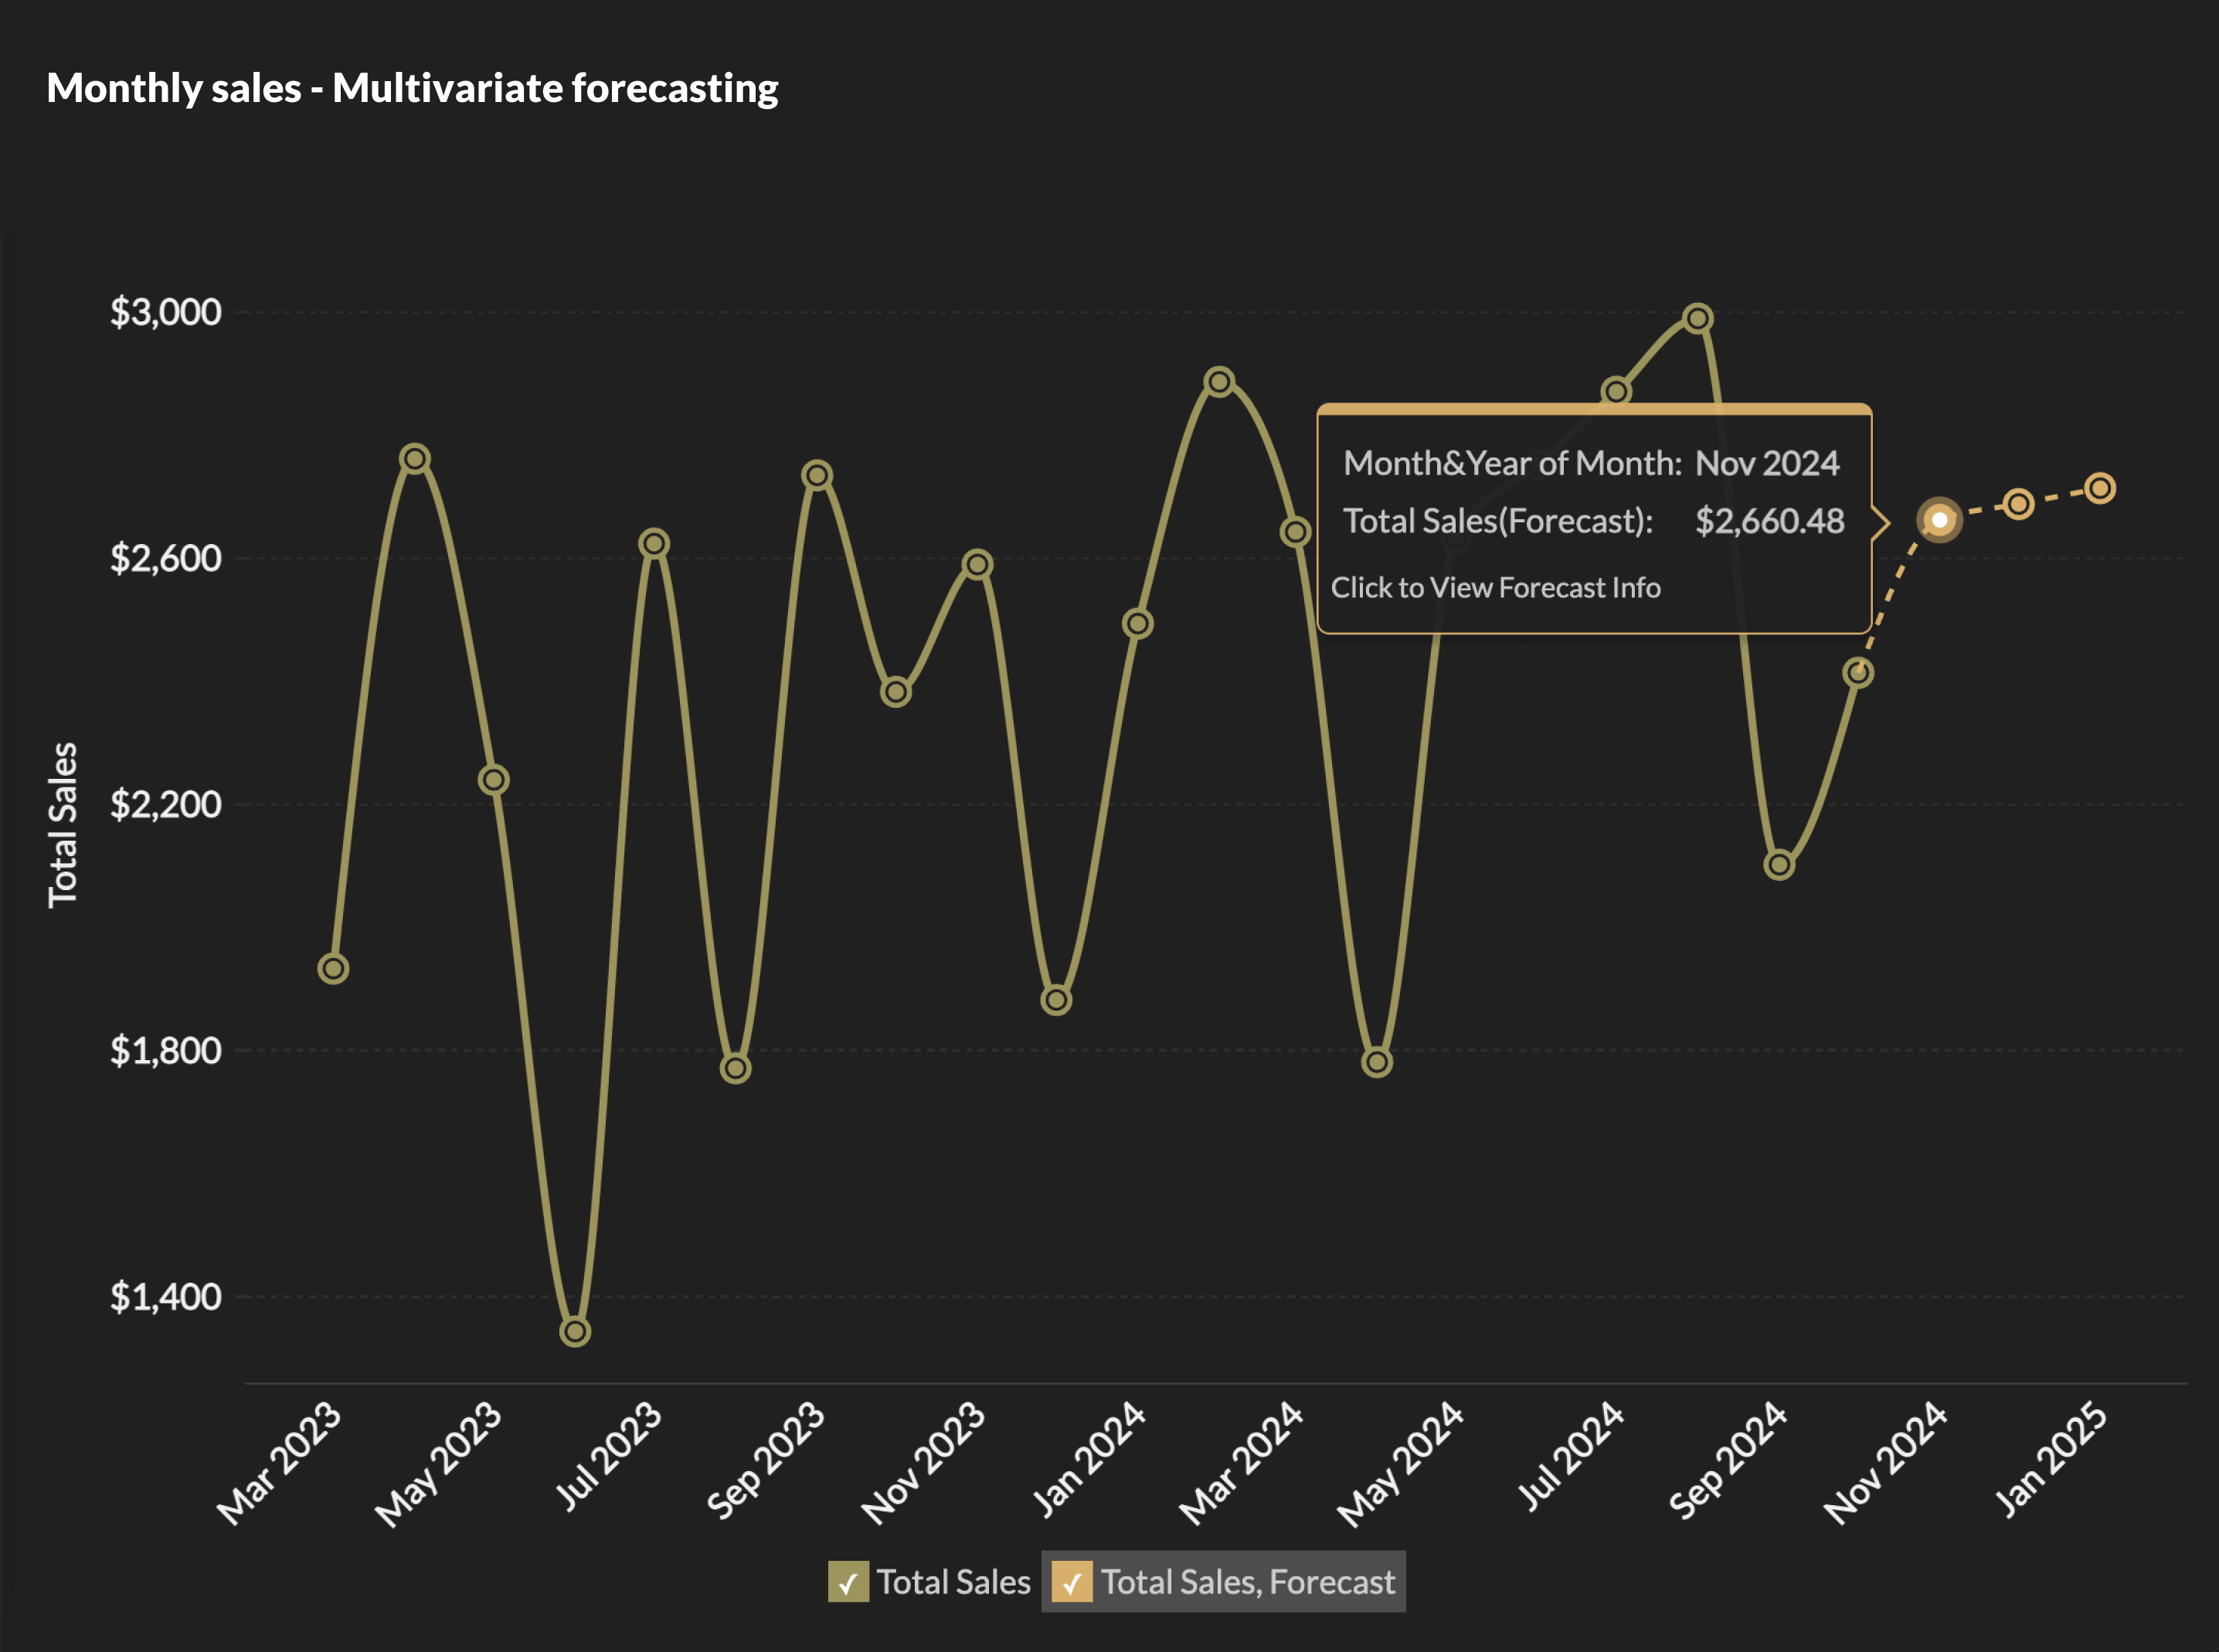
BI removes the guesswork from decision-making. With real-time dashboards, you get a unified view of your sales, revenue, and customer trends. Predictive analytics helps you forecast demand, allowing you to plan smarter and act faster.

Enhanced efficiency and productivity

No more manual reports and time-consuming data pulls. BI automates the entire process and gives teams more time to focus on what matters most - solving problems and driving impact. Interactive dashboards keep everyone on the same page, reducing reliance on IT teams.

Better customer insights and personalization

Your customers are constantly telling you who they are through their actions, feedbacks, and choices. BI helps you listen and connect the dots to uncover what they love, what they need, and how they feel. This allows you to personalize experiences, run targeted campaigns, and support customers with speed and agility.

Increased revenue and cost savings

When you can see where your money comes from and where it's wasted, growth becomes intentional. BI highlights your best-performing channels, suggests pricing optimizations, and uncovers hidden expenses. Every insights becomes an opportunity to improve profitability.

Strong risk management and compliance

BI keeps an eye on what you might miss. It detect anomalies in financial data, flags compliance issues, and identifies risks in supply chain operations early before they escalate. With transparent reporting and automated monitoring, you can maintain compliance and safeguard your business reputation effortlessly.

Competitive advantage

Market shifts fast. but BI helps you stay ahead. By tracking customer behavior, market trends, and competitor activities, it ensures you're always informed and ready to act. With the right insights at the right time, you can seize new opportunities before others even see them coming.

Whether your goal is to enhance productivity, elevate customer satisfaction, cut expenses, or boost profits, BI tools offer the right solutions.

Hear from our happy customers

See all testimonials
Photo of Rupendra Nigam, Vice President of IT, Spykar Lifestyles
Rupendra Nigam
Vice President of IT, Spykar Lifestyles

"We have good visibility on the exact stock levels in each of the leading multi-branded stores across India on any typical day. These were not possible before."

Photo of Daniel Franey, Director & Shareholder, Courier Logistics Limited
Daniel Franey
Director & Shareholder, Courier Logistics Limited

"With Zoho Analytics, the ability to visualize things became easy. Most of my managers now use Zoho dashboards and quickly create reports themselves."

Photo of Filip Goossens, CEO & MD of ON TIME Logistics
Filip Goossens
CEO & MD of ON TIME Logistics

"Zoho Analytics is very easy to set up and easy to learn. It got us quick results and it has a very intuitive user interface."

Photo of Greg Szabo, Co-founder and Operations Manager, Package Mate
Greg Szabo
Co-founder and Operations Manager, Package Mate

"Zoho Analytics integration is very smooth. I found no hindrance while integrating other apps with Zoho Analytics."

Photo of Ben Smith, advisor and former COO of Sugarfina
Ben Smith
advisor and former COO of Sugarfina

"Zoho Analytics is the only product with the right mix of cost and value—with features like data visualization, integration, data blending, collaboration, user filters, drag and drop, geomaps, and much more at an affordable price."

Photo of ED Levis, Head of IT, NYC Navigator
ED Levis
Head of IT, NYC Navigator

"Data visualization is important for any BI tool. It's great to present data in a way that is meaningful to the audience, helping them quickly grasp the content. That's where Zoho Analytics is very strong. We now analyze our sales, operations, and finance using Zoho Analytics."

Broad goals of Business Intelligence software and tools

Business intelligence is not only about analyzing data. It's about creating clarity across the organization for smarter, faster, and more aligned decision-making. Here's what every modern BI initiative aims to achieve:

Unify data, unify decisions

BI brings all your data, from sales and finance to operations and marketing into a single, reliable source of truth. When everyone works with the same numbers, alignment and clarity follows naturally.

Business Intelligence platform connecting to 500+ data sources and business applications

Empower every team

Modern BI tools make data accessible to everyone, not just analysts. With intuitive dashboards and seld-service analytics, teams can explore and interpret data independently, without relying on IT teams.

Business Intelligence dashboard showcasing 50+ data visualization types including charts, graphs, and interactive reports

Enable faster, smarter decisions

Real-time dashboards and automated alerts keep you connected to what's happening right now. BI helps you to respond instantly and turn insights into actions even before they escalate.

Multivariate forecasting dashboard for faster and smarter business decisions

Drive innovation and continuous improvement

By uncovering hidden patterns, trends, and opportunities, BI turns data into inspiration. With every analysis, you learn, adapt, and refine by turning data into an ongoing feedback loop that powers growth and innovation.

Business Intelligence tools for driving innovation and continuous improvement

Create a transparent and accountable culture

When data is visible to everyone in the team, collaboration strengthens. Shared insights build trust, promote accountability, and align teams around common goals.

Transparent and accountable business culture through data visibility and shared insights

How do companies use Business Intelligence

Businesses rely on BI to uncover insights, boost performance, and make smarter strategic choices. Here's how BI adds value:

Data analysis and reporting

Blend and clean data from various sources to create clear, visual reports that reveal patterns and insights.

Performance monitoring

Track KPIs across departments to measure success and identify areas that need attention.

Strategic planning

Align long-term goals with real-time business data to plan more effectively and allocate resources wisely.

Customer intelligence

Segment customers, study their behavior, and tailor products or campaigns to meet their needs.

Predictive insights

Analyze historical data to forecast trends, market shifts, or potential risks before they occur.

Workforce optimization

Understand hiring needs, employee performance, turnover, and retention to build a more engaged and productive workforce.

Industrial use cases of Business Intelligence

Business intelligence is redefining how industries operate. It serves as a decision-making backbone across industries helping transform data into strategic action, improve performance, and drive growth.

Retail and e-commerce

Analyze customer buying patterns, optimize inventory, and personalize offers to improve sales and retention.

Retail and e-commerce business intelligence illustration

Finance and banking

Track revenue, expenses, and risk indicators to ensure compliance, detect fraud, and gain visibility into key financial operations.

Finance and banking business intelligence illustration

Healthcare

Combine patient, clinical, operational, and financial data to enhance care quality, optimize costs, and predict treatment outcomes.

Healthcare business intelligence illustration

Manufacturing

Monitor production efficiency, control costs, and use predictive insights to prevent downtime and improve output.

Manufacturing business intelligence illustration

Education

Measure student performance, streamline operations, and optimize resource allocation for better learning outcomes.

Education business intelligence illustration

Government and public sector

Use data insights to improve transparency, streamline operations, and deliver citizen-centric services.

Government and public sector business intelligence illustration

Empower your business with intelligent insights.

Start your BI journey today