What are Kanban metrics?
Kanban metrics are the set of parameters used to measure the performance of workflows within a Kanban system. Unlike the Scrum framework where a set of work items are completed in defined timeboxed iterations, the Kanban task management system is based on continuous flow of work. The concept of a defined time cycle for a set of work items does not apply here.
Instead, the metrics for Kanban focus on measuring how smoothly the work items move through the system over time rather than on completing work within specific Sprints. These Kanban performance metrics help in tracking team performance, identifying problematic bottlenecks, and also making calculated data-driven decisions.
What are the main Kanban metrics to track?
1. Cycle time
Cycle Time = Time item exits the "Done" stage − Time item moved out of the backlog and into a progress stage
The Kanban cycle time measures the total time a particular work item spends in the "In Progress" state. In simpler terms, it defines the total time taken for the completion of a task once work has started upon it. The shorter the cycle time, the more efficient the workflow.
2. Lead time
Lead Time = Time item exits "Done"− Time item was requested/added to the backlog
Lead time in Kanban measures the total time taken for a work item's completion from the time it is requested/ added to the system. Unlike cycle time, it includes both the waiting duration and the active work time for that work item. Similar to cycle time, a shorter lead time is also reflective of a more efficient workflow.
3. Throughput
Throughput = Number of items completed ÷ Time period
The Kanban throughput is a measure of how many work items are completed in a specific time window. It can also be defined as the rate at which work items are completed and delivered. A higher throughput is a positive indication towards efficiency and means that the system is getting more work done in a shorter time period.
4. Work in progress (WIP)
WIP = Count of items currently in active (in-progress) stages
In Kanban metrics, WIP or Work-In-Progress refers to the number of work items that are being worked on currently and aren't completed. It is a measure of the active tasks currently in the system. Unlike the other metrics for Kanban, a higher or lower WIP isn't a definitive indicator of performance. However, it should be monitored and limited to ensure that workflows are smooth without the possibility of overburdening.
The Little Law governing this system
In the mathematical concept of queuing theory, there is a fundamental theorem which states that the average number of items in a system is equal to the average arrival rate of the items multiplied by the average time a single item spends in the system. This is algebraically expressed as:
L = λ×W
Where L is the average number of items, λ is the average arrival rate and W is the average time per item.
This theorem is known as Little's Law, named after Professor John Little who formulated it. While this relationship was observed before in fields like factory operations and service desks, Professor Little proved that this theorem holds true under any broad, general conditions irrespective of the distribution of arrivals, service times, or how items are prioritized. But for this to apply, three precursor conditions are necessary:
- The system is stable: The Average Arrival Rate ≈ Average Departure Rate i.e. there should be no growing pileup in the queue of items being worked upon.
- The average quantities are measurable: the values of L, λ and W should be consistently measurable over a long stretch of time.
- Conservation of flow: items that enter the system must eventually leave it without accumulating indefinitely.
The role of Little's Law in Kanban metrics
You've probably heard time and again that the principle ethos of the Kanban system is based on visualizing work, limiting WIP and optimizing flow. In order to have these three fundamental qualities present, it is imperative that Little's Law applies to the Kanban system you are working in. Let's find out how.
Assuming the three precursor conditions are satisfied, we can tweak Little's Law with the Kanban performance metrics as follows:
- The average number of items (L) is represented by Work in Progress
- The average arrival rate (λ) is represented by Throughput
- The average time per item (W) is represented by Cycle Time
So the modified formula that you get is:
WIP (L) = Throughput (λ) x Cycle Time (W)
Since a Kanban system is centered around cycle time as it directly measures how smooth and quick the work moves through the system, we can represent the equation as:
Cycle Time = (WIP/Throughput)
Based on this formula, three important inferences arise:
1. Cycle Time can only be reduced by increasing throughput or decreasing WIP.
If you want work to be completed faster, you have to either increase the throughput by adding more team members or increasing the existing output or by reducing the number of work items in the WIP state. One of the prime mechanisms of a Kanban system that emphasizes on keeping WIP as low as possible isn't arbitrary, it has an established mathematical reason for the same.
2. WIP limits exist to uphold Little's Law.
WIP limits are a sort of a self-governing mechanism that ensures that Little's Law can be applied to a particular Kanban system. As we mentioned before, for Little's Law to apply, the system has to be stable i.e. the number of items entering should be almost equal to the number of items leaving the system. WIP limits ensure that work items aren't indiscriminately added to the system without prior assessment. If a team has a throughput of 3 tasks a day, they should keep a WIP limit of 3 and only take up more tasks after they are done with the existing.
3. The central focus is always on Cycle Time.
Lead time while a very important Kanban Metric on its own isn't as important to the team's working as Cycle Time. Lead Time is tracked to understand how long a requirement takes to be fulfilled when it is received from the user or customer. Cycle Time is what matters as a core performance metric for your team's functioning. Focusing on Cycle Time will automatically lower the Lead Time as well, provided the work intake and prioritization process is planned and controlled.
Have the math on your side. Zoho Sprints tracks Kanban metrics automatically so that Little's Law is always working for you.
Try Sprints for FreeHow to improve Kanban metrics?
The principle behind improving Kanban metrics is rarely about working harder, it's all about removing friction in the flow. Each metric reacts to different levers, and those levers pull in ways that won't seem obvious till you see them play out on your Kanban board.
Reducing cycle time
- Cycle time shrinks as work stops stalling between the start and ship stages. The best way to do so is to enforce meaningful WIP limits. With fewer items in progress, there's less context-switching which means faster movement.
- Break large tasks into smaller tasks as something that might span across six days has a higher potential to stall progress than a smaller two or three day task.
- Set clear rules for escalating blockers instead of relying on goodwill, and focus on finishing aging items before starting new ones.
Reducing lead time
- Lead time is fundamentally cycle time plus the wait before work begins so it's largely about intake discipline. When items are accepted faster than the team can start them, each new item inherits a longer waiting period.
- Tighten commitment points so that the team only accepts what it can begin working on, and pair this with stronger prioritization rituals.
- Since cycle time is a constituent of lead time, improving the former automatically makes a positive impact on the latter.
Increasing throughput
- In a very counterintuitive way, throughput usually improves best by reduction of WIP, not by adding effort. This is a consequence of our Little's Law relationship working in reverse.
- Beyond limiting of WIP, you can also cut hand offs and standardize recurring workflows so that work items aren't waiting on process completion.
Managing WIP
- The entire concept of WIP is about finding the right ceiling instead of just pushing an arbitrary number. Start empirically by taking your current WIP as a baseline, lower the limit by one and observe how things change.
- If cycle time improves and nothing else starves, lower it again and stop when lowering it further starts to hurt flow.
- Always set unique WIP limits for each column not across the board. Doing so highlights bottlenecks at the exact stage they occur, rather than scattering them across random stages the way a single board-wide limit does.
How to implement Kanban tracking and reporting?
Step 1: Define your workflow states
Map your board to reflect how your work actually moves, not how you envisioned it to move. Every column should reflect a very specific state, and the whole team should be in unanimous agreement with that what it reflects. Fuzzy or vague column definitions are your single bigger source of junk metrics. "In Progress," "Review," "Done," each need a shared, unambiguous meaning before anyone reads a single report.
Step 2: Agree on how work registers against those states
Once you've defined your columns you also need to agree on how work moves across them. When does a card actually enter "In Progress"? When it is assigned or when someone actually starts to work on it? Does a blocked card still count as active WIP? Does an item in review? Your tool will calculate whatever the board tells it, so if your team members start moving cards inconsistently, the reports will be misleading. So, it is on you to settle the conventions.
Step 3: Establish a baseline
The one very important thing for reporting with the Kanban process is to never set targets on Day 1. Get a feel of your existing flow for a few weeks so that metrics like cycle time, throughput and WIP display a genuine pattern rather than a one-time spike. This baseline is super important as every future benchmark will be pitted against this. Early metrics are always noisy, and it is in your best interest not to react to them prematurely.
Step 4: Review, adjust, and iterate
Similar to its flow process, Kanban tracking isn't a set-and-forget type activity. You need to build a recurring cadence, a weekly flow review or part of your retrospective. The team has to examine the metrics, spot where work is stalling, and come to a decision on some changes to test out. Then you measure it's effect against your baseline (which itself can be revised over time) before you introduce the next. This loop of observe, adjust, and re-measure is what makes reporting data influence a self-improving workflow.
Kanban reports in Zoho Sprints
Everything covered so far with respect to Kanban metrics, the flow relationship binding them, and their tracking, stops being abstract the moment you have a tool like Zoho Sprints. As soon as you setup a Kanban board with data on Zoho Sprints, its dedicated Reports module converts that data into Kanban reports, each built to answer a specific question about how your work moves. Zoho Sprints tracks 12 different parameter charts across 4 categories, with additional module-specific reports:
1. Cycle time reports
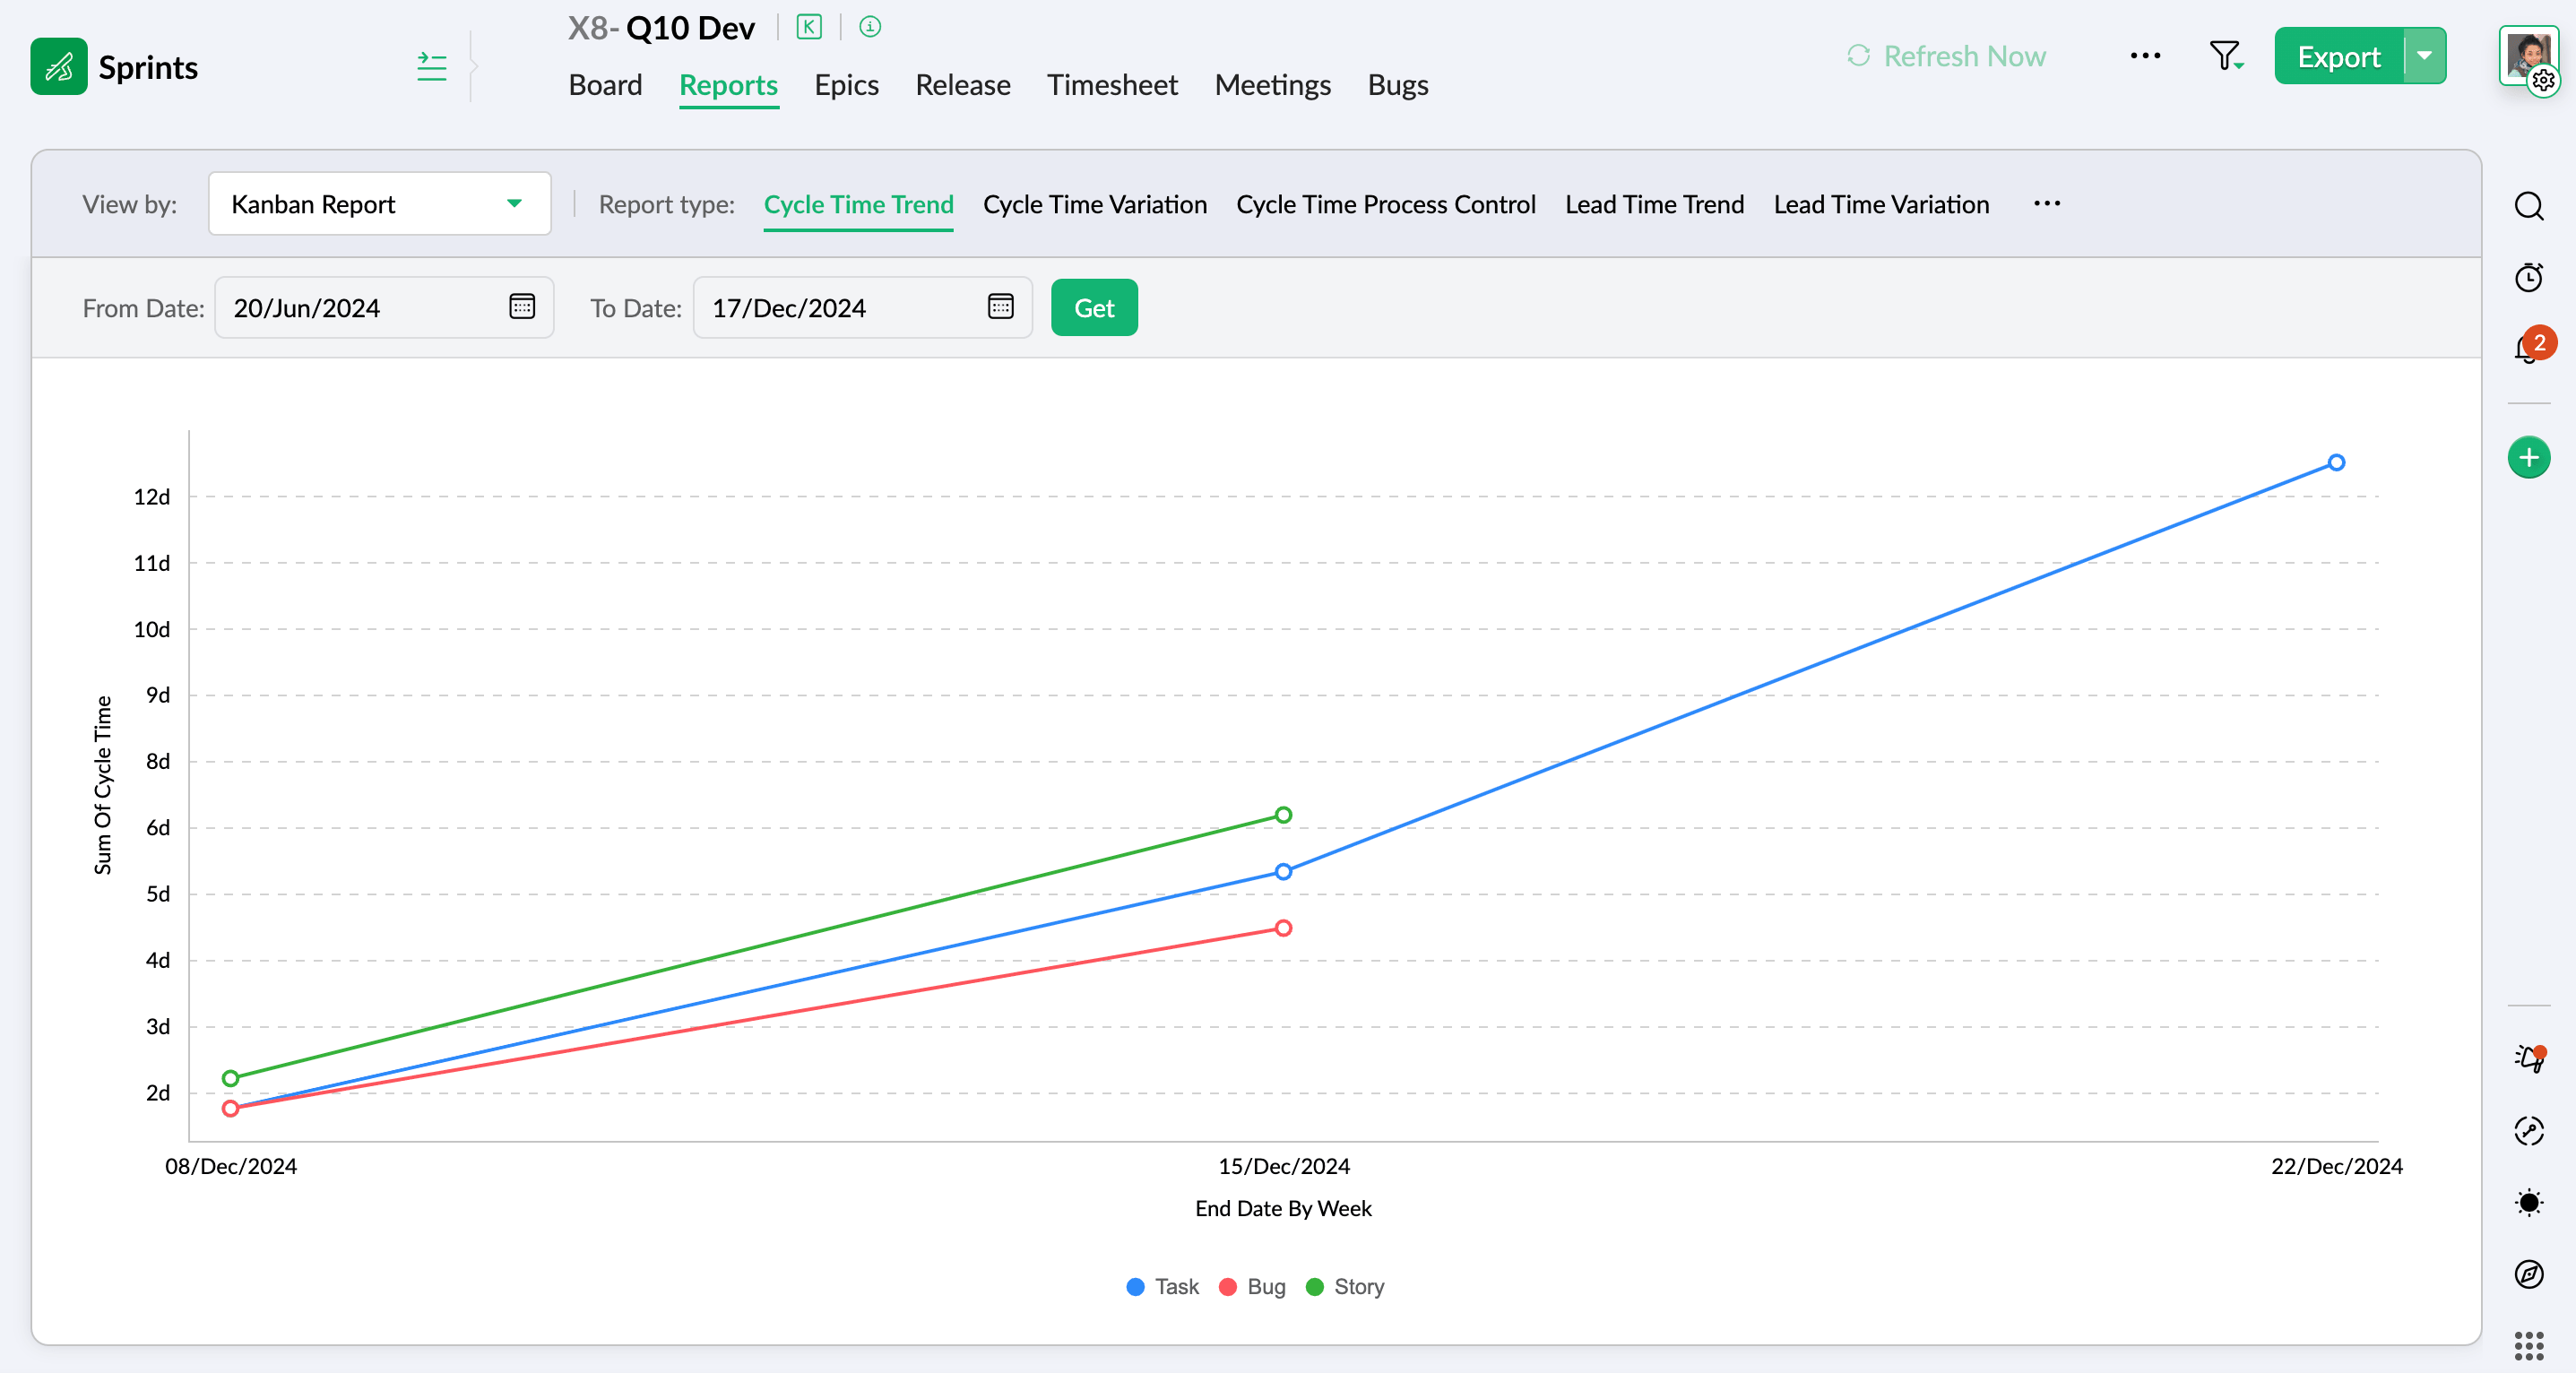
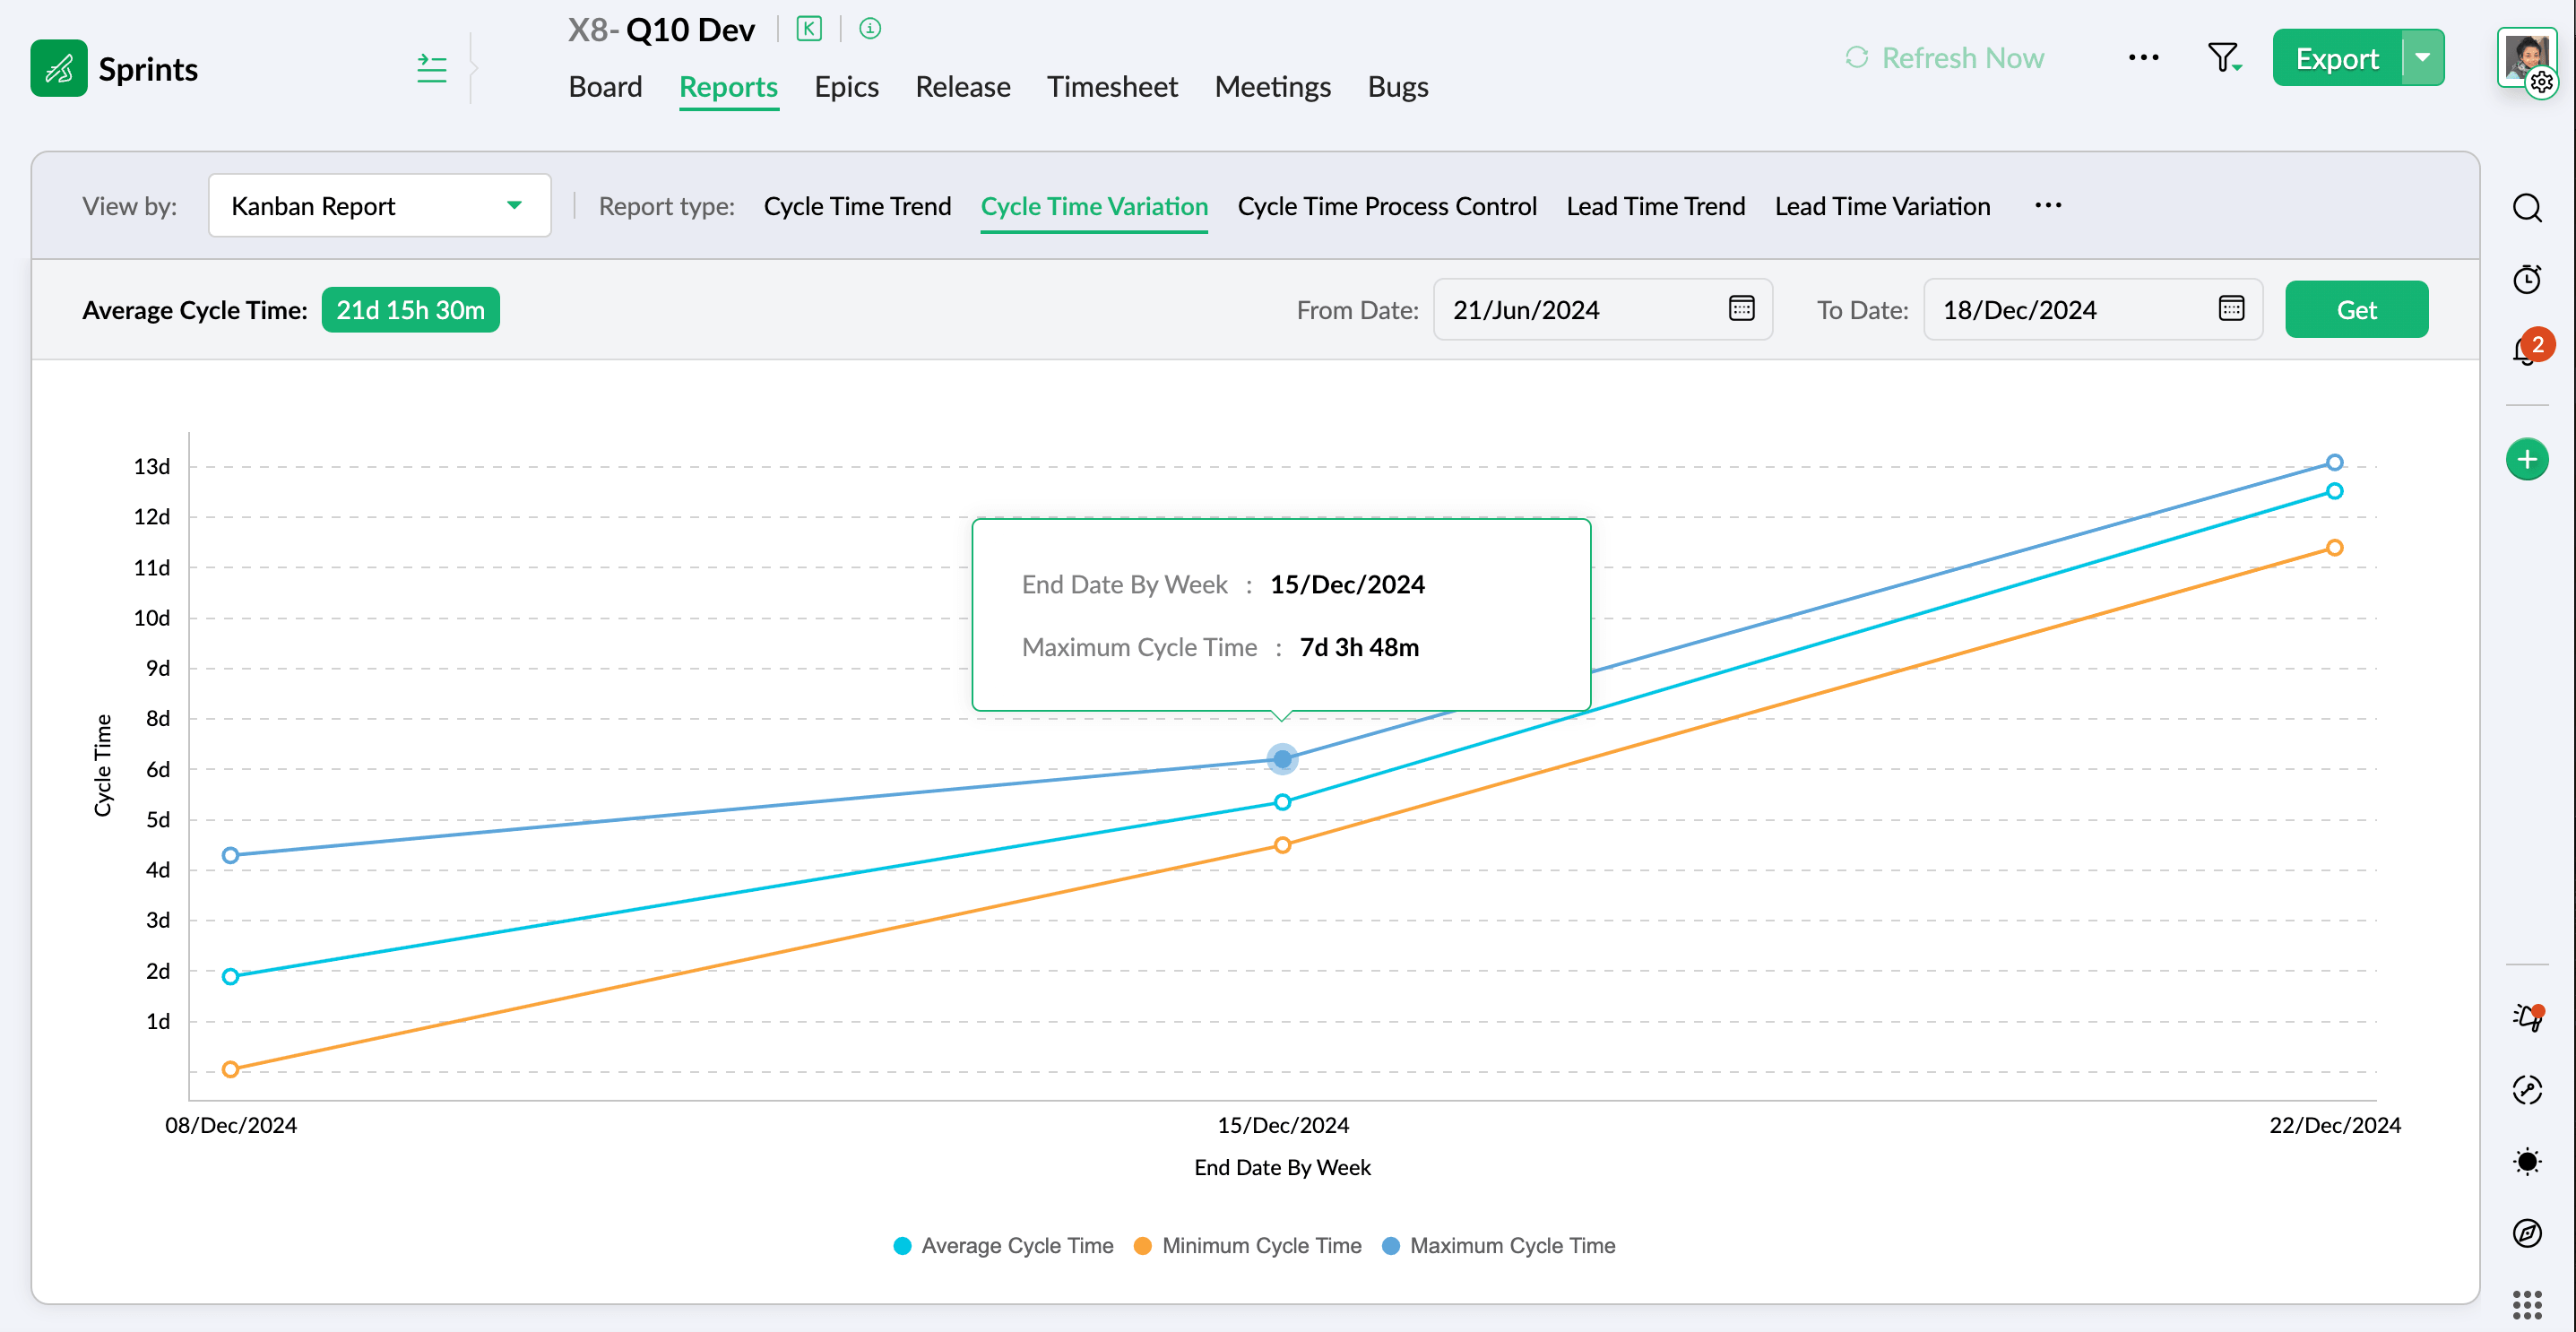
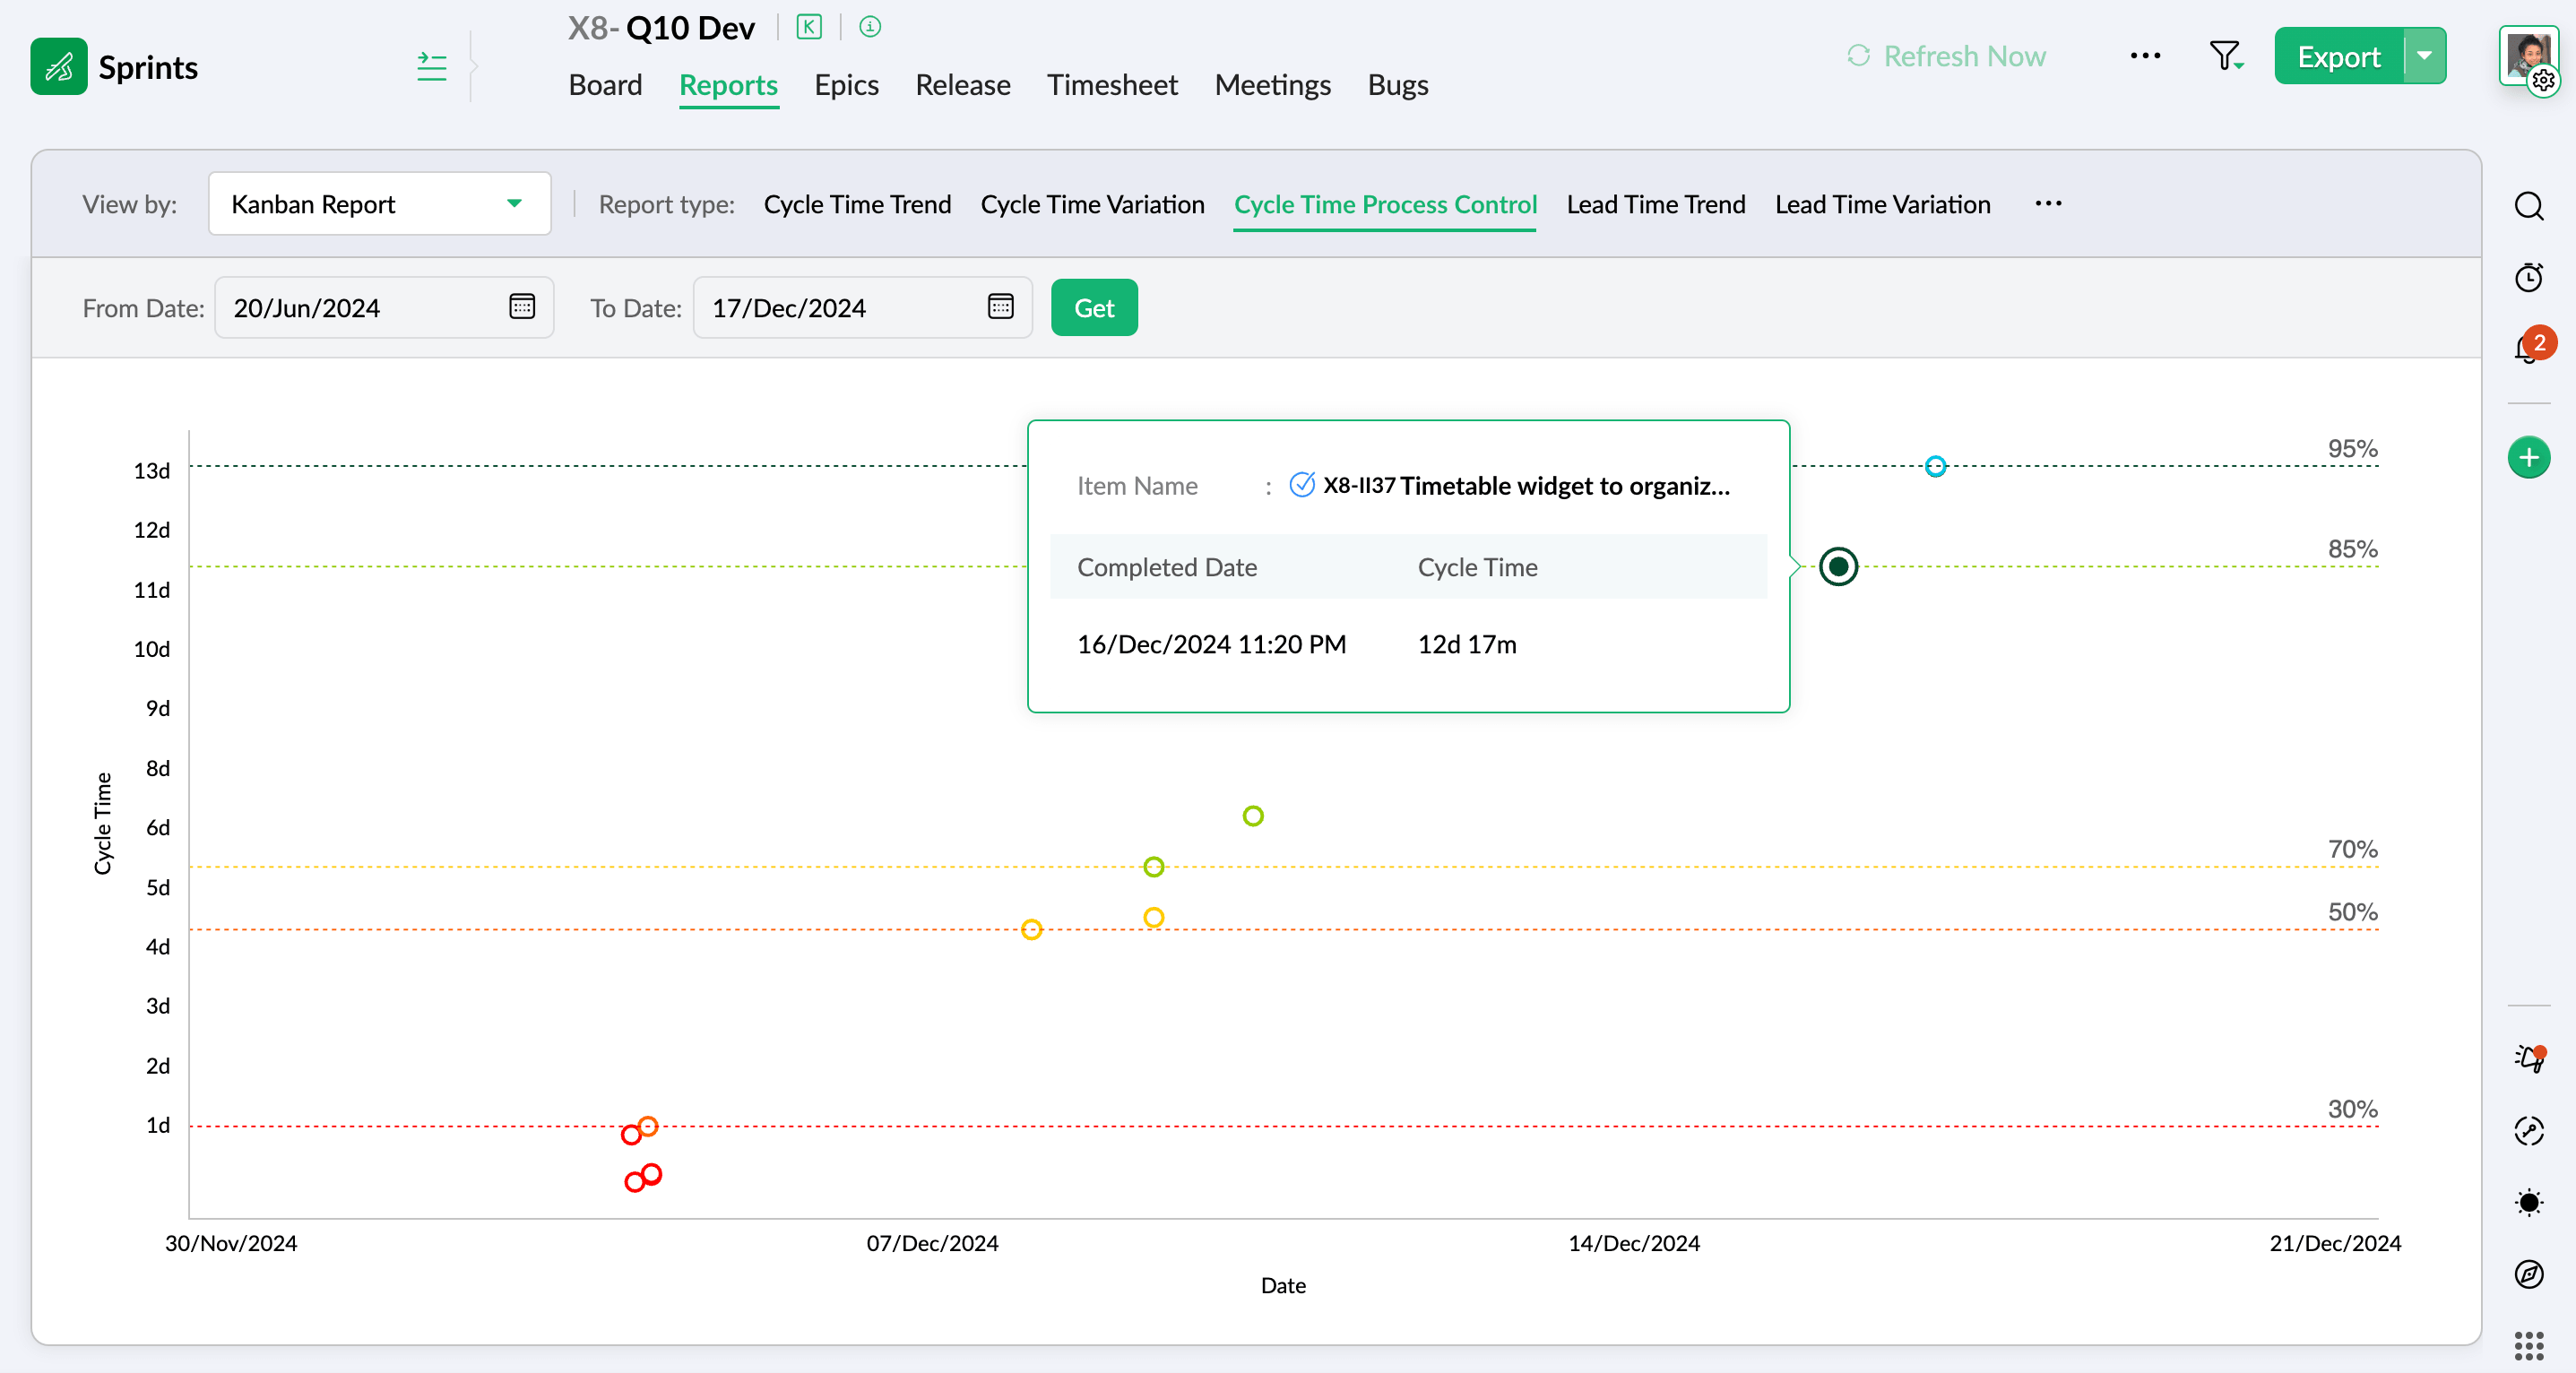
Cycle time reports track the duration items spend in progress, and Zoho Sprints offers three perspectives on it.
Cycle time trend: Tracks cycle time as a trend line over time, showing whether your process is genuinely getting faster or quietly slowing down across longer stretches.

Cycle time variation: This chart plots the average, minimum, and maximum cycle time of completed items mapped weekly. This report is useful when you want to assess the consistency of your delivery and identify the outliers dragging your average up.
Cycle time process control: This chart sorts completed items into percentile thresholds based on their cycle time. This helps you see what proportion of work finishes within a given duration. It's a direct answer to the question, "how predictable are we?" It is useful when you want to quote a realistic completion window with confidence instead of projecting best-case guesses.
2. Lead time reports
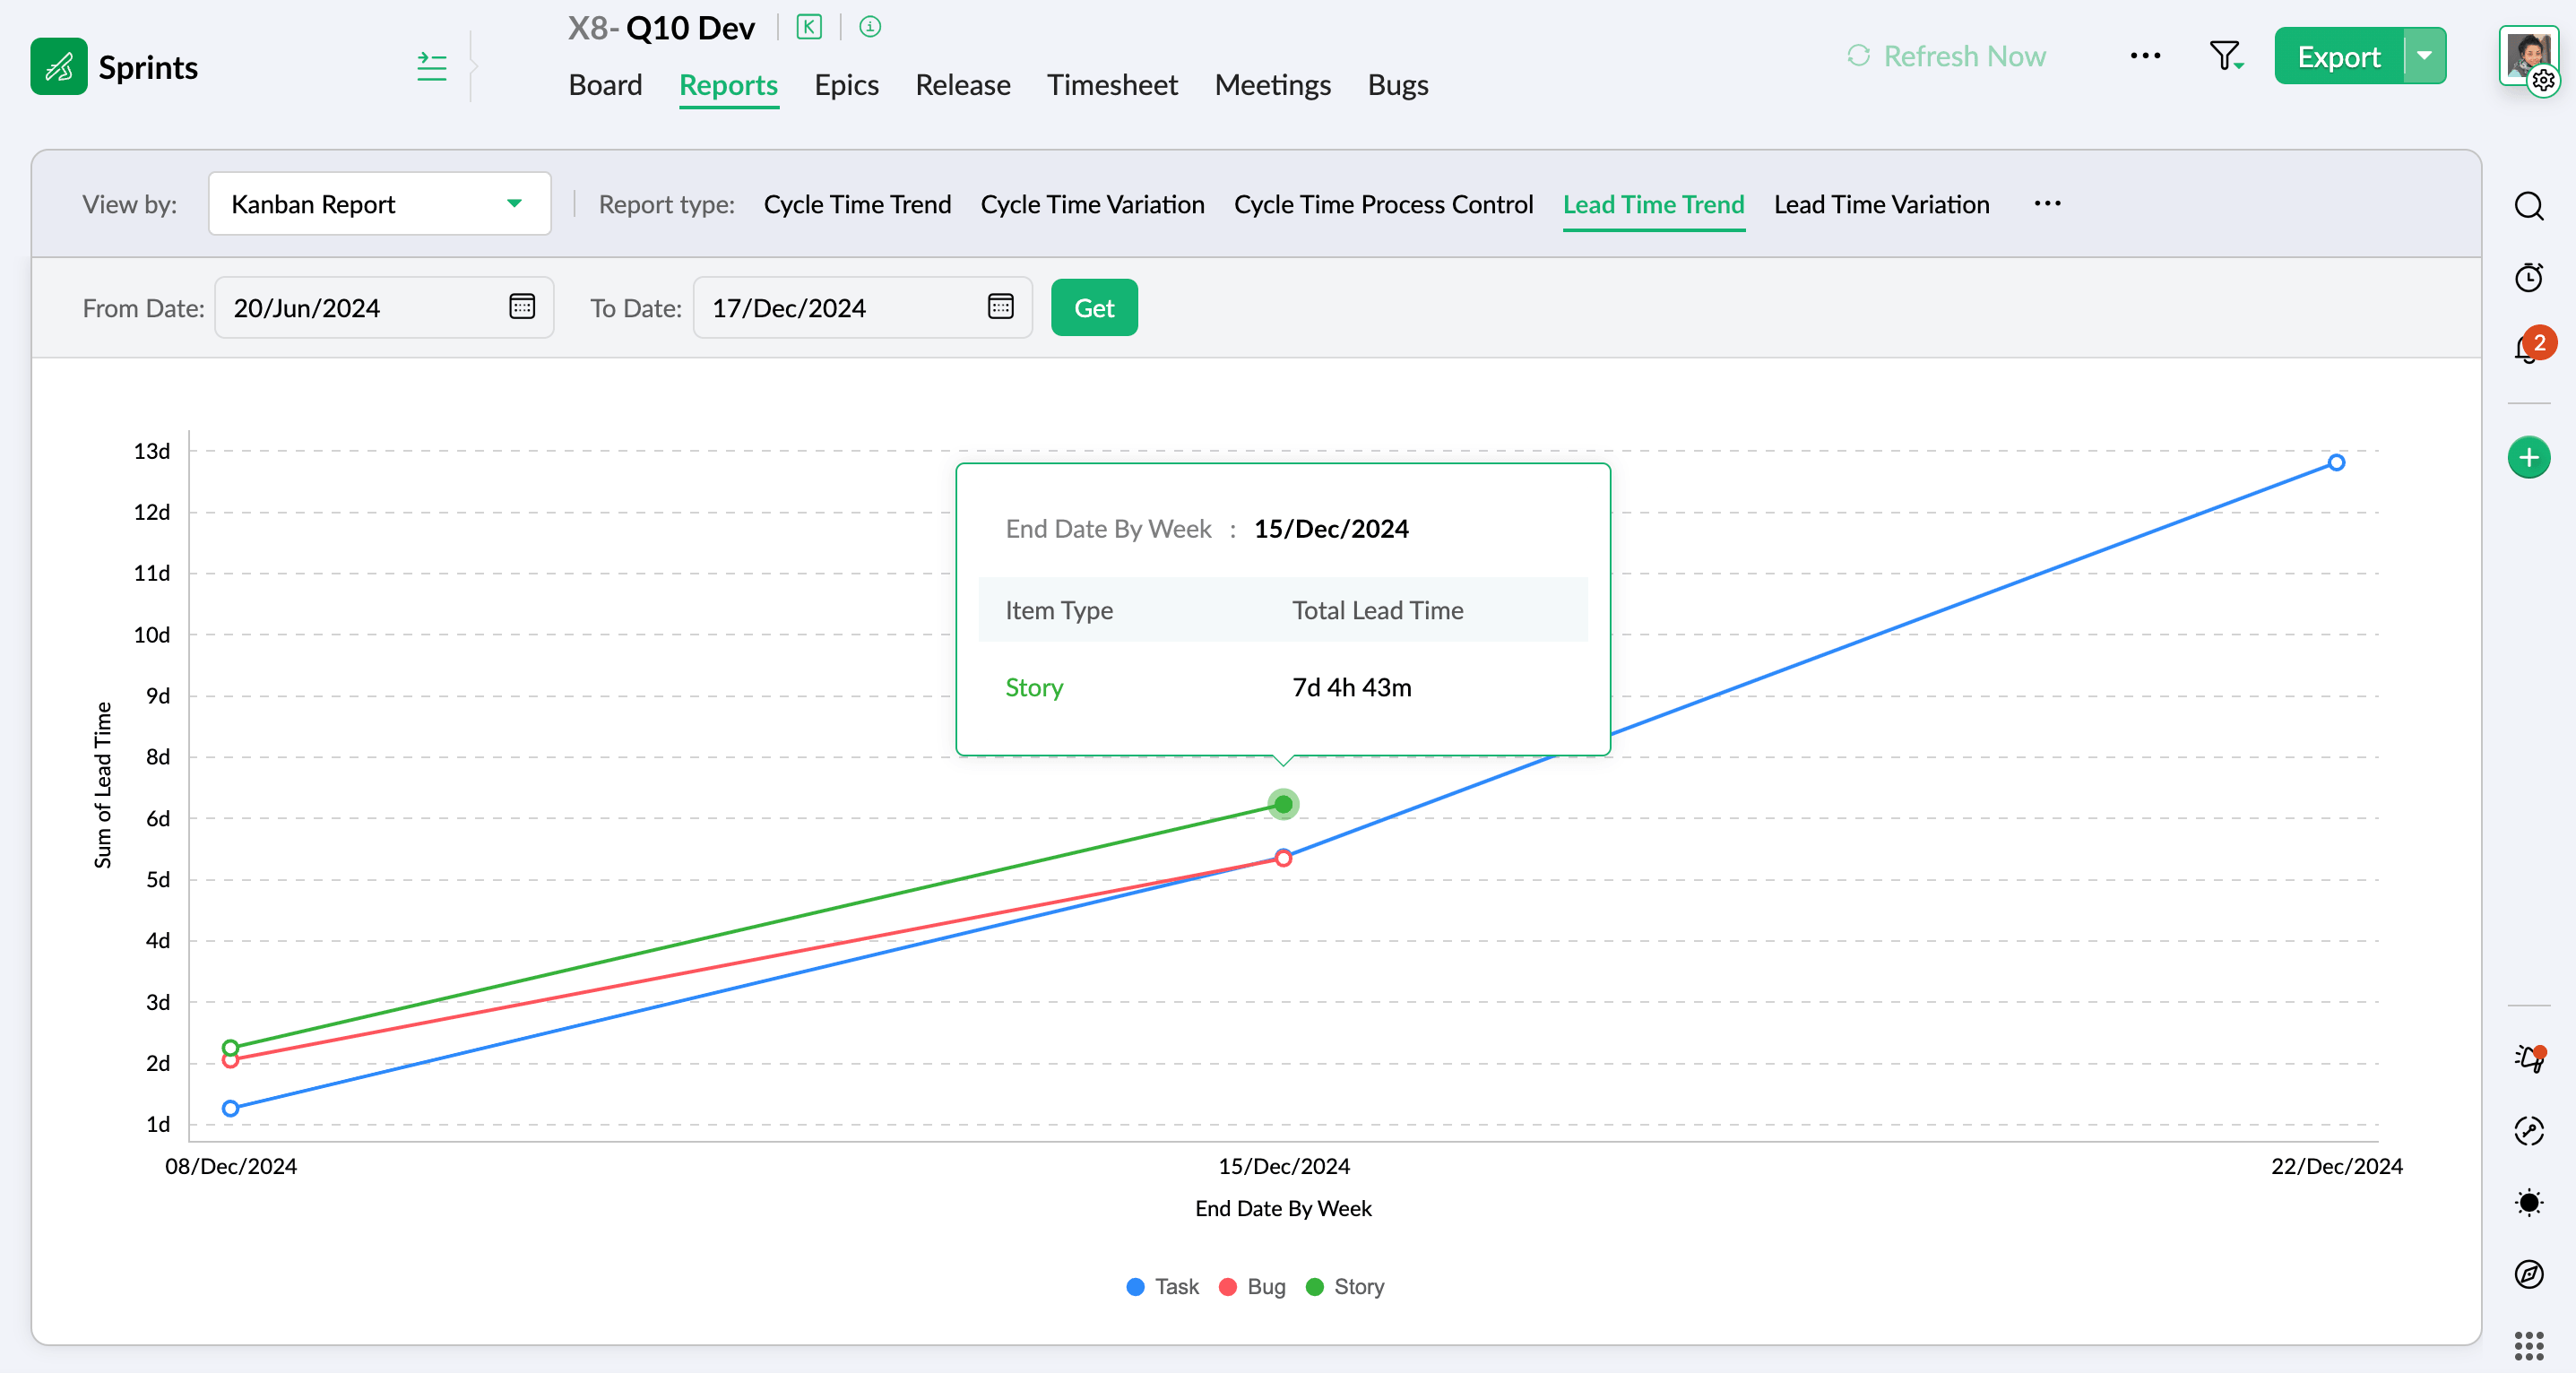
Lead time covers the entire journey of a work item, from when it enters to when it's delivered. Lead time charts in Zoho Sprints also offer three different perspectives.
Lead time trend: Charts average lead time across time, so you can tell whether intake and prioritization discipline is holding or drifting.
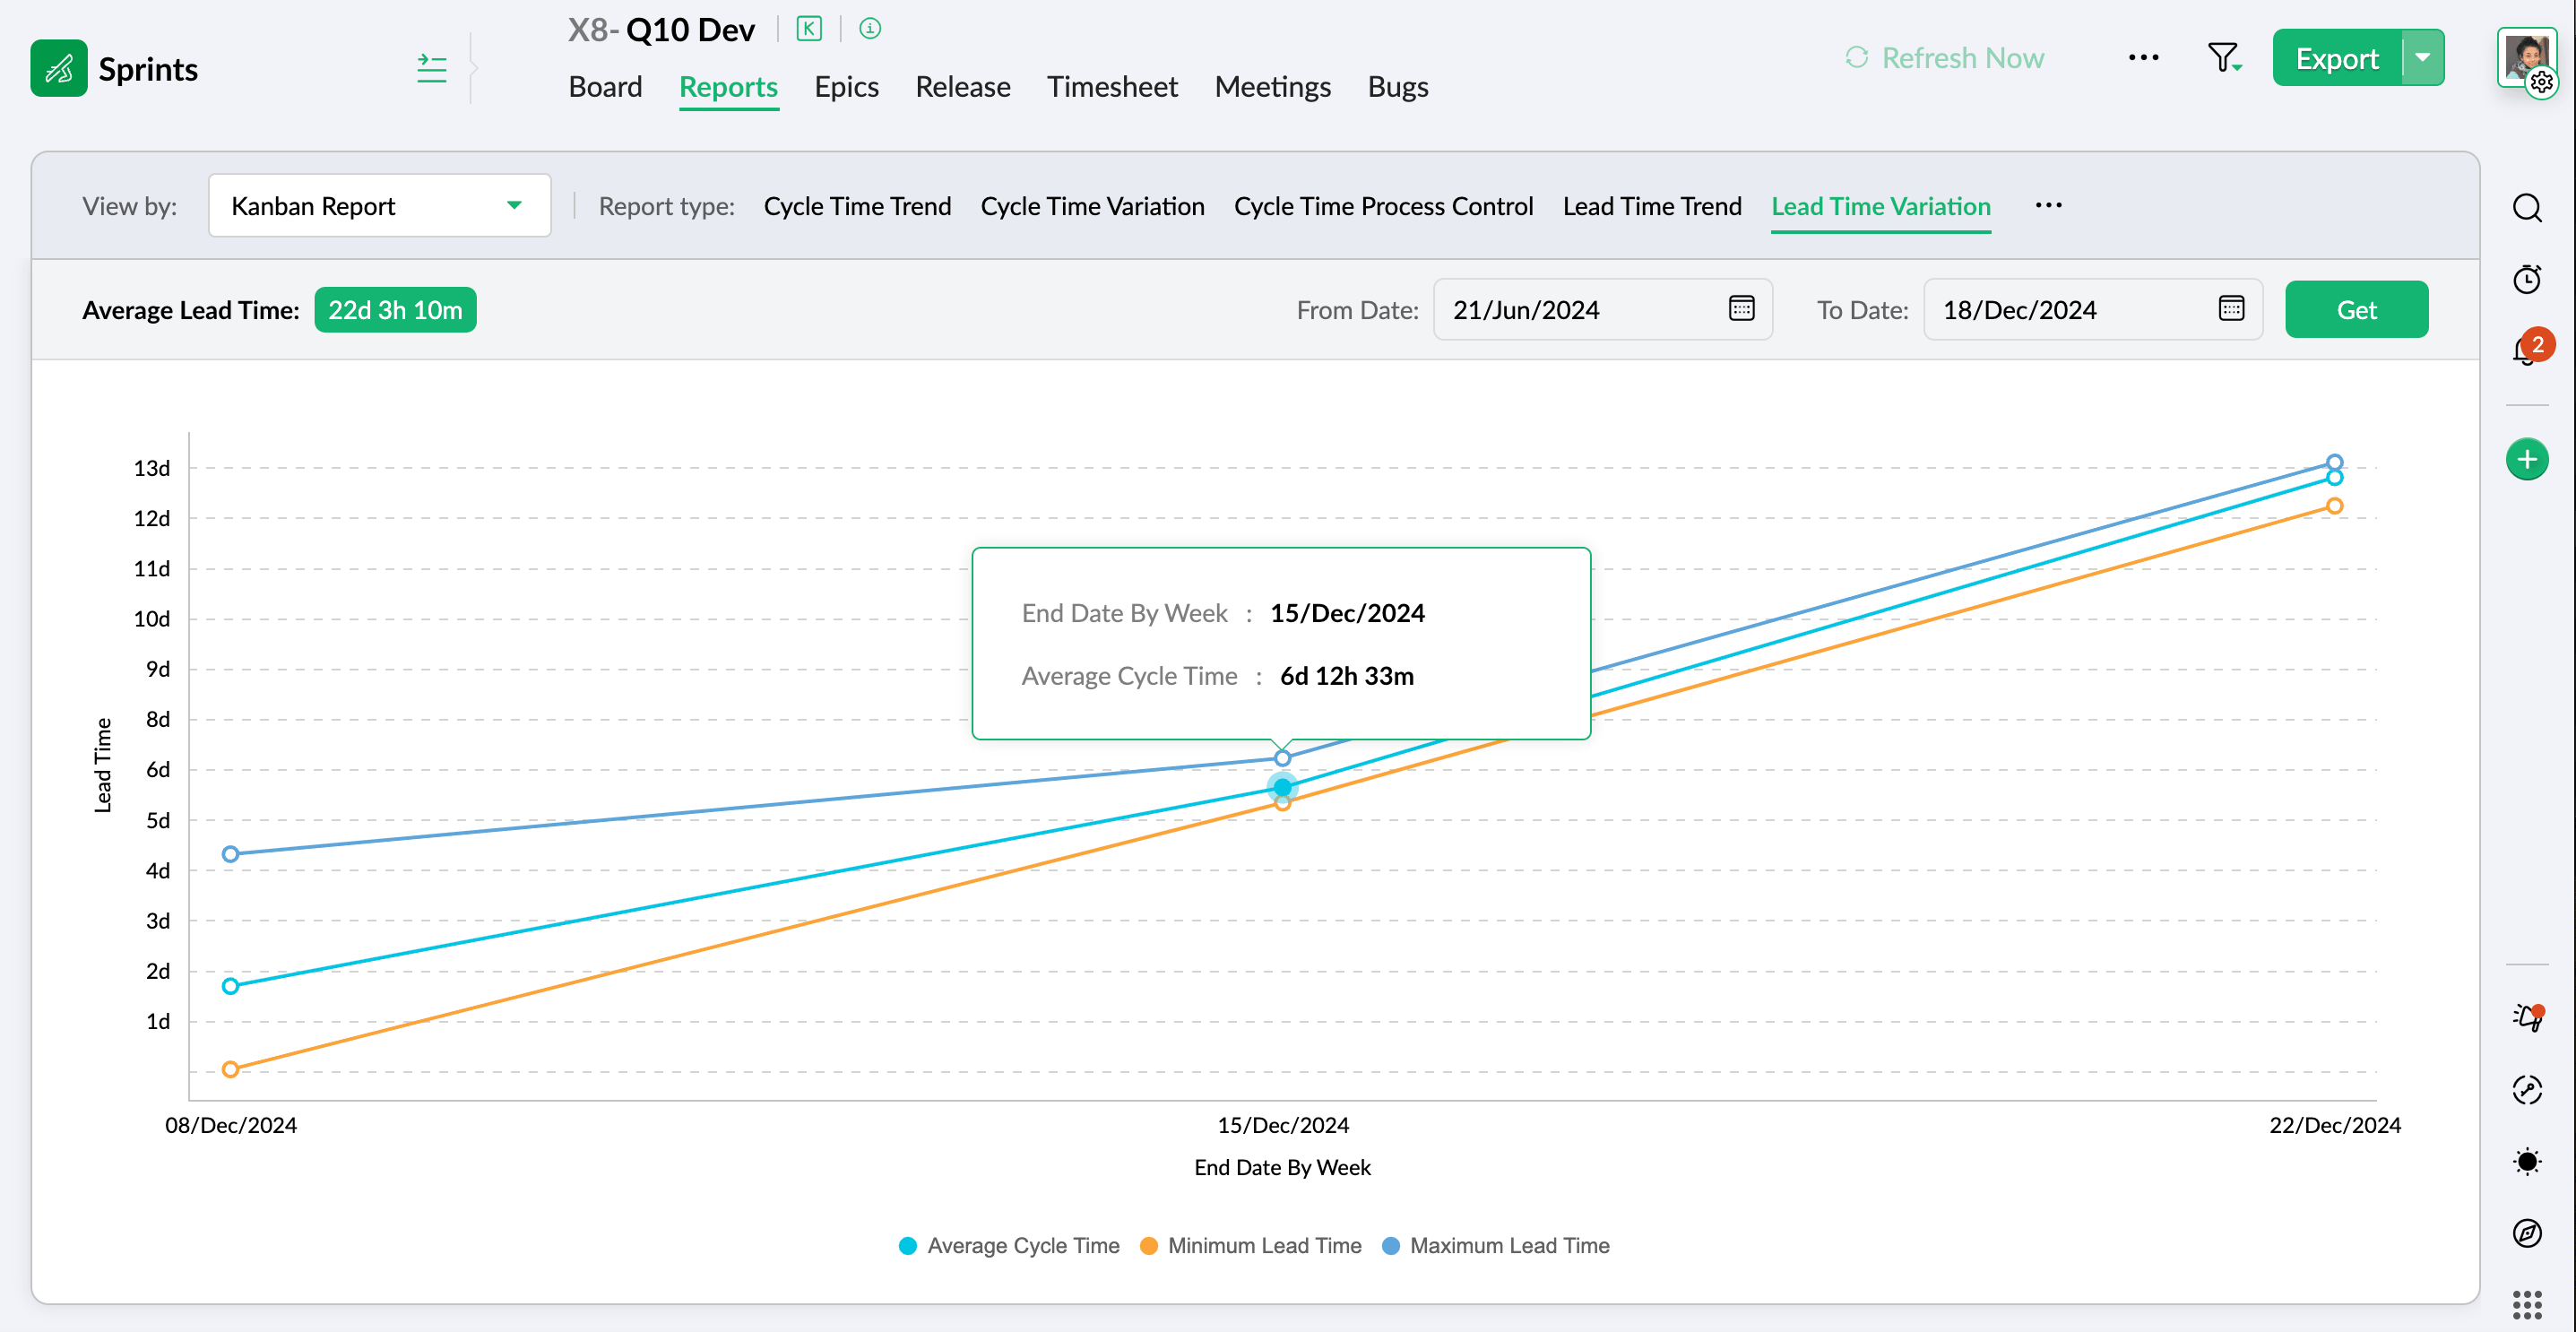
Lead time variation: Shows the average, minimum, and maximum lead time of completed items over your chosen range. This shows the full wait-plus-work duration, including the queue time before work starts that cycle time leaves out.
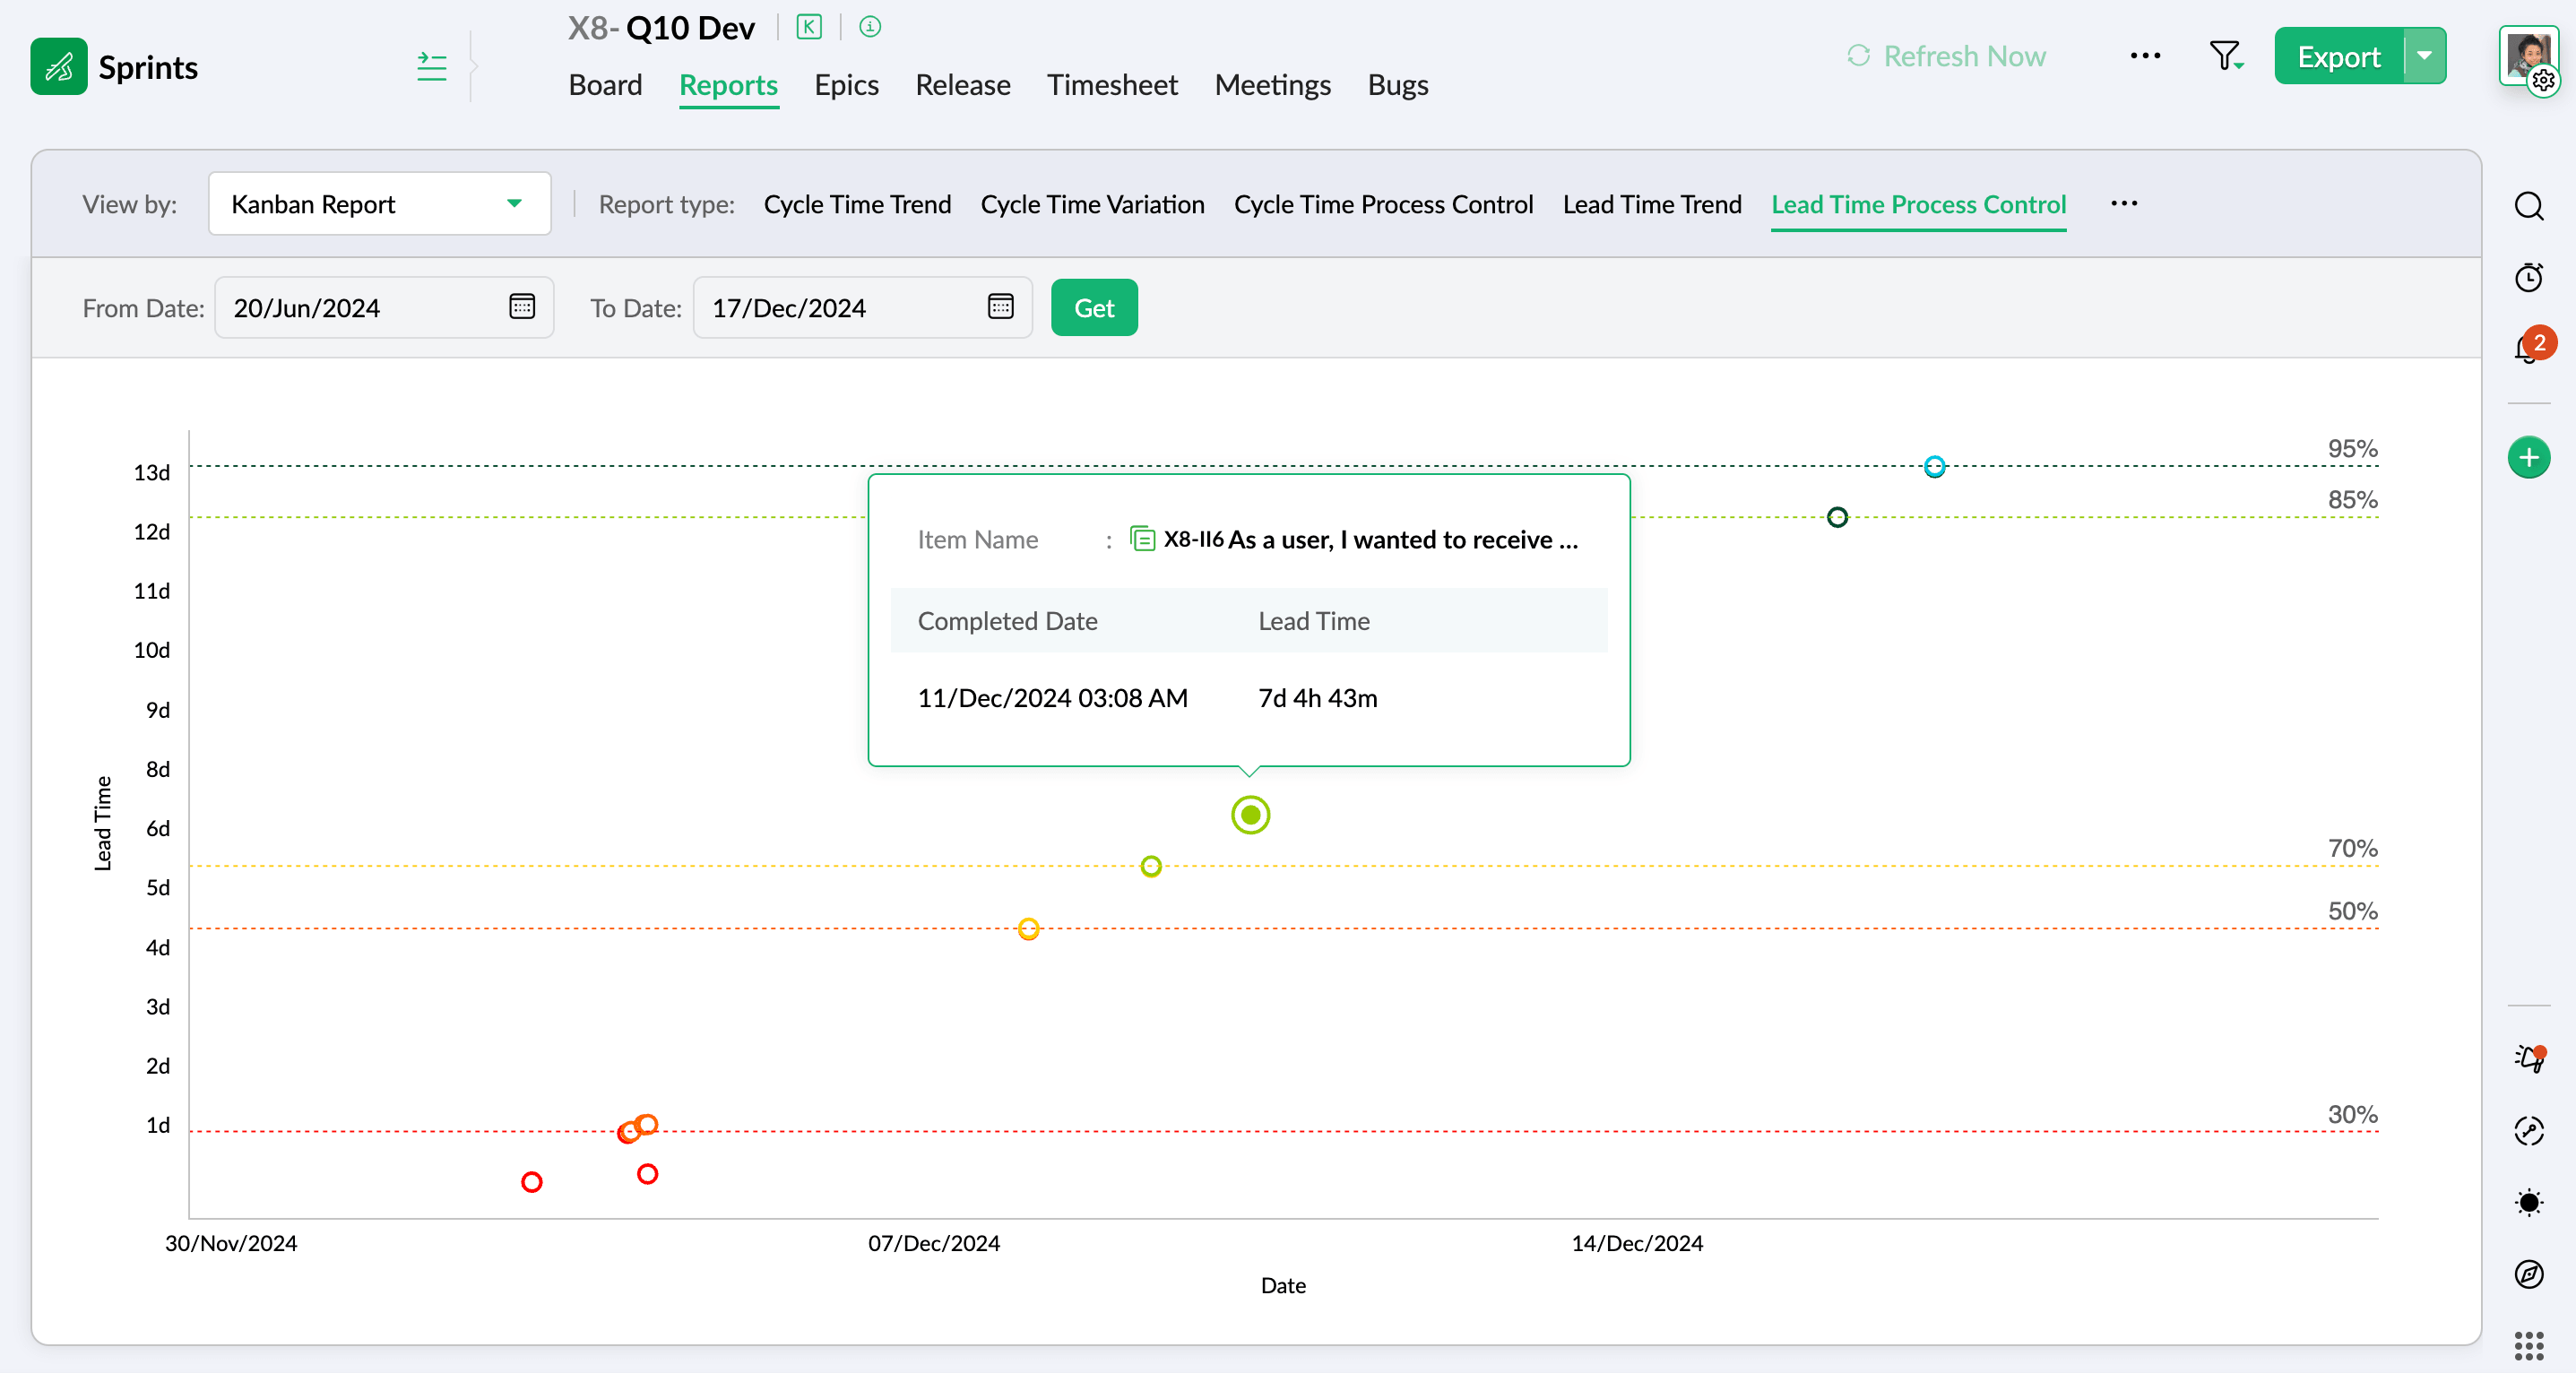
Lead time process control: Applies a percentile-threshold structure, to give you a measure of the share of requests fulfilled within a given timeframe. This is the number that your stakeholders care about the most.
3. Flow and status reports
This group primarily helps identify WIP, bottlenecks, and stalled work. Zoho Sprints offers 4 such reports to identify these:
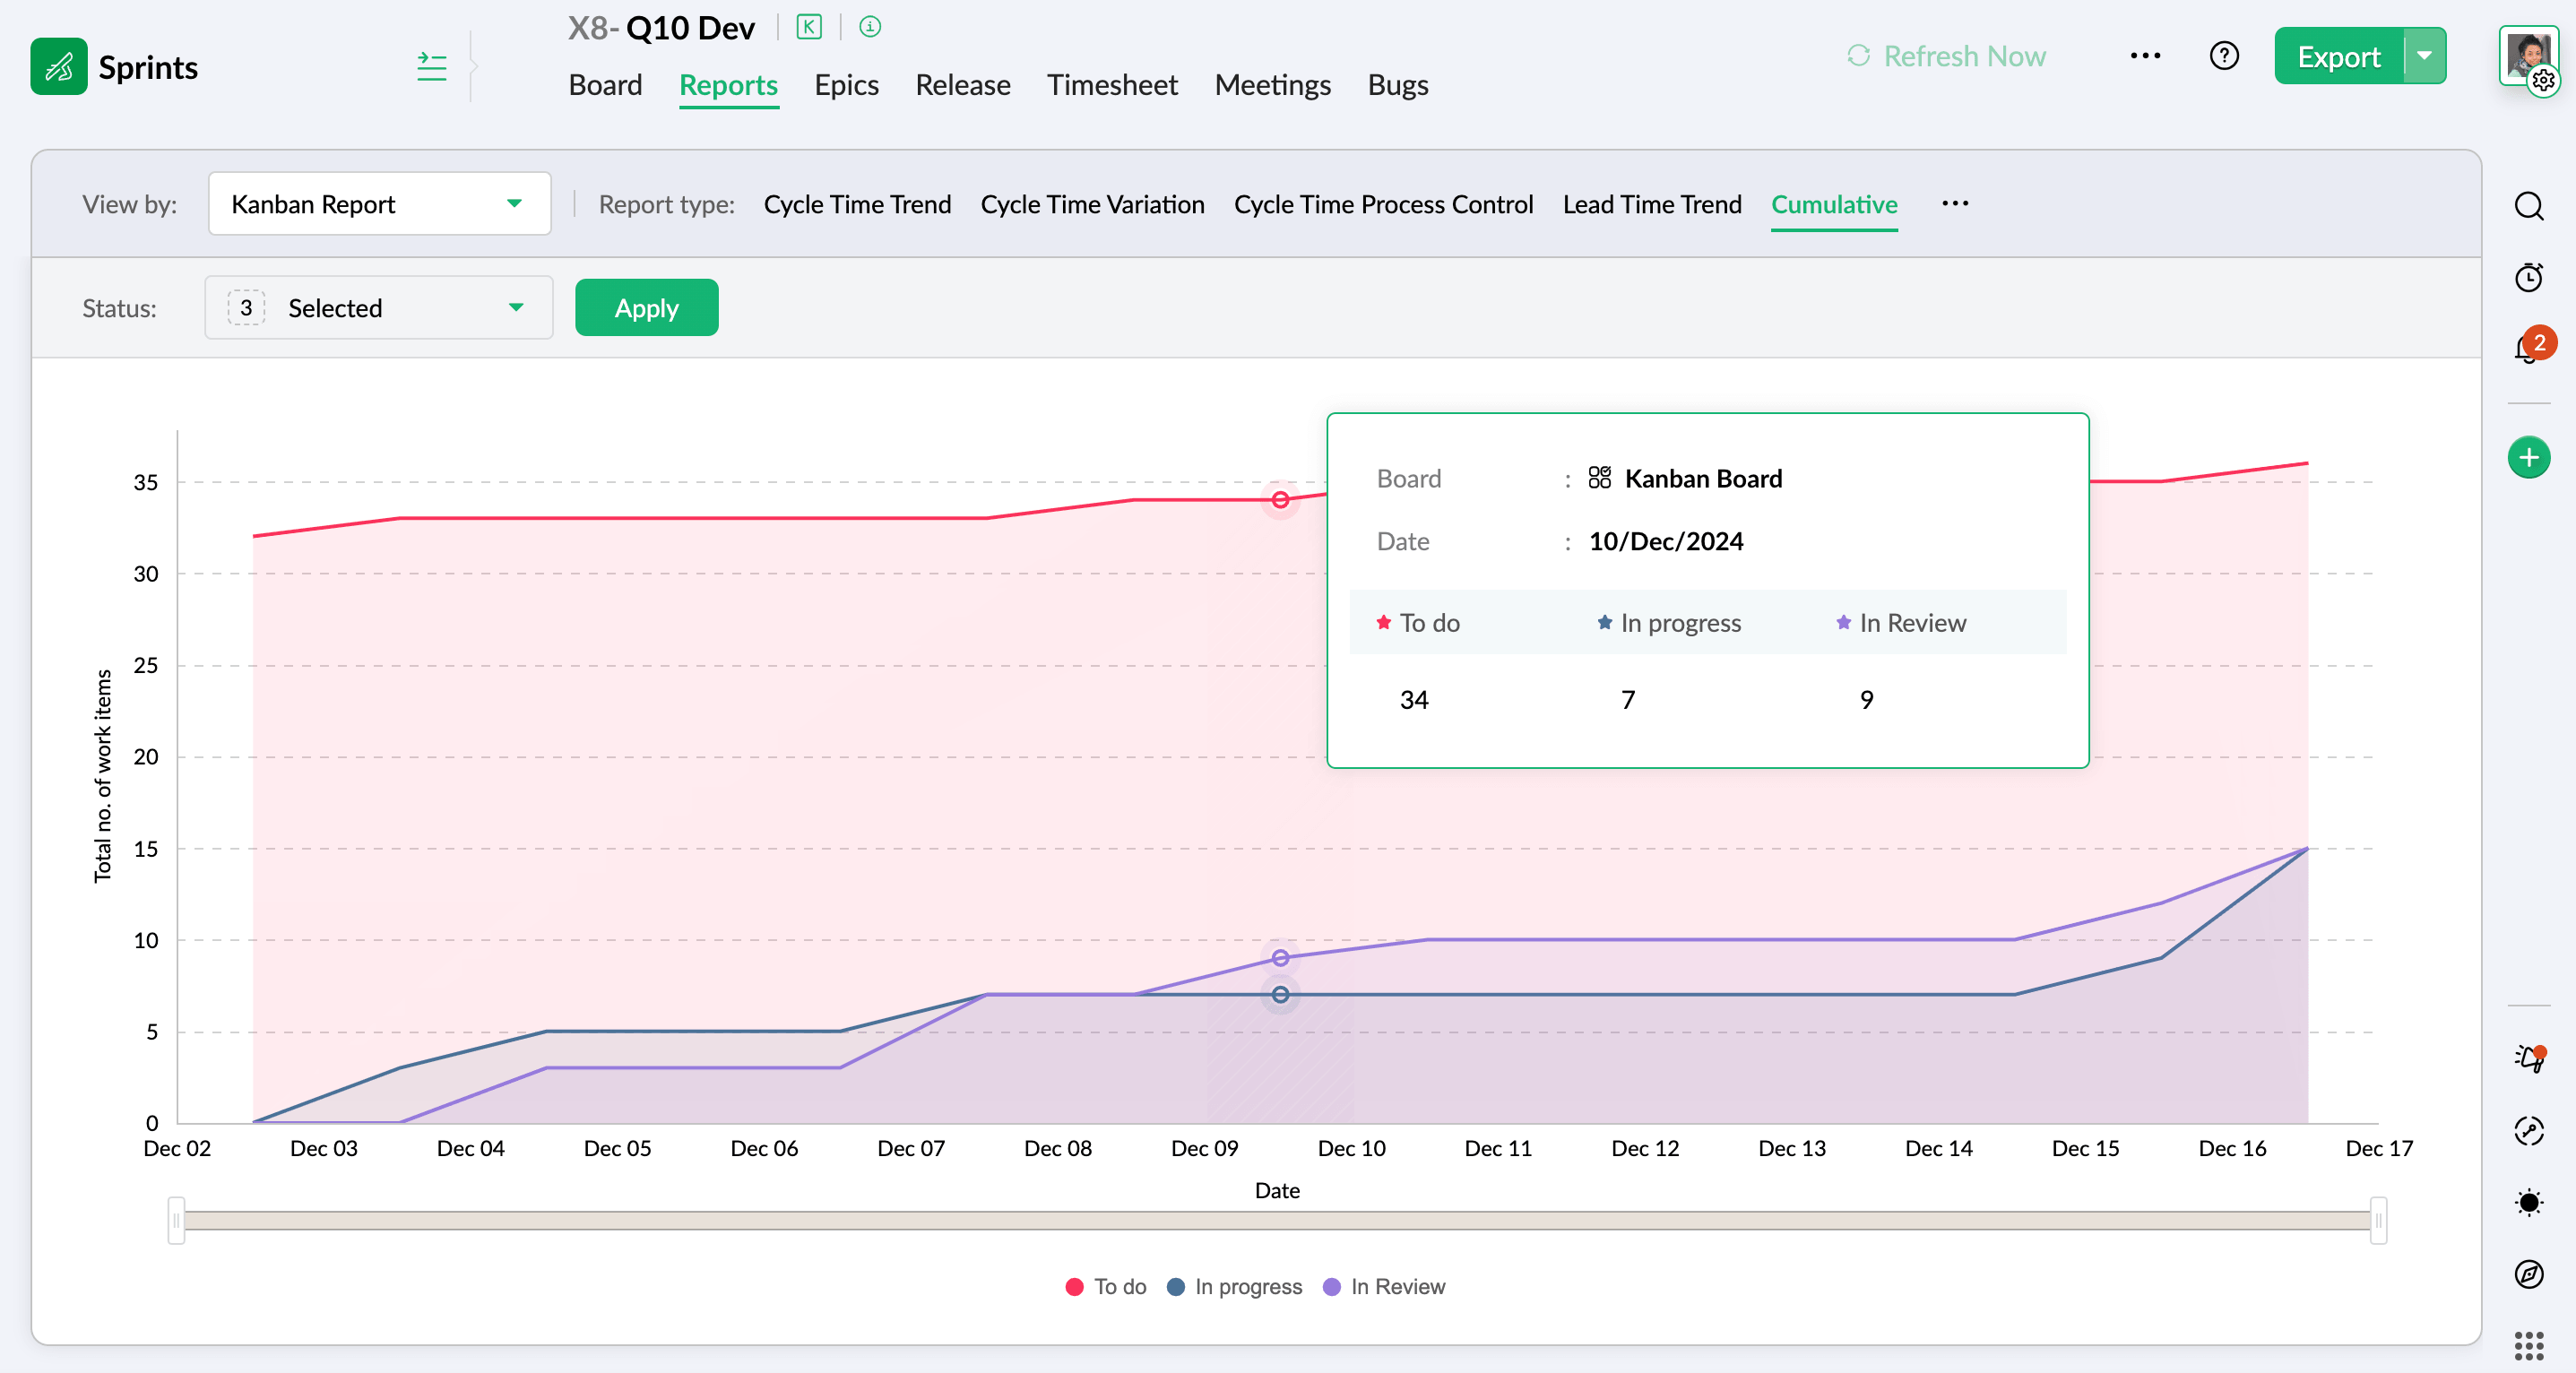
Cumulative flow diagram (CFD): This chart maps the number of work items in each status over time. Widening bands indicate that work is piling up in a stage faster than it clears. This is your clearest visual cue for a bottleneck and rising WIP.
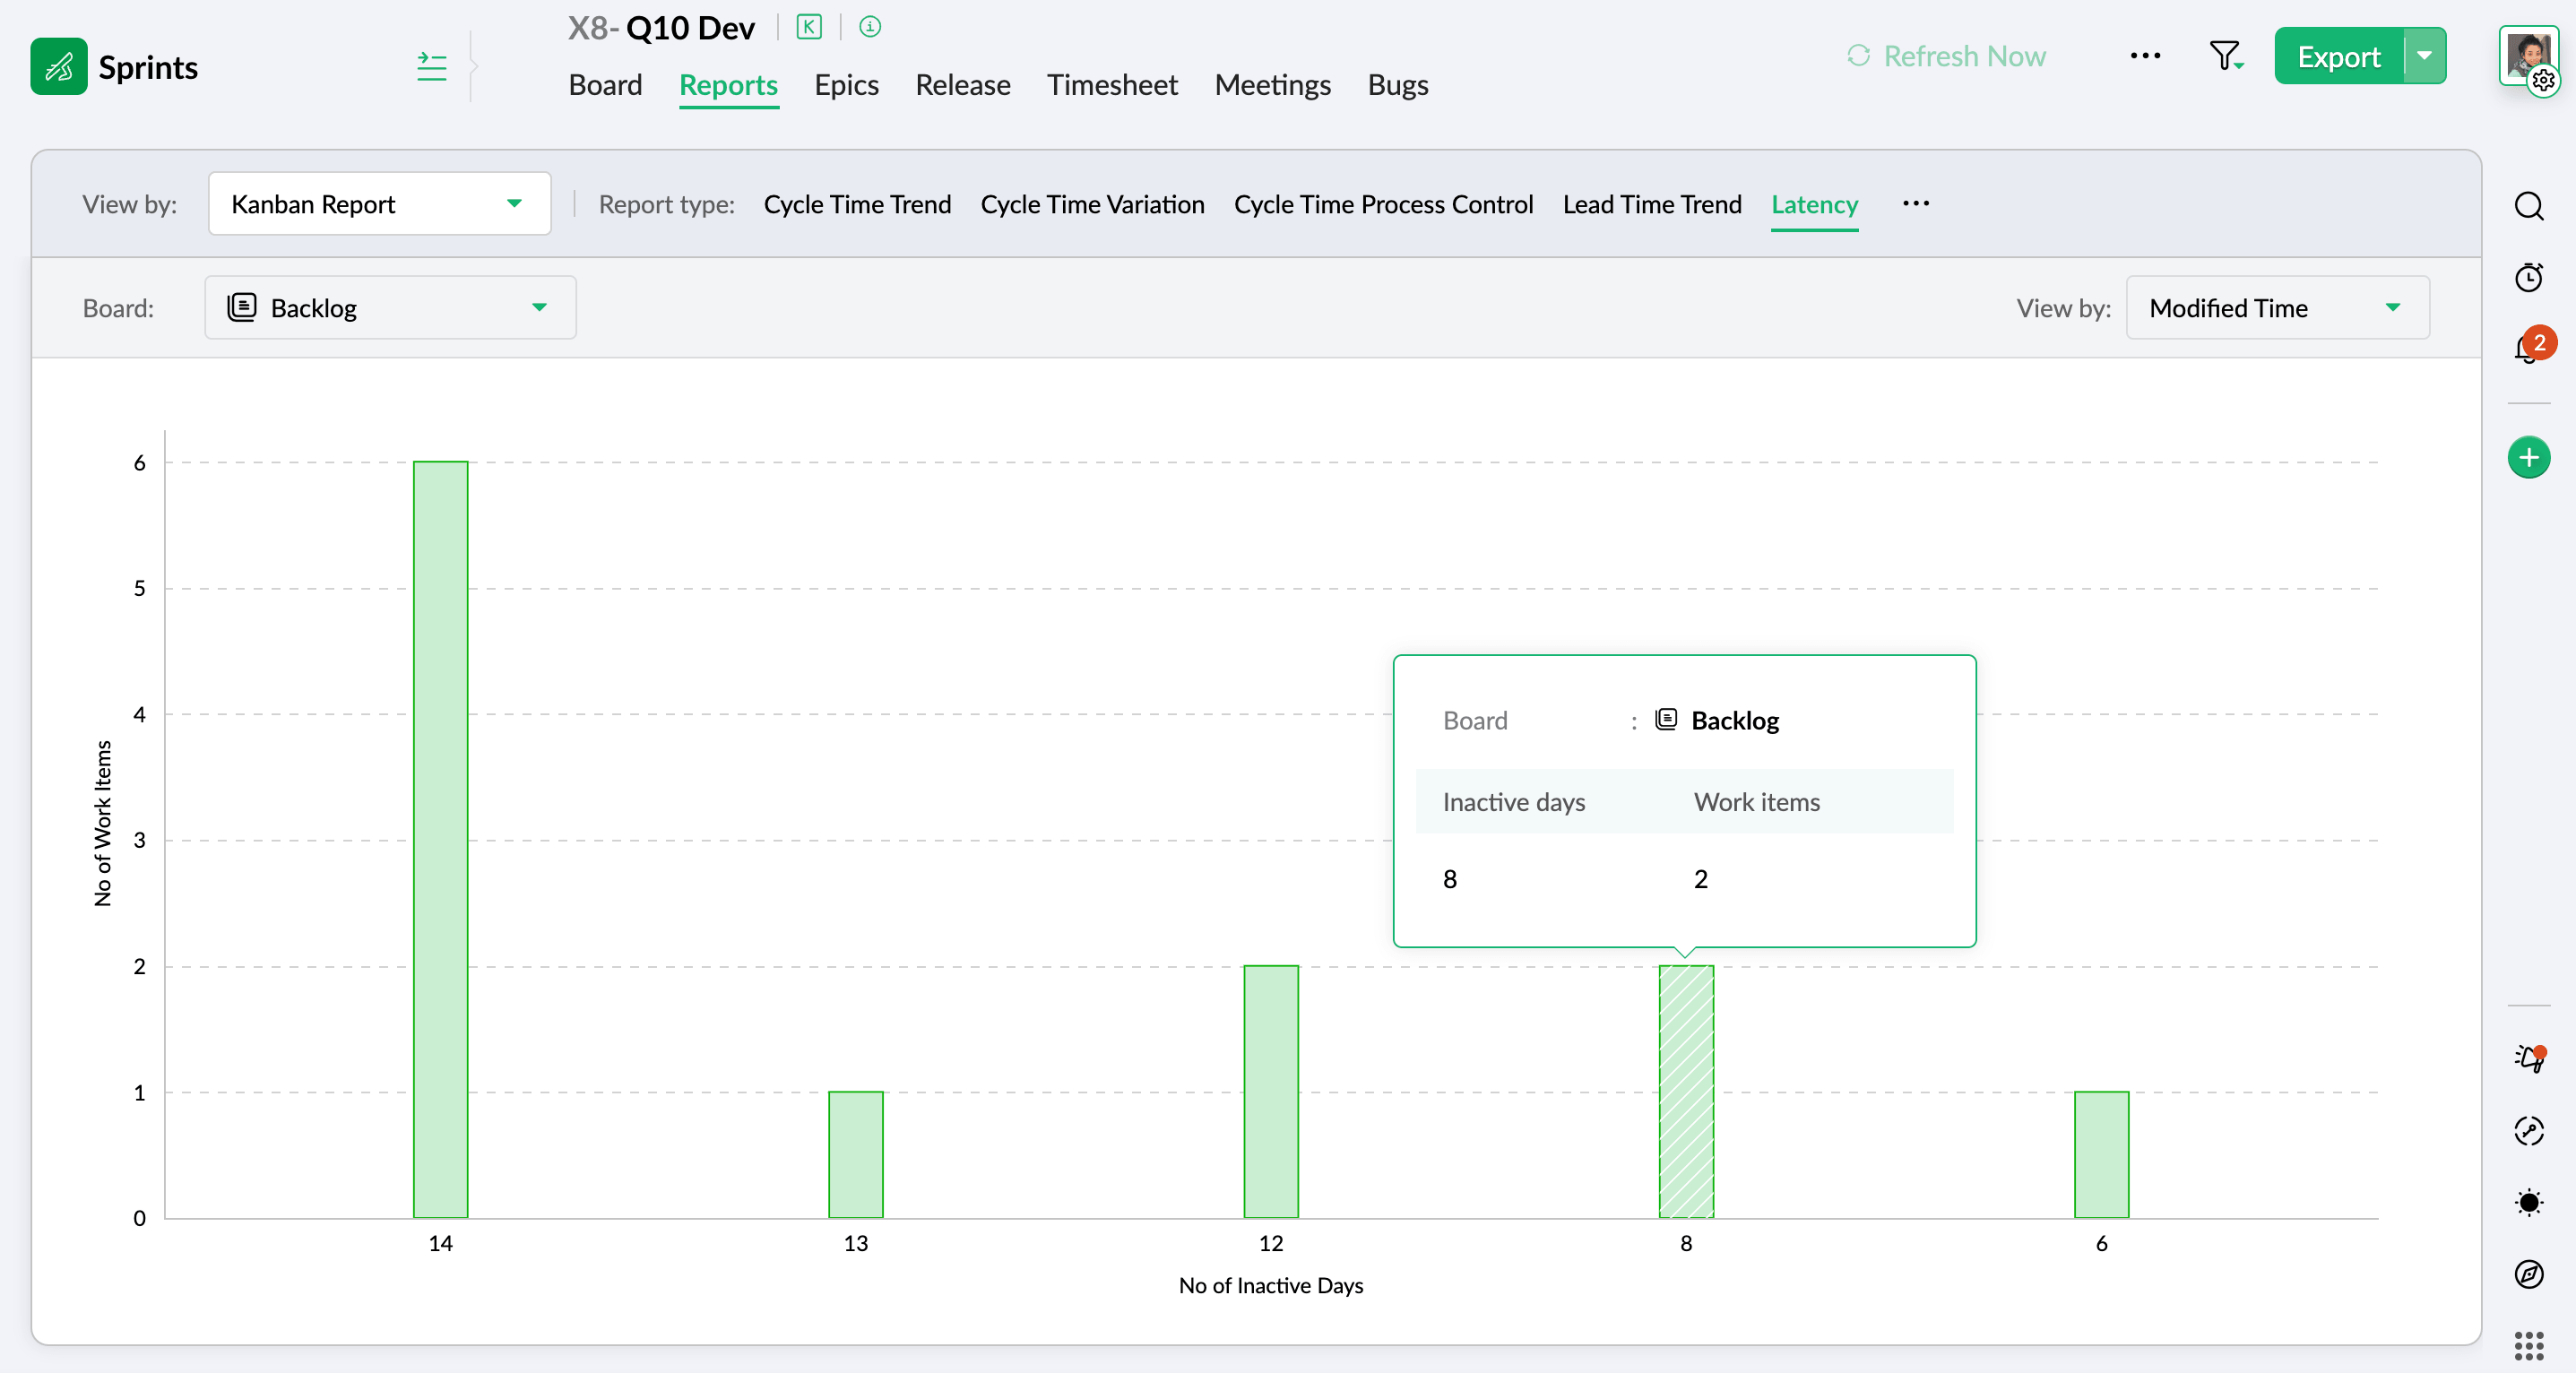
Latency chart: Tracks the inactive days of items on your board or backlog, i.e. work that isn't blocked so much as forgotten. It surfaces the silently aging items that the flow reports can miss.
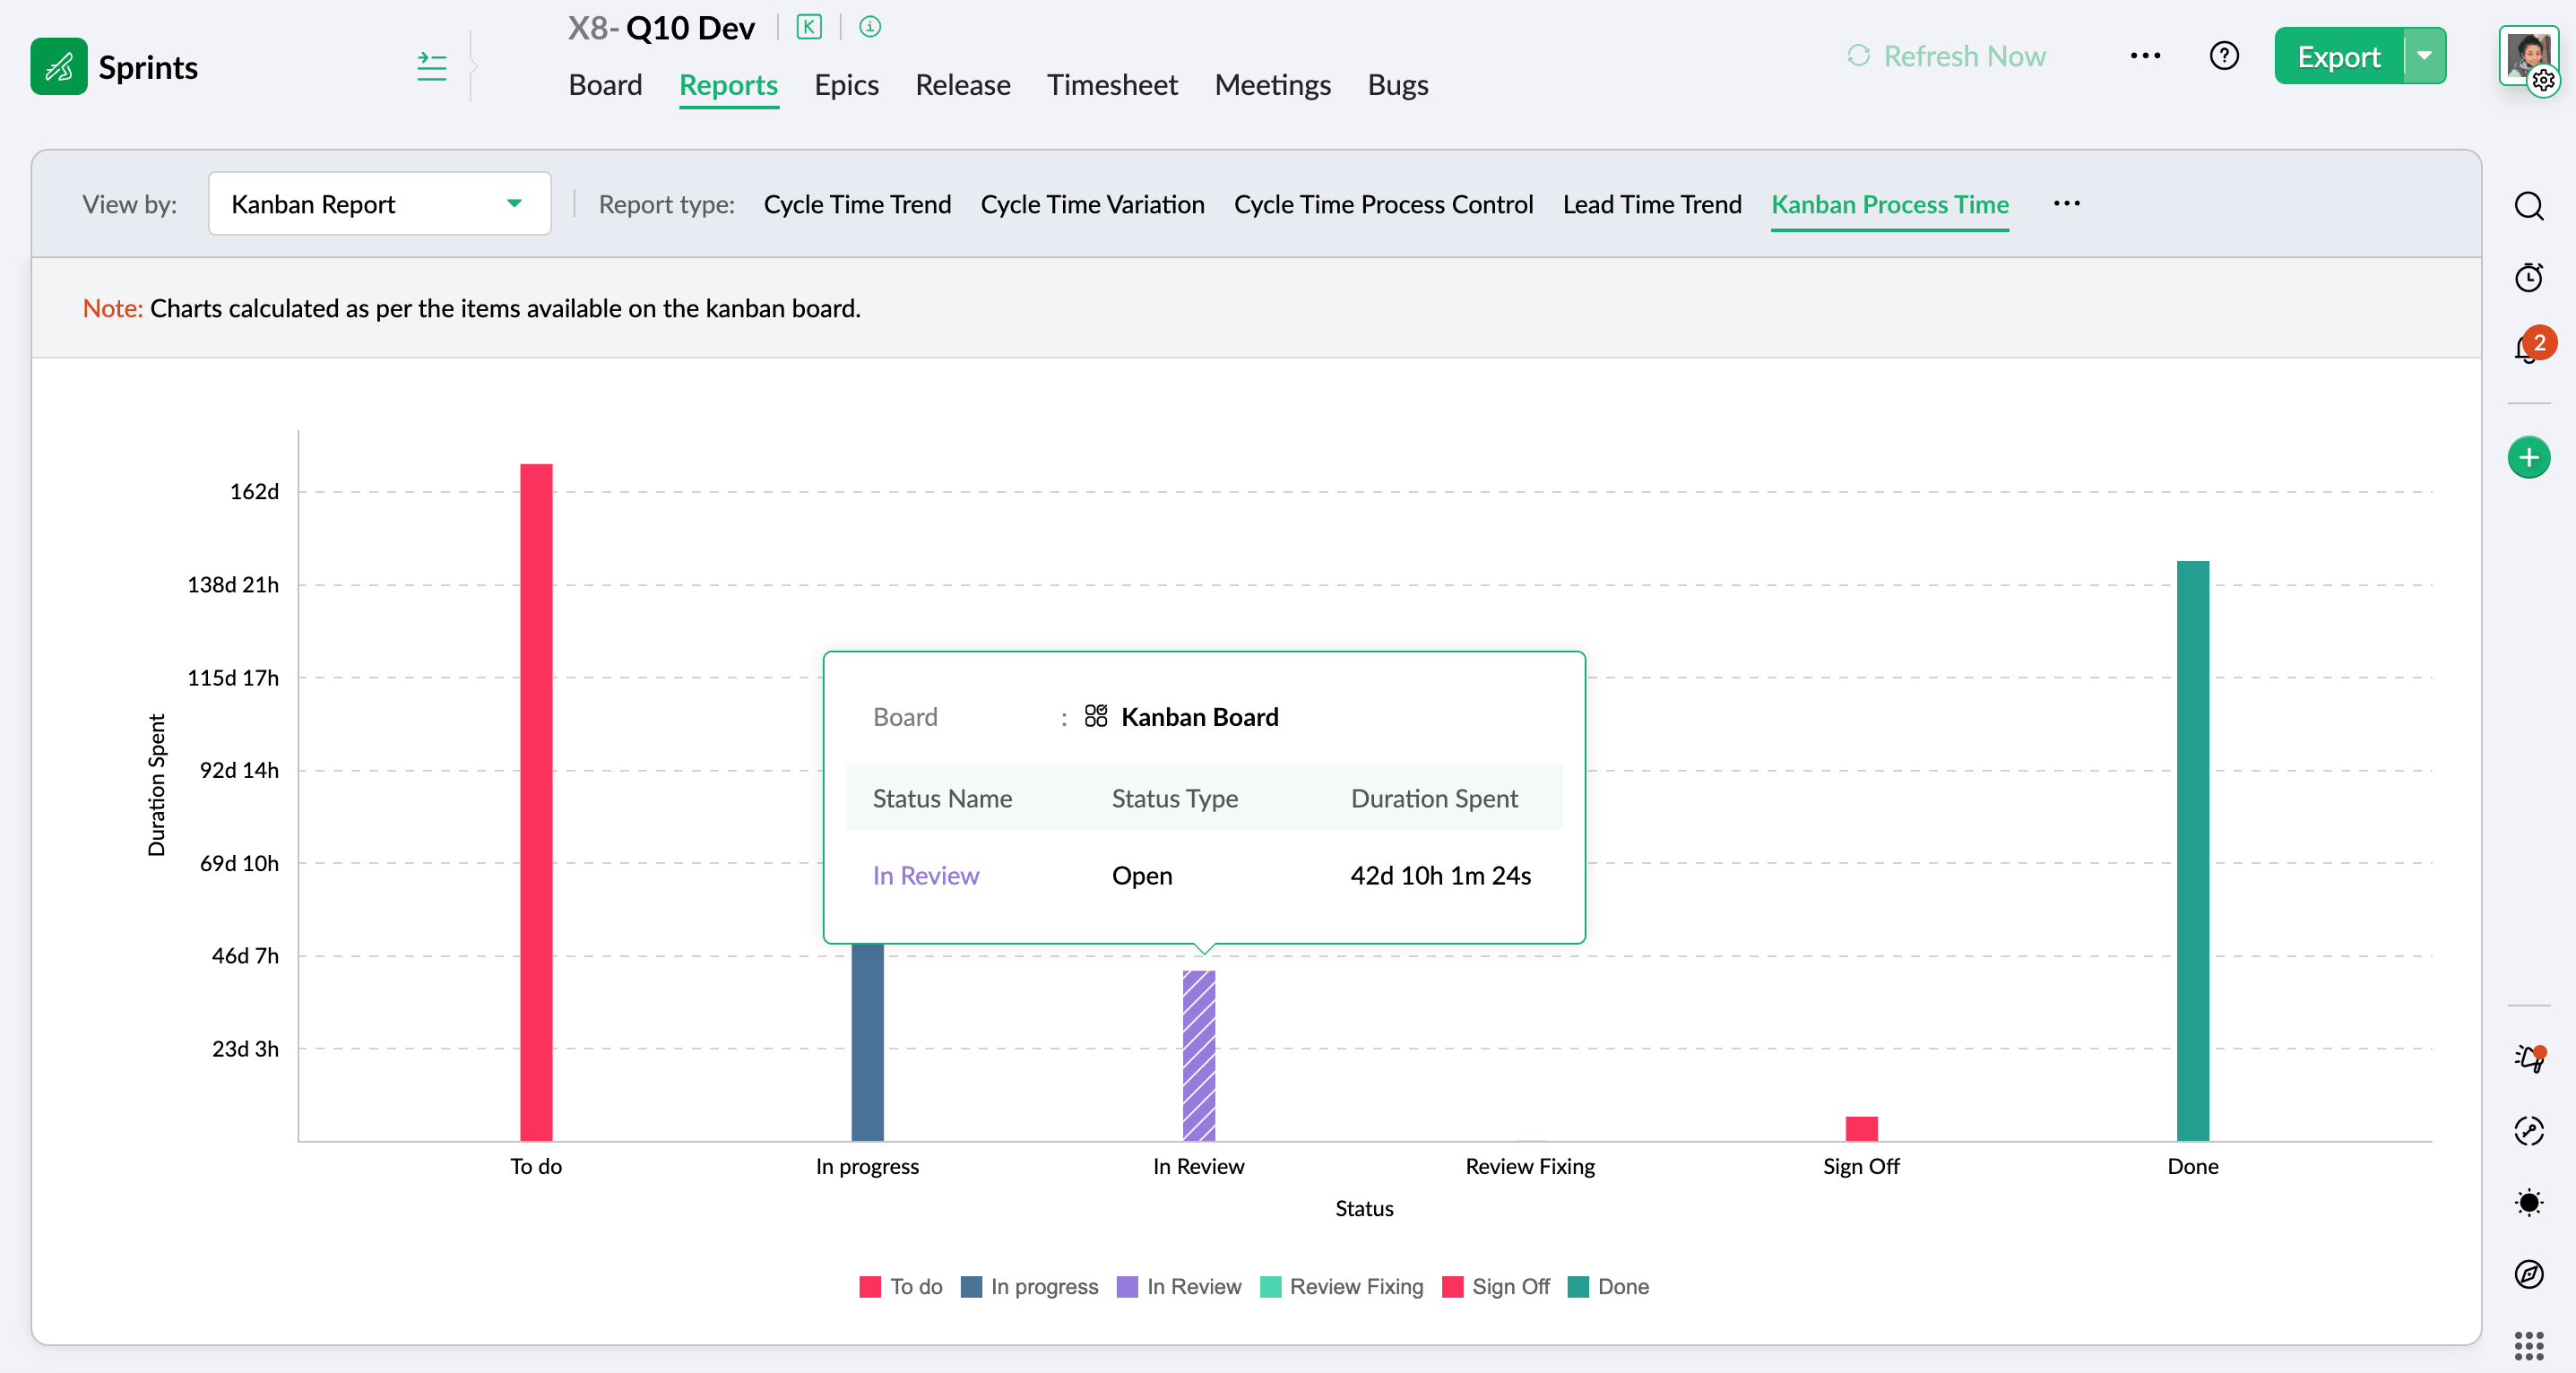
Kanban process time: Aggregates the total time all items spend in each status across the board. While the CFD displays buildup visually, this chart quantifies the precise column that is eating the most time, so you know where to direct your focus.
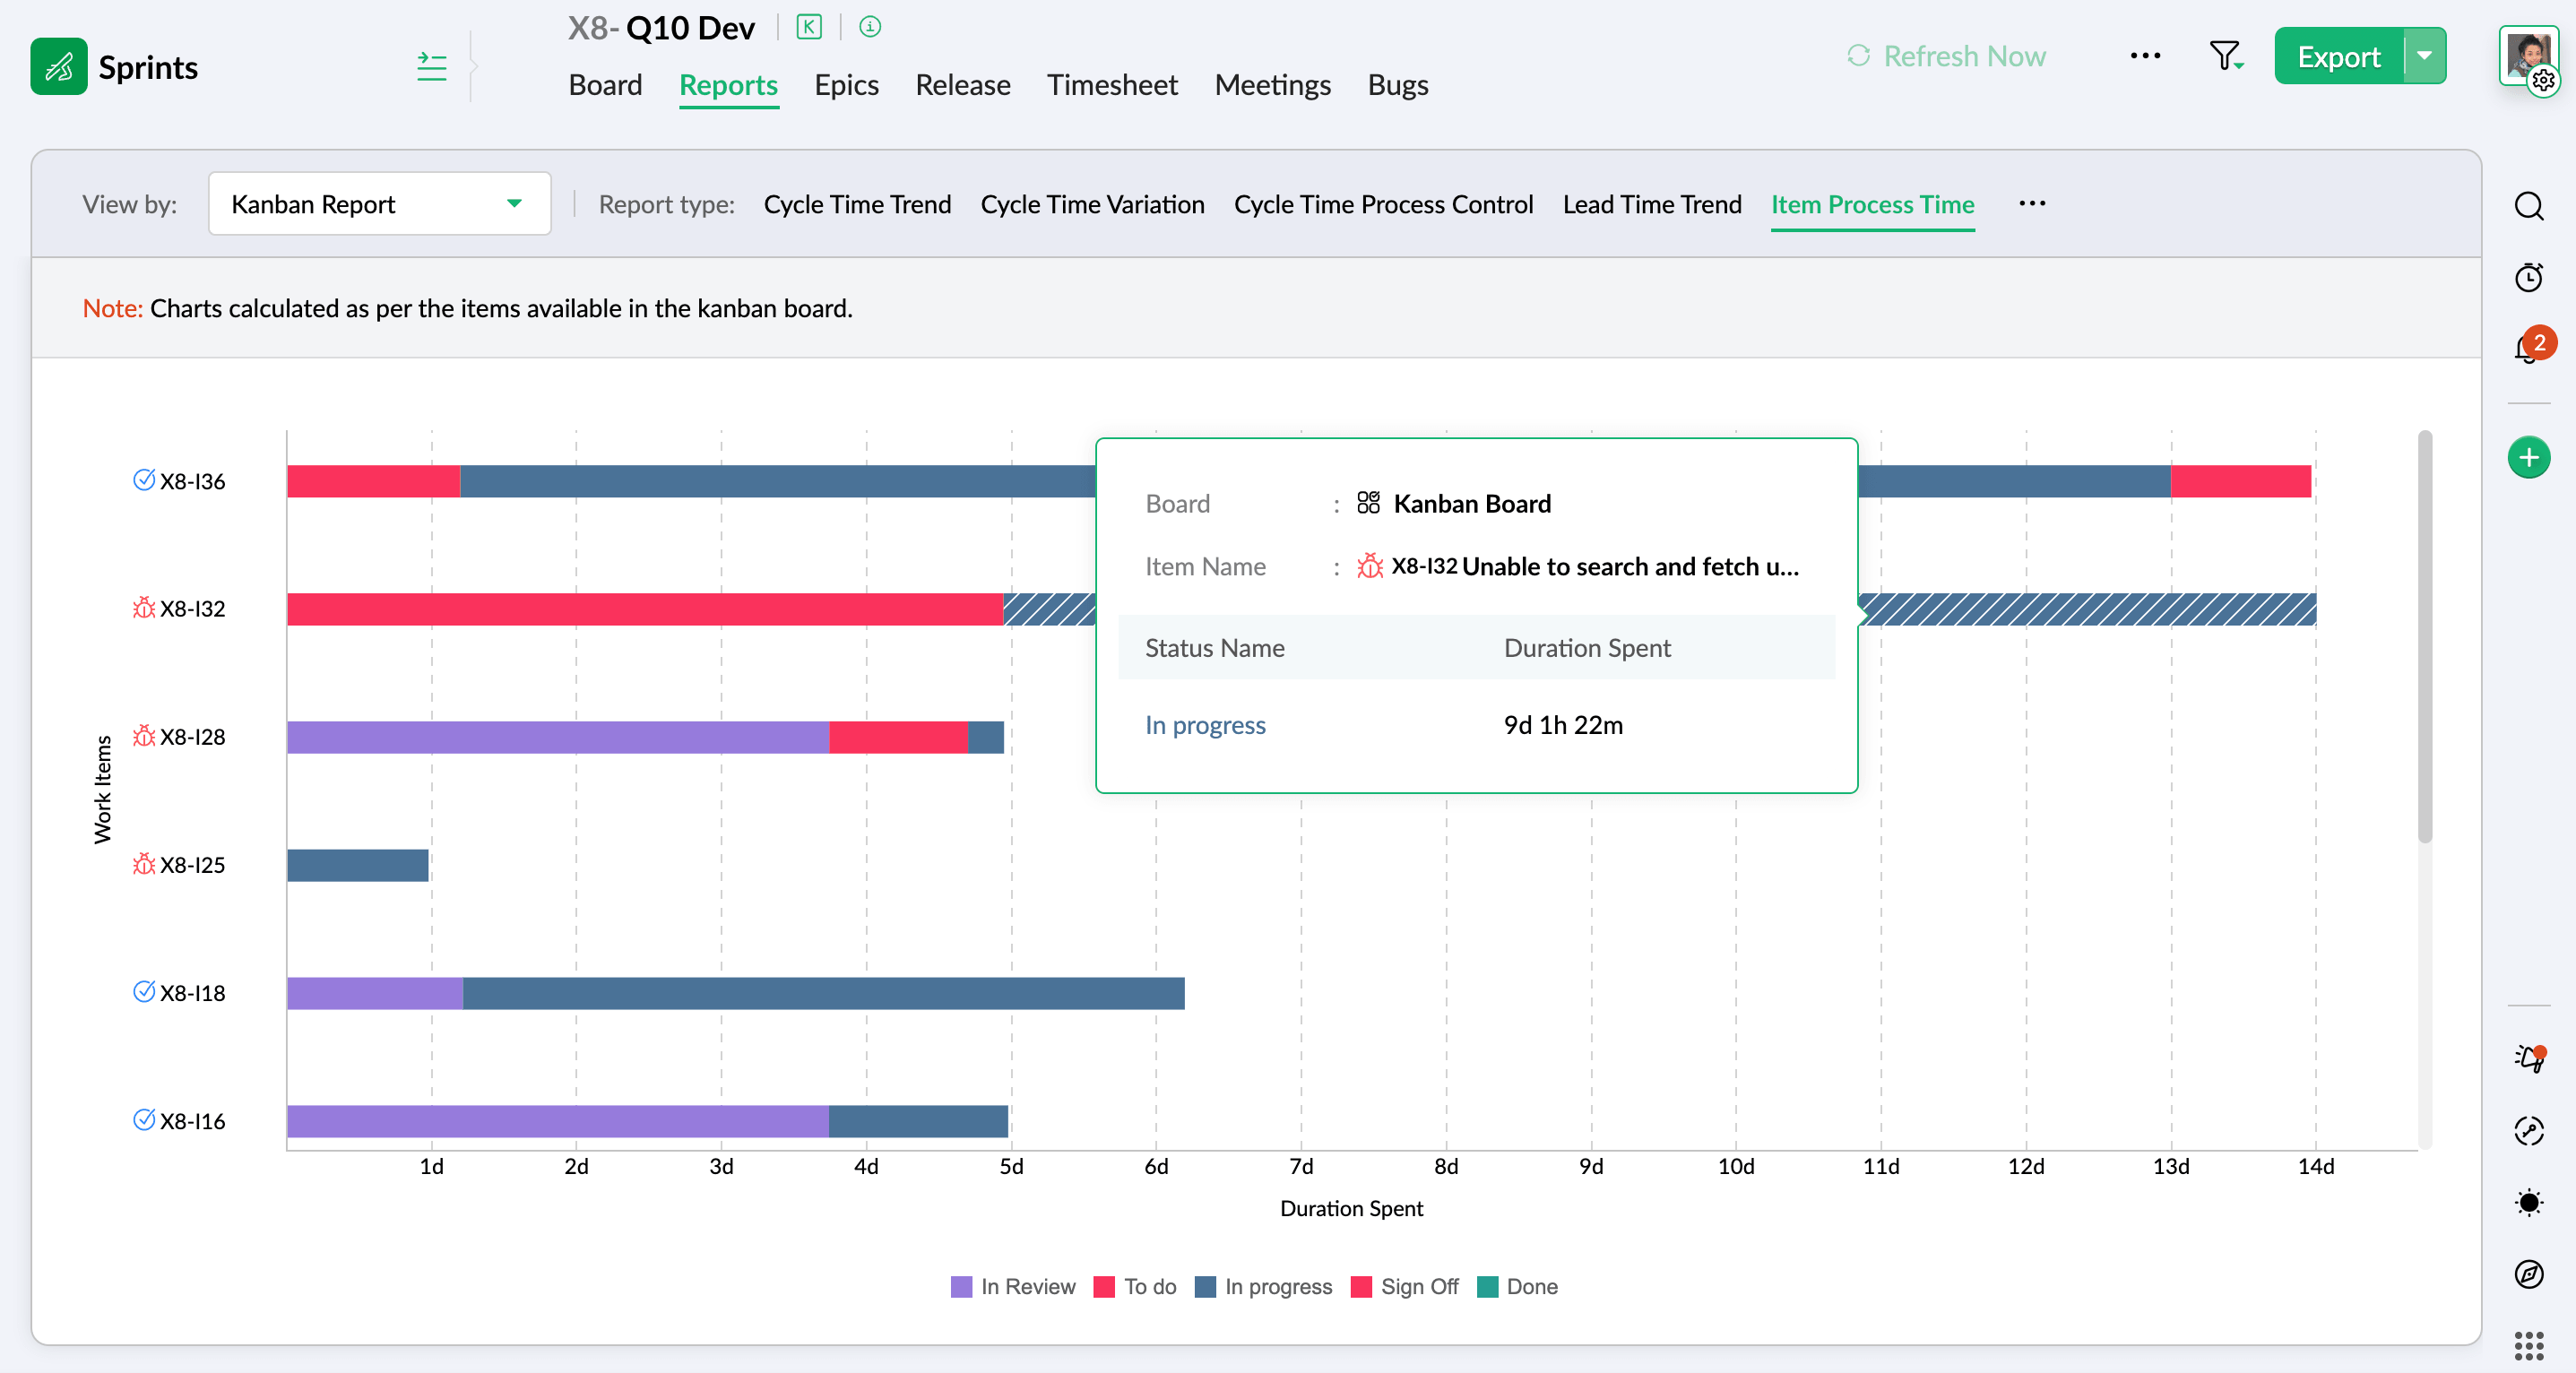
Item process time: Displays the time each work item on the board spends in each status. It's how you find the specific card that's been sitting untouched while everything around it moves.

4. Completion reports
These reports track output against estimation for a longer-range view of progress.
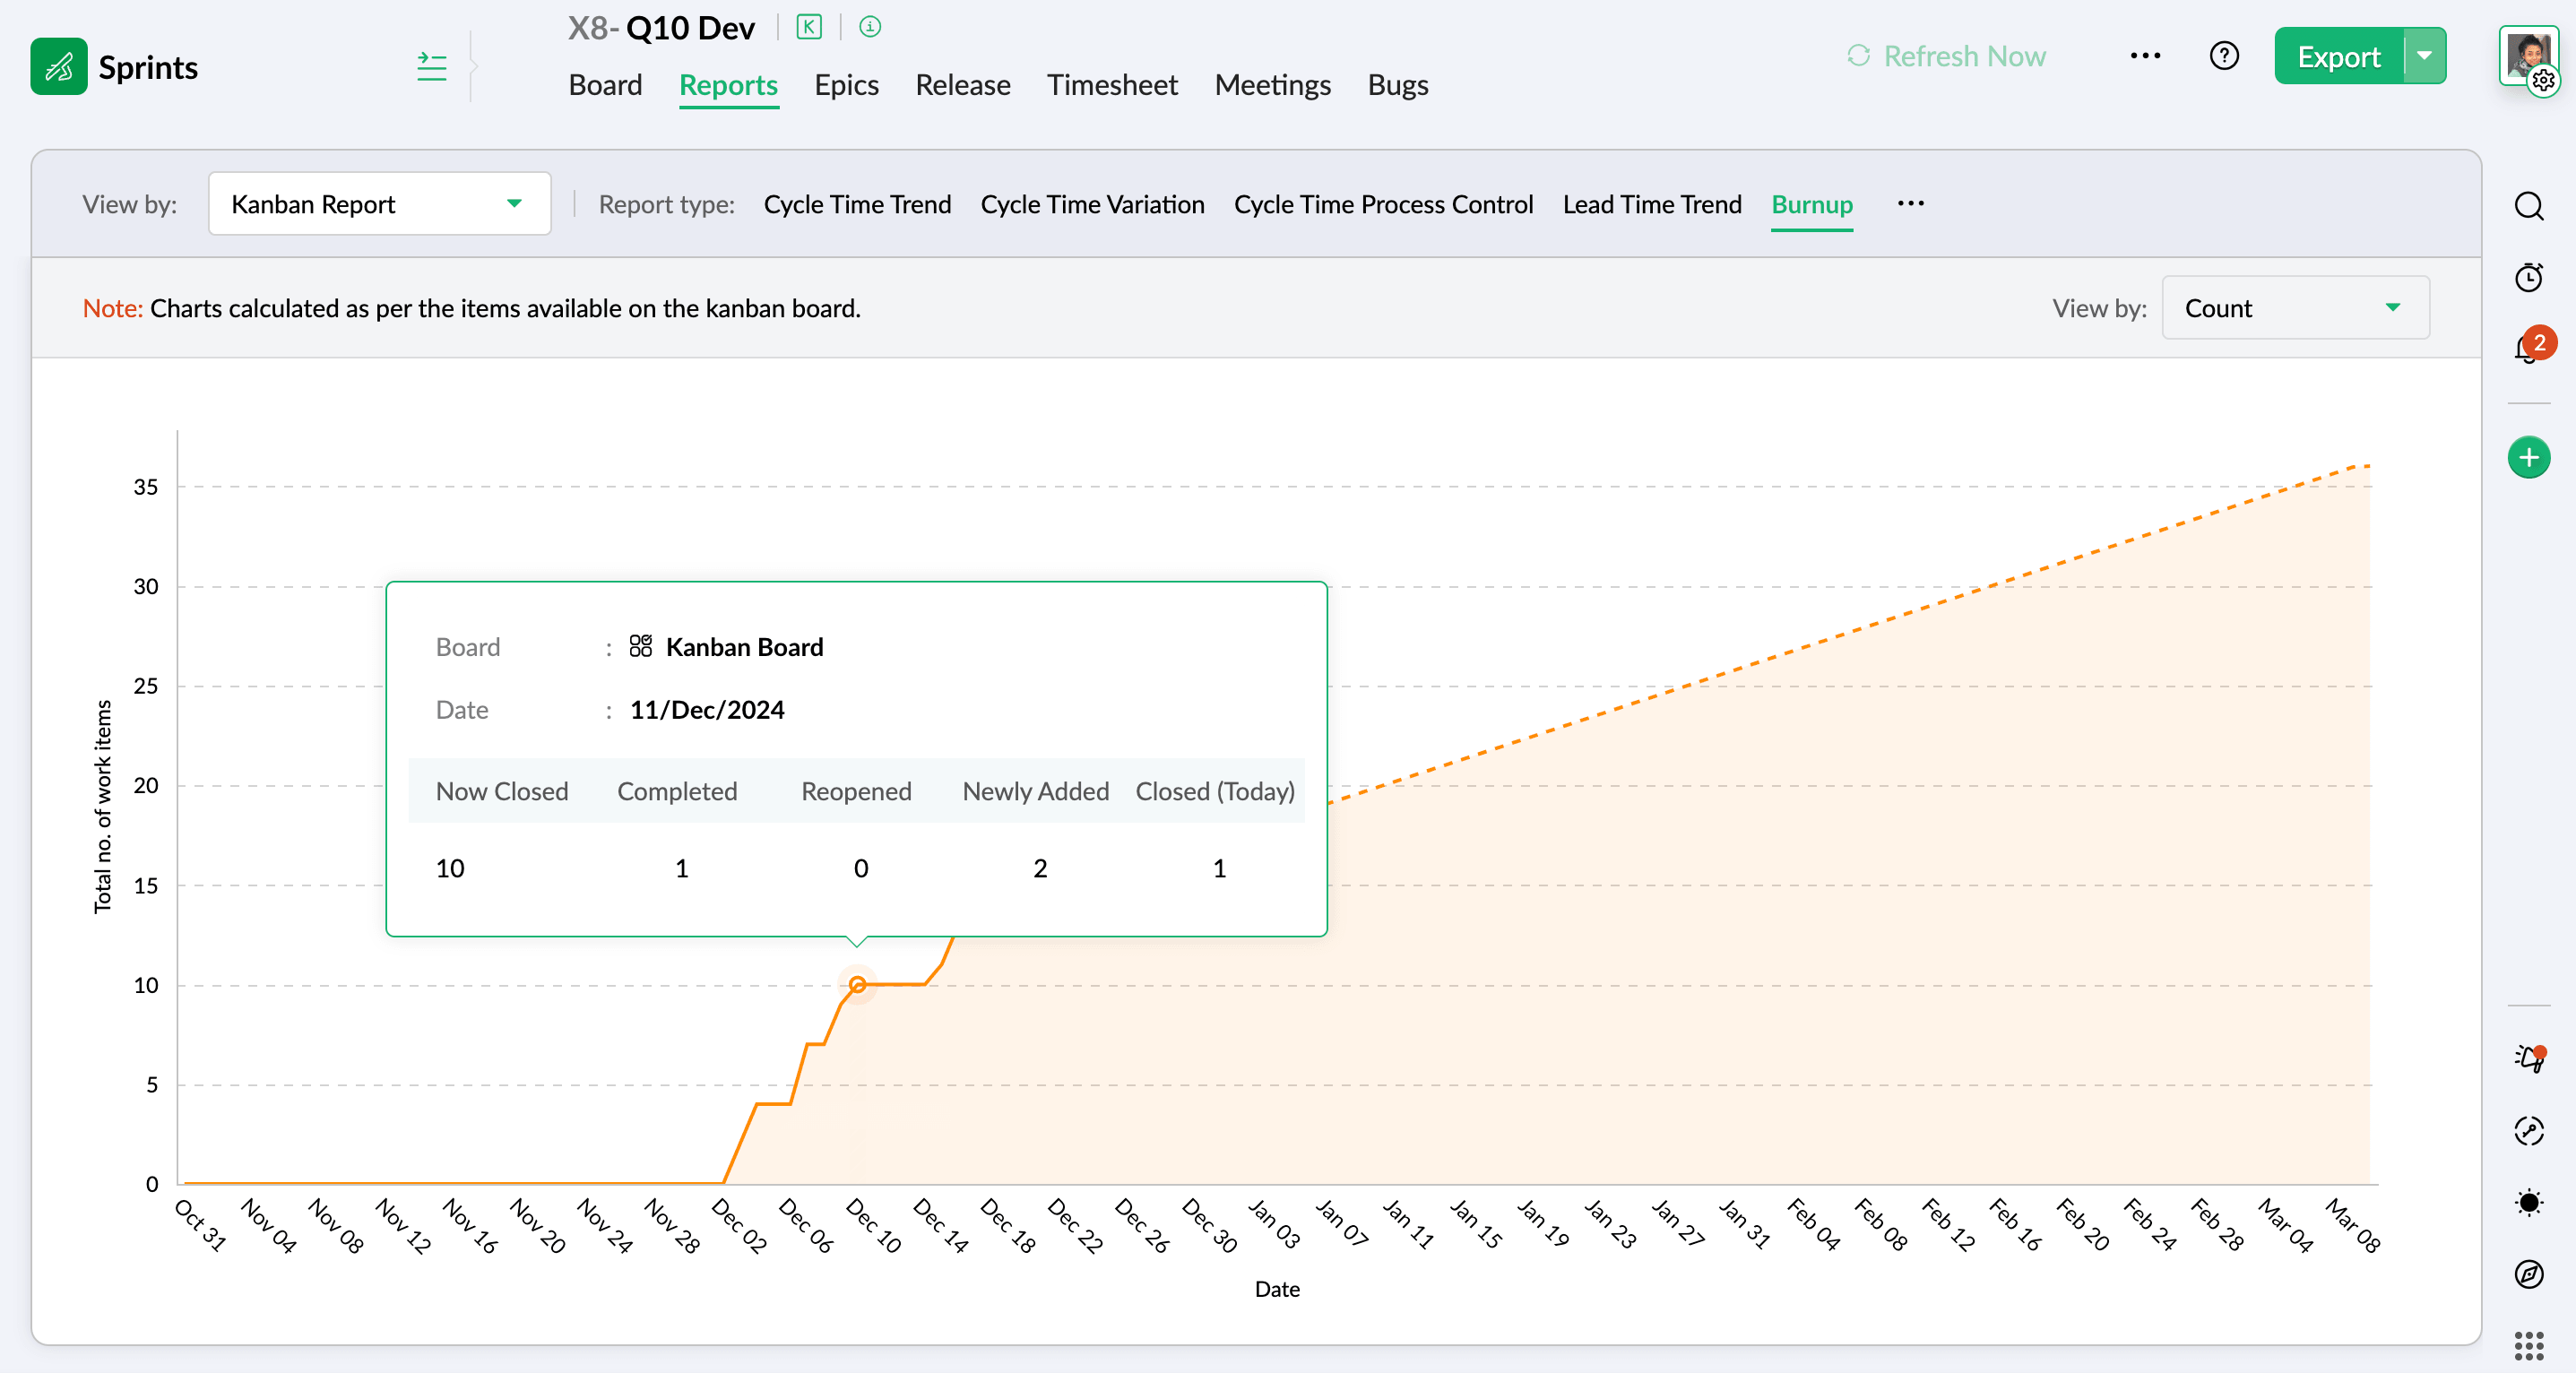
Kanban burnup: Plots completed estimation points or items over time, showing how much work has been delivered and at what pace.
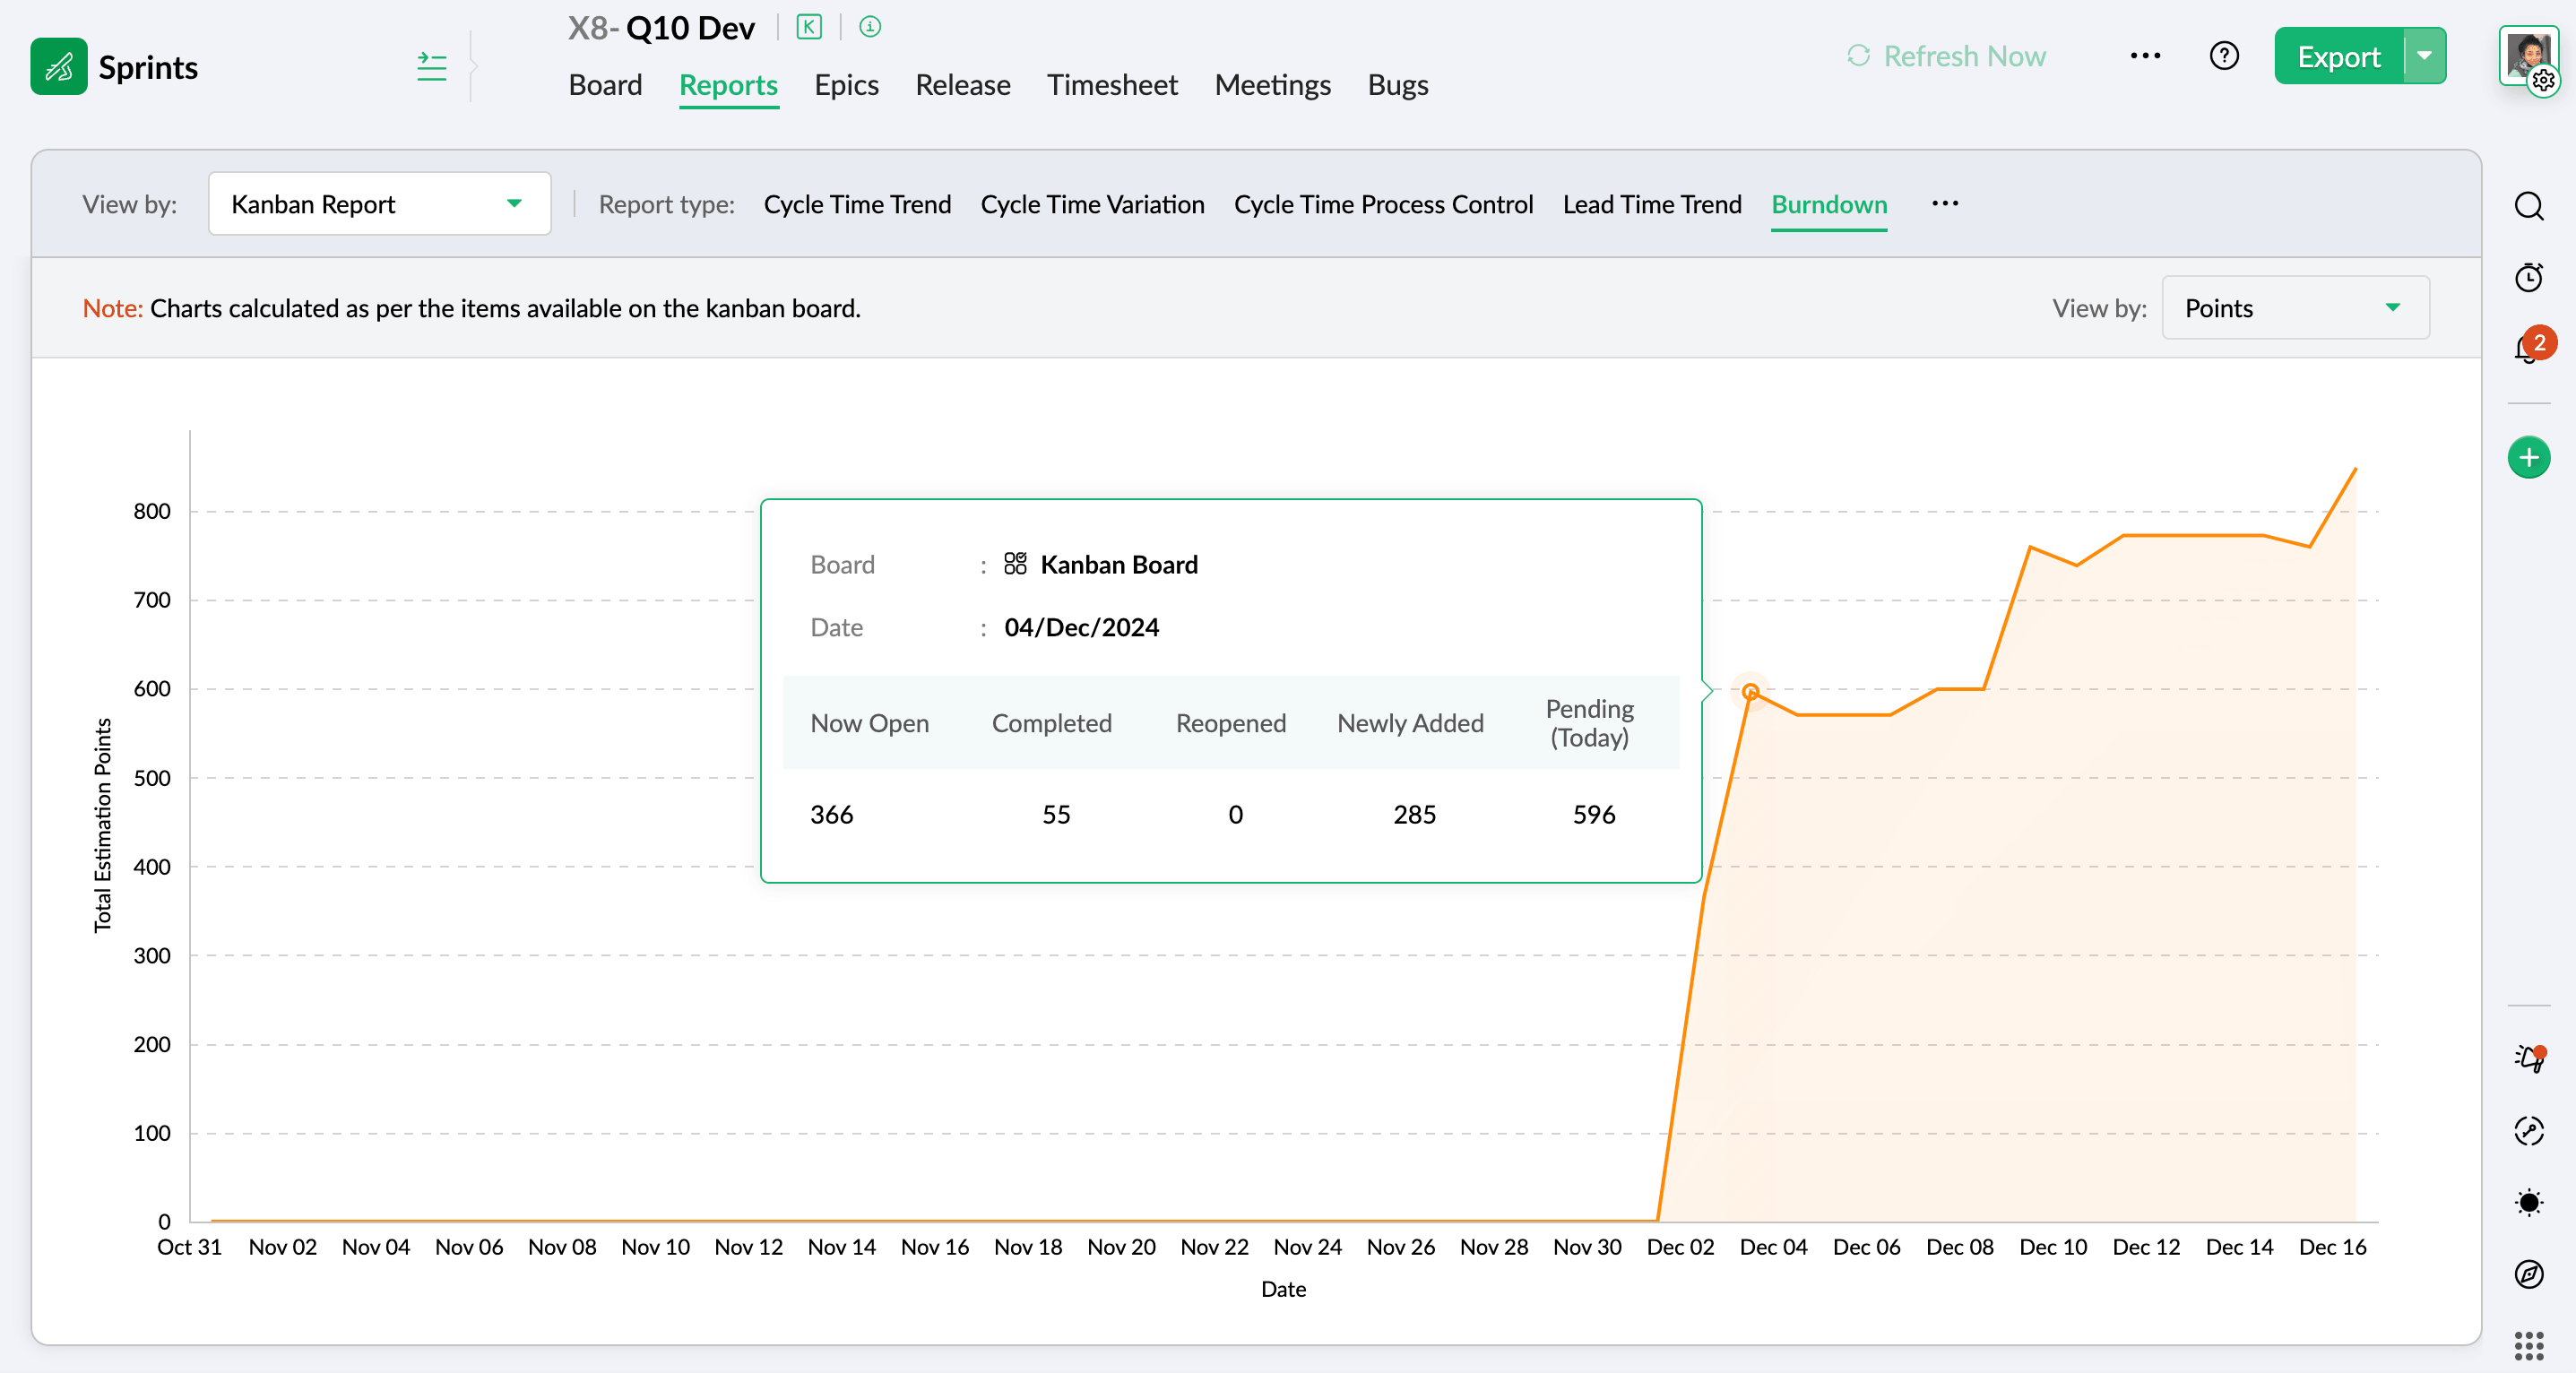
Kanban burndown: Plots the pending estimation points or items instead, showing how much is left and whether you're trending toward clearing it.
5. Module-specific reports
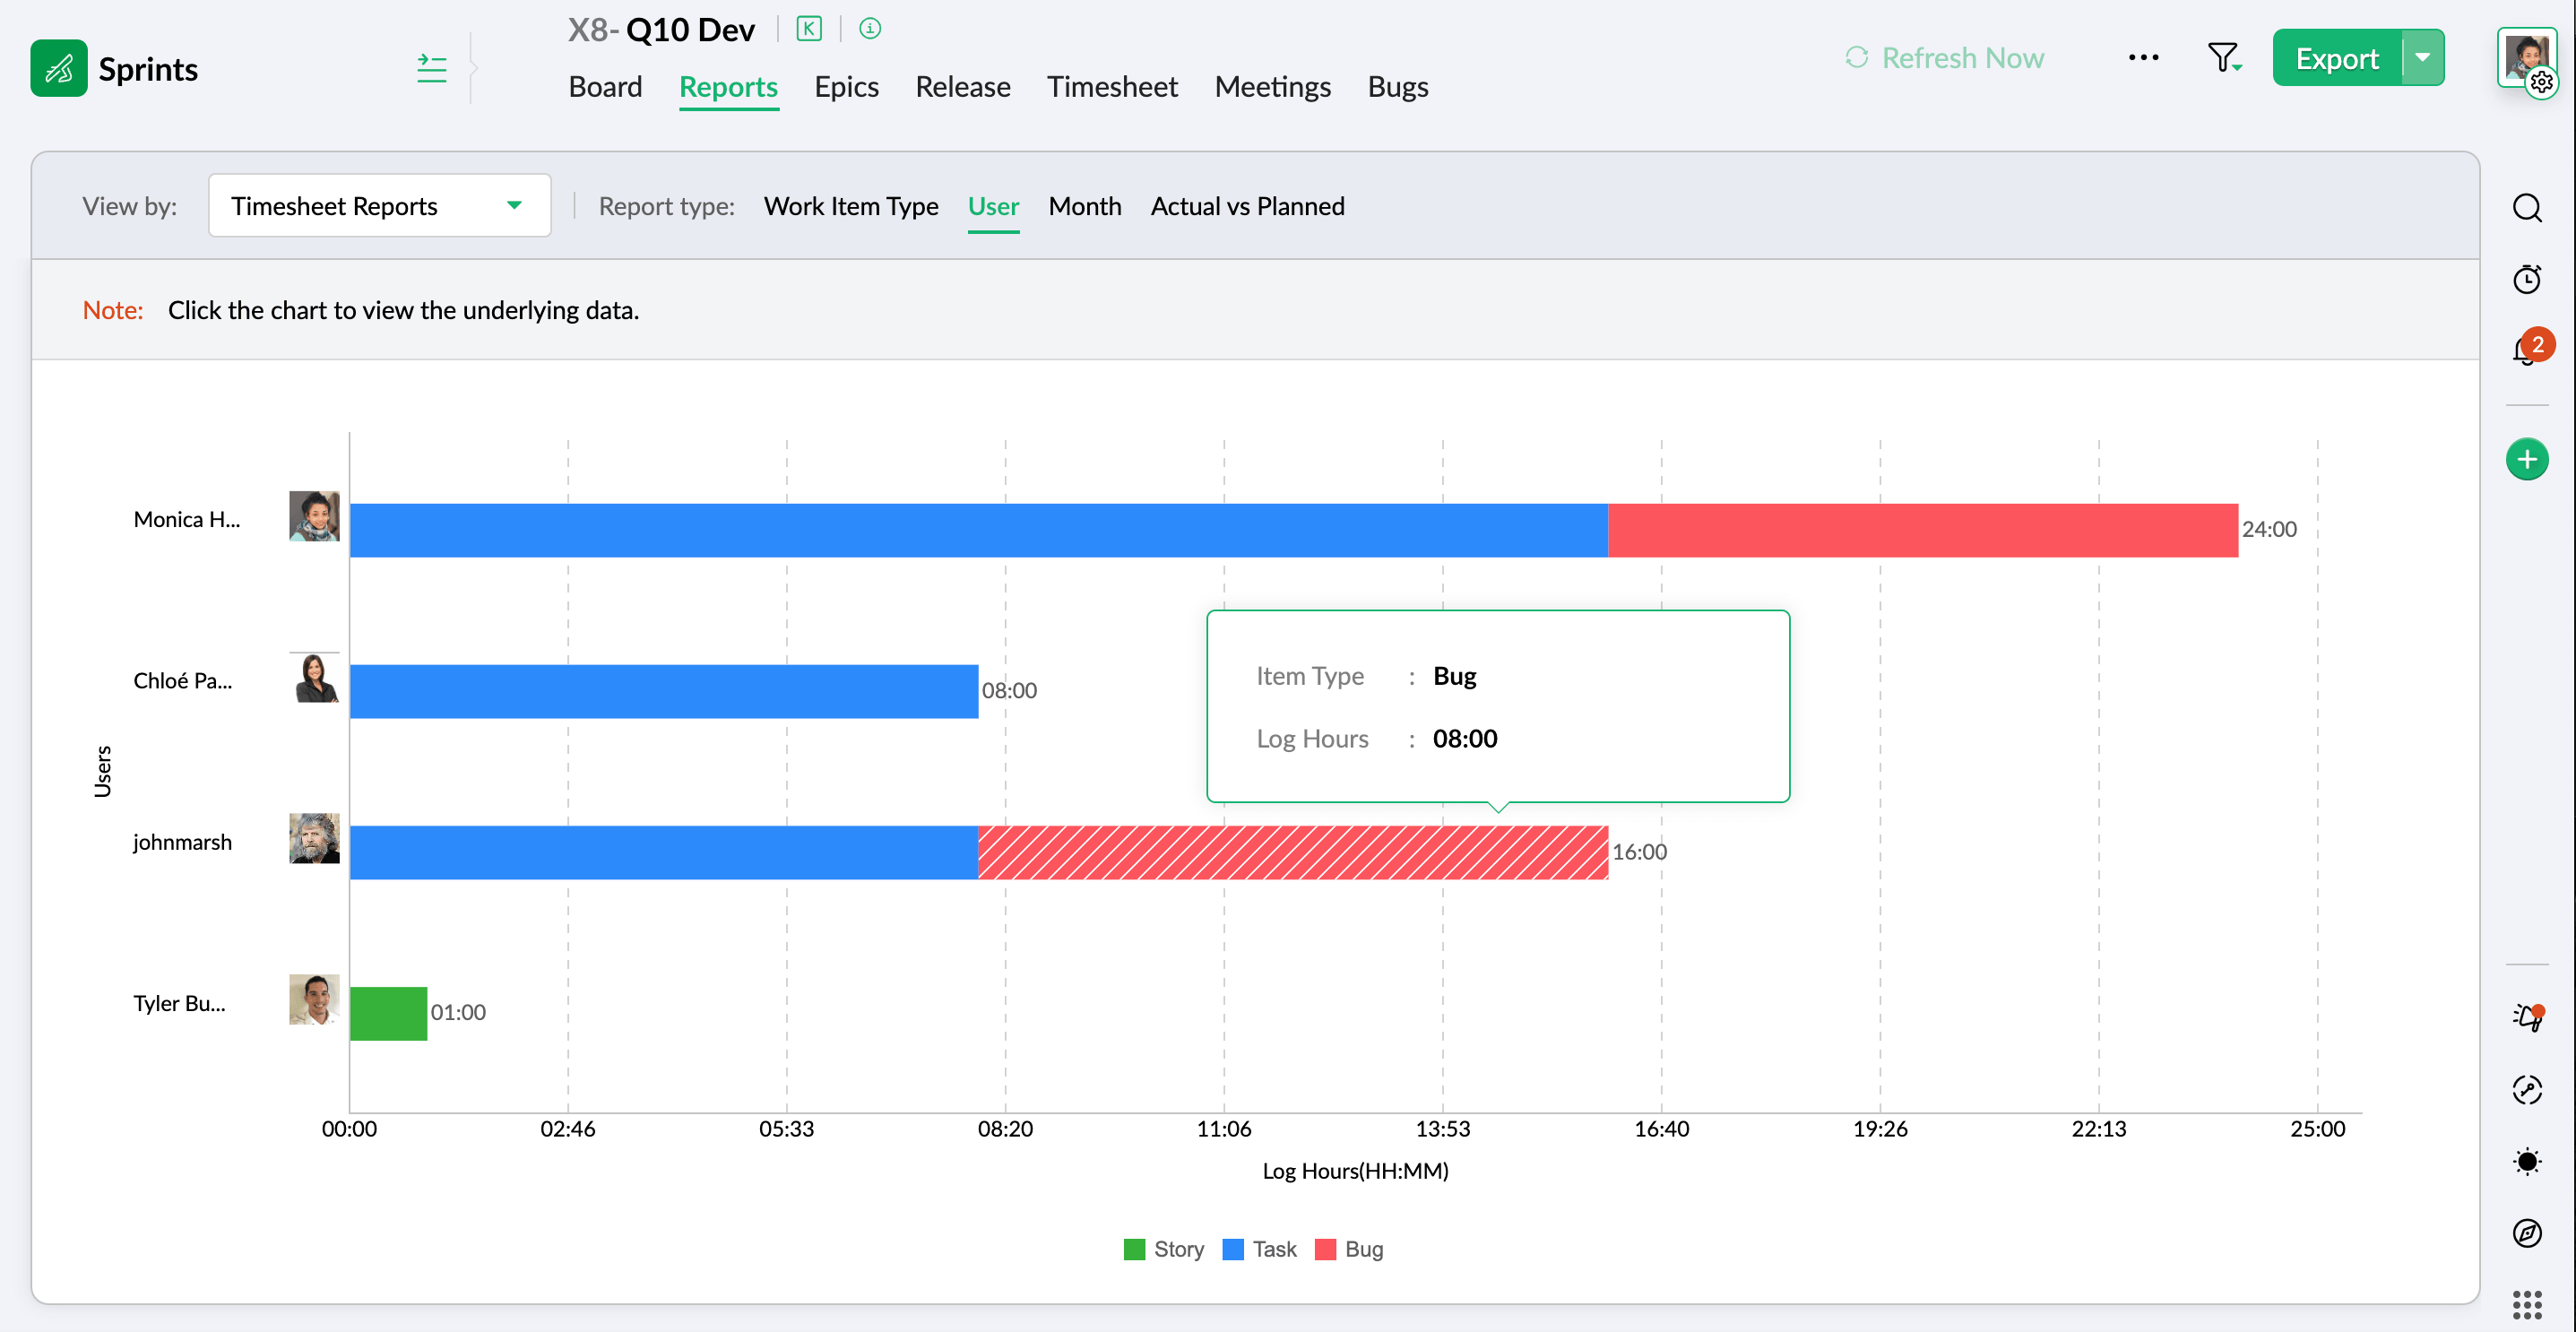
In addition to flow metrics, Zoho Sprints also provides reports tied to specific modules like Epic, Release, and Timesheet. These can assess progress on larger bodies of work and analyze logged effort alongside your board-level flow data. These consist of crucial charts such as Release Completion, Actual vs Planned and many more.
Frequently Asked Questions
Kanban cycle time is the time an item exits "Done" minus the time it moved out of the backlog and entered "In Progress." It measures only the active working period, not the time an item waited in the backlog beforehand. A shorter cycle time means a more efficient workflow.
Kanban metrics measure continuous flow, while Scrum metrics measure work completed within fixed sprints. Kanban primarily tracks cycle time, lead time, throughput, and WIP, while Scrum tracks sprint-based measures like velocity and burndown. Since Kanban, in principle, has no timebox, per-sprint velocity doesn't apply the same way.
WIP limits improve Kanban metrics by capping how many items are in progress at once, which shortens cycle time. Fewer items mean less context-switching and faster completion. By Little's Law itself, lowering WIP reduces cycle time when throughput holds. They also expose bottlenecks the moment a column fills up.
The clearest way to spot a bottleneck is a cumulative flow diagram (CFD), where a widening band shows work arriving faster than it clears. Rising WIP in one column alongside climbing cycle time points to the same issue. Process-time reports then confirm which status is eating the most time.
The core charts are the cumulative flow diagram, cycle and lead time reports, and process-time reports. The CFD shows WIP and bottlenecks at a glance, cycle and lead time charts show how fast and how consistently work moves, and process-time reports pinpoint where items stall.
Cycle time, especially its variability, is generally the earliest reliable warning of delivery delays. When it climbs or grows unpredictable, delays tend to follow. Aging work items, tasks stuck in progress longer than usual, are the other strong signal.