- HOME
- Industrial IoT
- Cycle Time in Manufacturing: The Complete Guide
Cycle Time in Manufacturing: The Complete Guide
- Last Updated : July 6, 2026
- 140 Views
- 12 Min Read


Manufacturing is fundamentally about transformation, raw materials enter a process, and finished goods emerge at the other end. The time it takes for that transformation to happen, from the moment a unit begins production to the moment it is completed, is one of the most telling indicators of how well a manufacturing operation is running. This measurement, known as cycle time, sits at the heart of operational efficiency, and understanding it deeply can mean the difference between a plant that struggles to meet demand and one that consistently delivers with precision and speed.
What is Cycle Time?
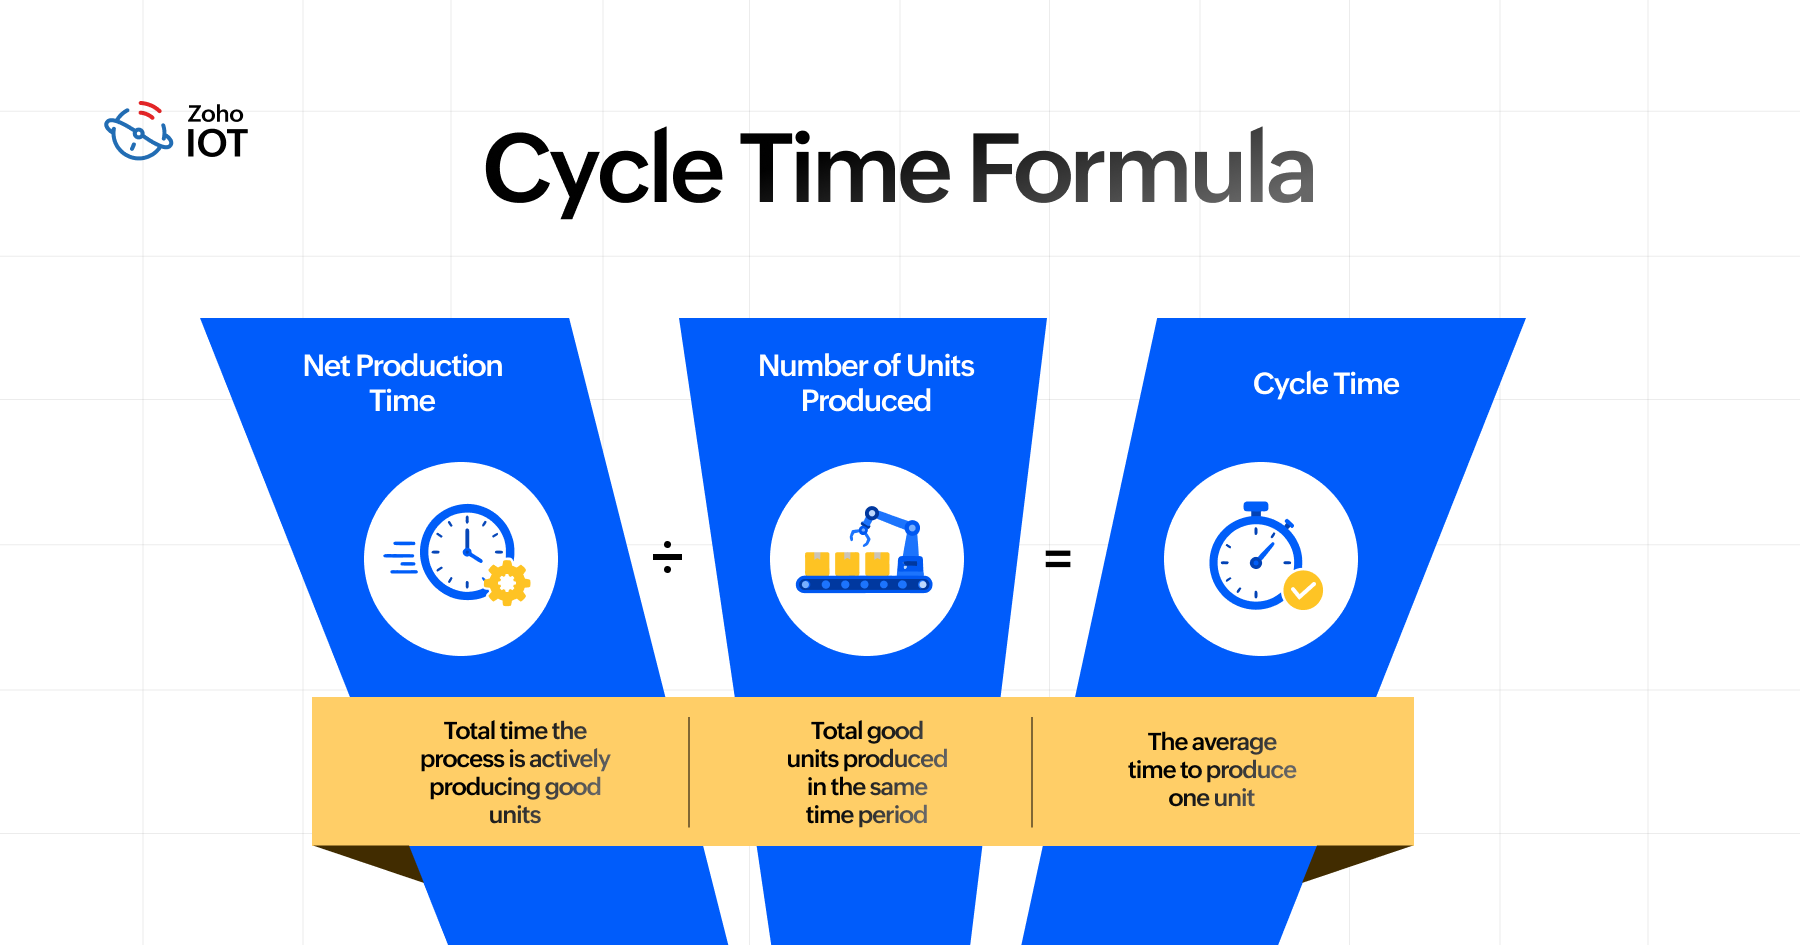
Cycle time is the total time required to complete one unit of production, measured from the moment work begins on that unit to the moment it is finished and ready to move on. In lean terminology, it is the time measured by actual observation from the moment work begins on a part or batch until it is finished. This includes all active processing time (and often minor unavoidable pauses) but typically excludes significant downtime such as breaks or major machine stoppages.
In practice, cycle time captures how long a process or machine takes per unit under normal operating conditions. Cycle time can be measured at different levels at a single machine, a workstation, or across an entire production line. What makes it especially valuable is that it reflects reality on the shop floor, not theoretical targets. When cycle times are longer than expected, something in the process is consuming more time than it should, making cycle time one of the clearest diagnostic tools in manufacturing.
Cycle Time Formula
To calculate cycle time, you take a specific time-frame and divide it by the number of parts produced in that time. The standard formula for cycle time is:
Cycle Time = Net Production Time / Number of Units Produced
Net Production Time is the total available production time minus planned downtime such as breaks and scheduled maintenance. The Number of Units Produced is simply the count of good, completed units that came out of the process during that same period.
For example, if a shift runs for 480 minutes and 15 minutes are allocated for breaks, the net production time is 465 minutes. If 155 units were produced during that shift, the cycle time would be 465 divided by 155, which equals exactly 3 minutes per unit.
Average Cycle Time
There is also a variant of this formula that focuses on the average cycle time across multiple observations or stages:
Average Cycle Time = Sum of All Individual Cycle Times / Number of Observations
In multi-stage production environments, the overall cycle time of the line is determined by its slowest stage, which is called the bottleneck. Even if every other workstation operates in 2 minutes, a single station that takes 5 minutes, the effective cycle time for the entire line is 5 minutes.
Example of Cycle Time
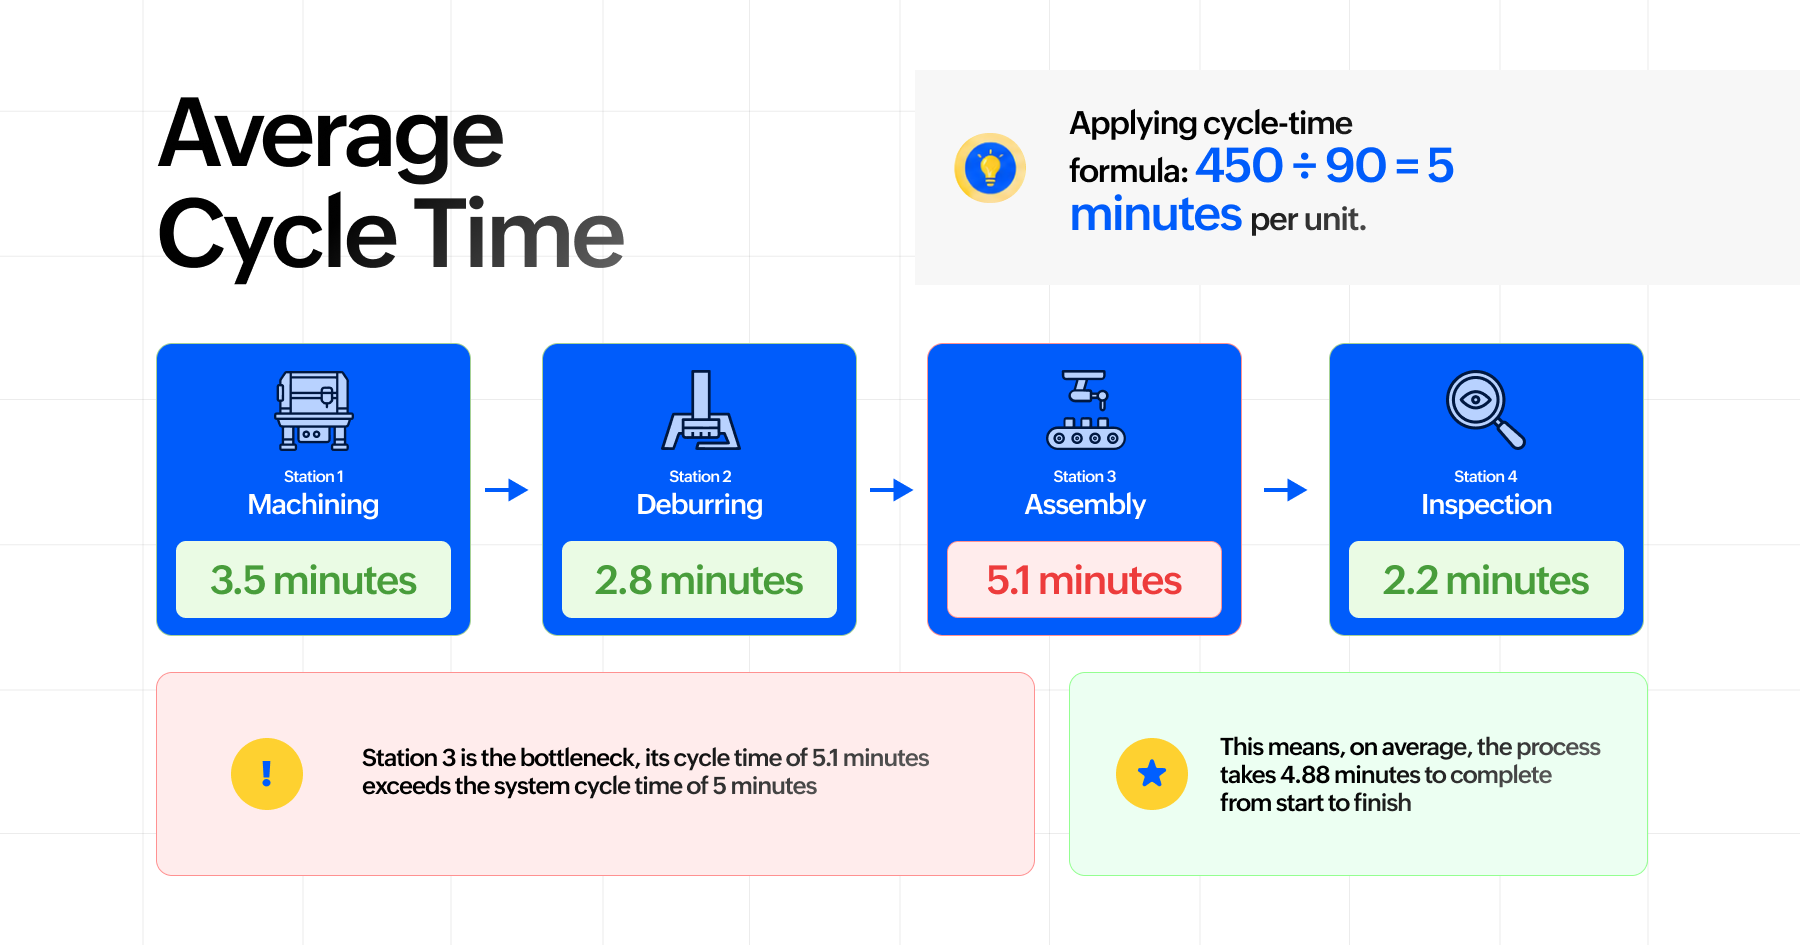
An automotive parts manufacturer produces brake caliper assemblies on a single 8-hour shift. After accounting for 30 minutes of planned breaks, the net production time is 450 minutes. During a typical shift, the line produces 90 completed assemblies.
Applying cycle-time formula: 450 ÷ 90 = 5 minutes per unit.
To dig deeper, The plant manager times each workstation individually.
Station 1 (Machining) takes 3.5 minutes
Station 2 (Deburring) takes 2.8 minutes
Station 3 (Assembly) takes 5.1 minutes
Station 4 (Inspection) takes 2.2 minutes.
Station 3 is the bottleneck, its cycle time of 5.1 minutes exceeds the system cycle time of 5 minutes, causing a small but compounding delay that could cost the line 3 to 4 units of output per shift.
Common Causes of Cycle Time Issues in Manufacturing
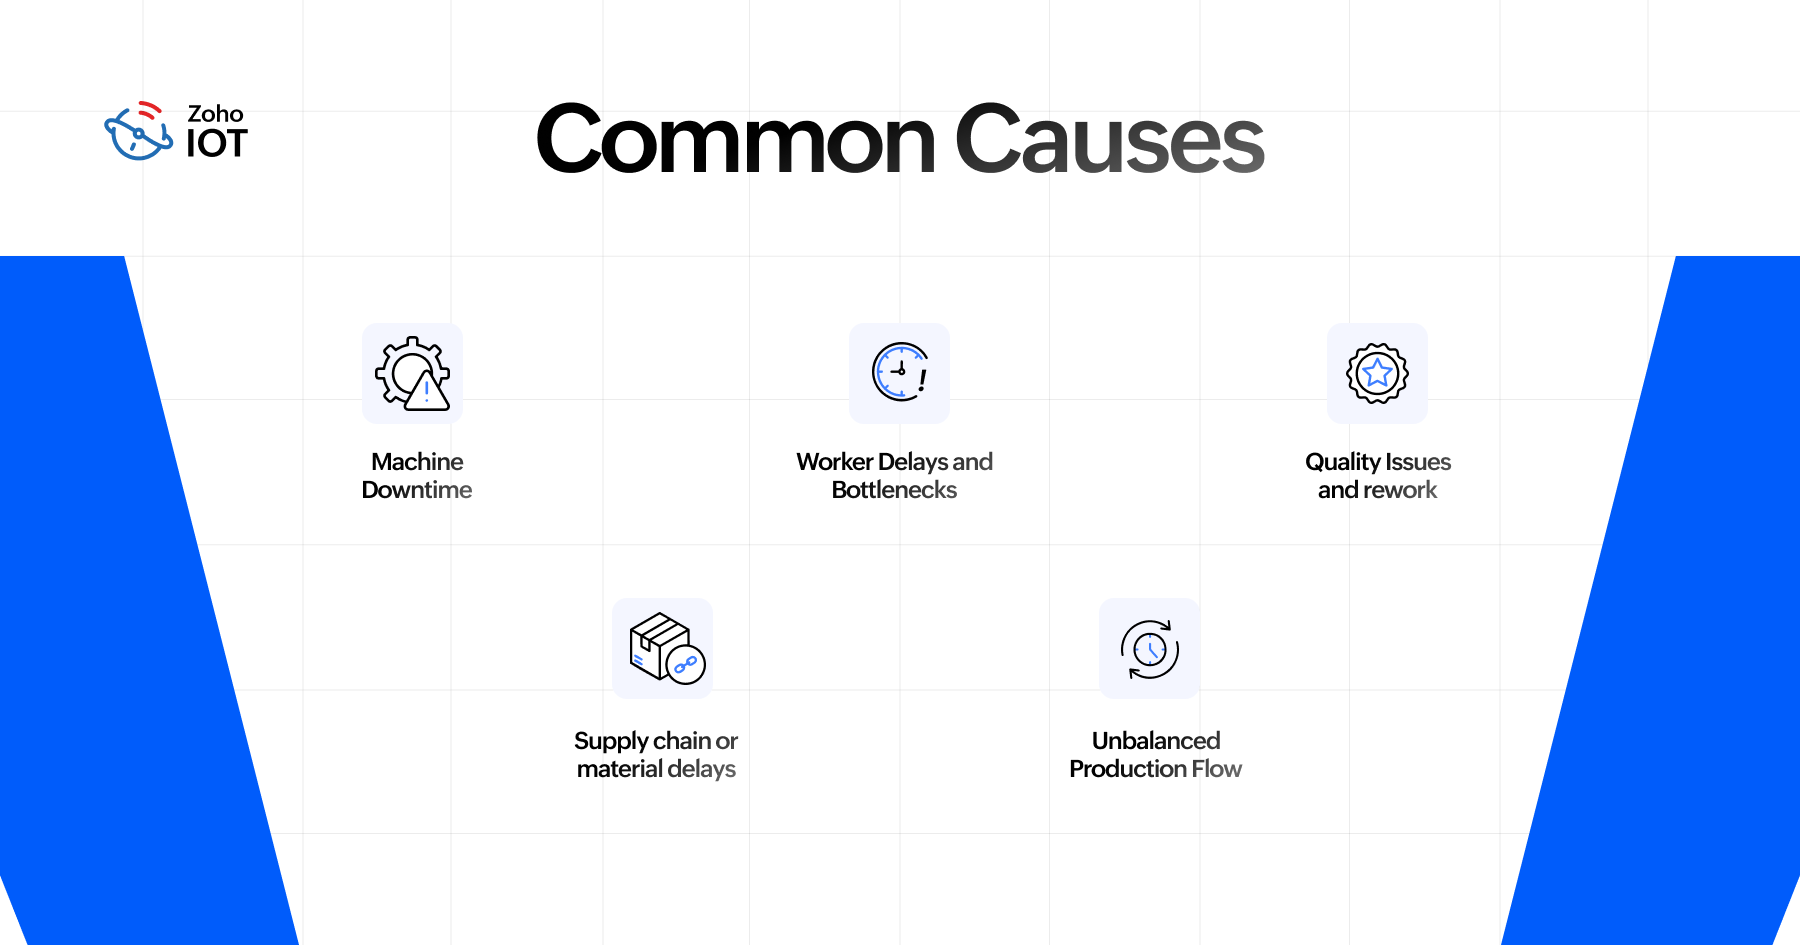
Machine downtime and failures: Equipment breakdowns or unplanned maintenance stops production and increase cycle time. Even small, frequent stoppages slow overall speed.
Worker delays and bottlenecks: Waiting for parts, tools, or instructions or having uneven work allocation creates idle time that extends cycle time. For instance, if some stations wait on others to finish, the process is bottlenecked. Inefficient workflows (poor layout or procedures) cause travel and waiting delays.
Quality issues and rework: If products fail quality checks, rework or scrap is required, effectively multiplying the time per good unit produced. Time spent fixing defects adds to cycle time.
Supply chain or material delays: If raw materials or components arrive late, production must wait. These supply delays can make operators idle or rush work, both affecting cycle time.
Unbalanced production flow: If one step in the sequence is slower than the rest, it becomes the bottleneck and dictates the overall cycle time. Any imbalance where some stations finish early while others lag causes higher average cycle time.
In summary, anything that causes waiting, stoppage, or additional processing beyond the intended work will lengthen cycle time. Lean analysis often finds that idle time, excessive handling, rework, and machine stoppages are root causes of poor cycle-time performance.
How to Improve Cycle Time in Manufacturing
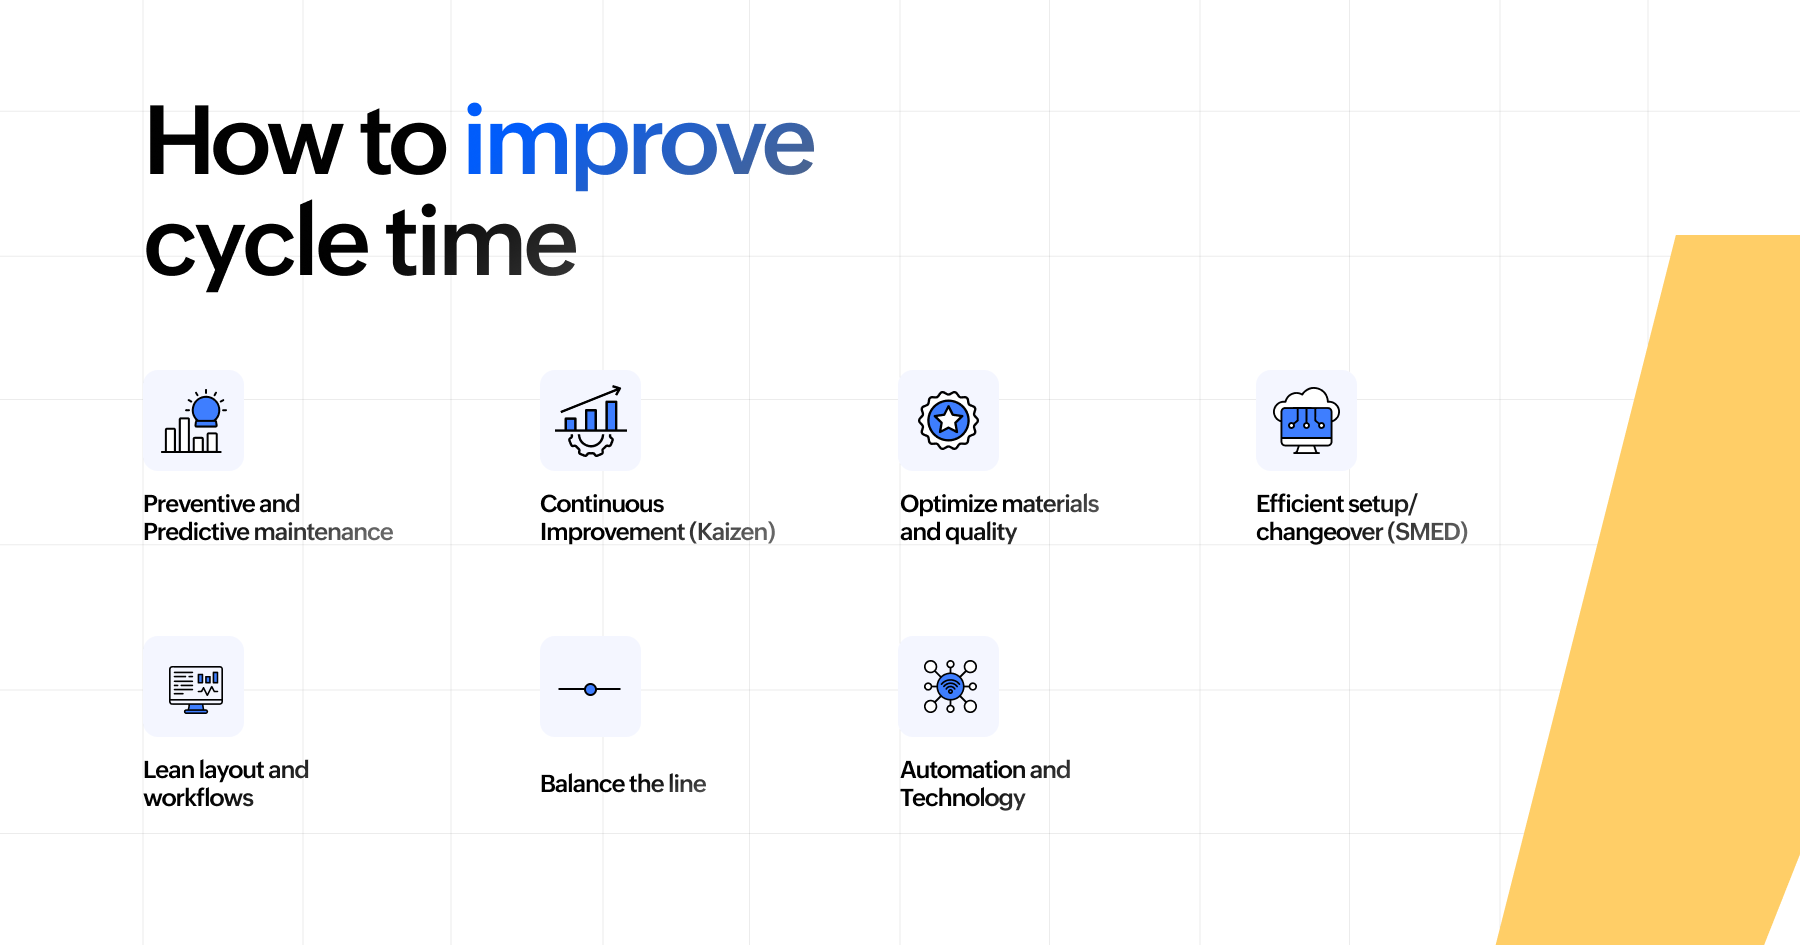
Improving cycle time involves eliminating waste and smoothing flow in the production process. Key improvement approaches include:
Preventive and predictive maintenance: Keeping machines well-maintained and using IoT platform for predictive alerts prevents breakdowns and unplanned stops. Quick response to issues keeps equipment running at its designed cycle time.
Optimize materials and quality: Using higher-quality or faster-processing materials can speed up steps (e.g. quick-drying paint). Likewise, robust quality control (mistake-proofing) reduces rework that adds time. Poka-yoke methods (error-proofing) help prevent defects from causing delays.
Efficient setup/changeover (SMED): Applying Single-Minute Exchange of Dies (SMED) techniques and tooling improvements drastically cut changeover times. For example, specialized tools or pre-set jigs let an operator switch tasks in minutes instead of hours.
Lean layout and workflows: Reorganizing the shop floor (e.g. using a spaghetti diagram to shorten transport paths) and creating value-stream or cellular flow eliminates unnecessary movement and waits. Aligning workstations in the sequence of operations keeps materials moving smoothly.
Balance the line: Ensuring each workstation has an equal workload prevents bottlenecks. If one process is slower, consider adding resources (machines or labor) or combining tasks so no station forces others to wait.
Automation and technology: Automating repetitive tasks (robots, conveyors, or CNC machines) often cycles faster than manual work. Integration of sensors and real-time monitoring (IoT) can detect slowdowns instantaneously, enabling prompt adjustment.
Continuous improvement (Kaizen): Involve workers in finding and fixing inefficiencies. Small daily improvements (5S, Kaizen events) accumulate to significantly reduce cycle time over time.
Importance of Cycle Time
Cycle time is a critical performance metric because it directly impacts productivity, cost, and customer satisfaction. A shorter cycle time generally means a more efficient and faster process. In practice, reducing cycle time allows a factory to increase output and throughput without adding more resources. For example, if you can cut cycle time by 20%, the same equipment can produce 20% more units in a given period. This boosts productivity and utilization.
On the other hand, long cycle times often drive up costs. Extended cycle times tie up labour and machines longer for each unit, and they increase work-in-process inventory (since products take longer to finish). As the Six Sigma analysis notes, “longer cycle times often translate to higher costs” in labour, overhead and inventory carrying. By minimizing cycle time, companies reduce these variable costs and improve profitability.
Finally, tracking cycle time helps identify process problems. Analysis of cycle time variation often reveals bottlenecks or wastes (for instance, unexpectedly long times at a particular step). Using cycle time data, manufacturers can uncover hidden inefficiencies and target improvements. In summary, cycle time matters because it sits at the heart of efficiency, cost control, and competitiveness in production.
Analysing and Optimizing Cycle Time
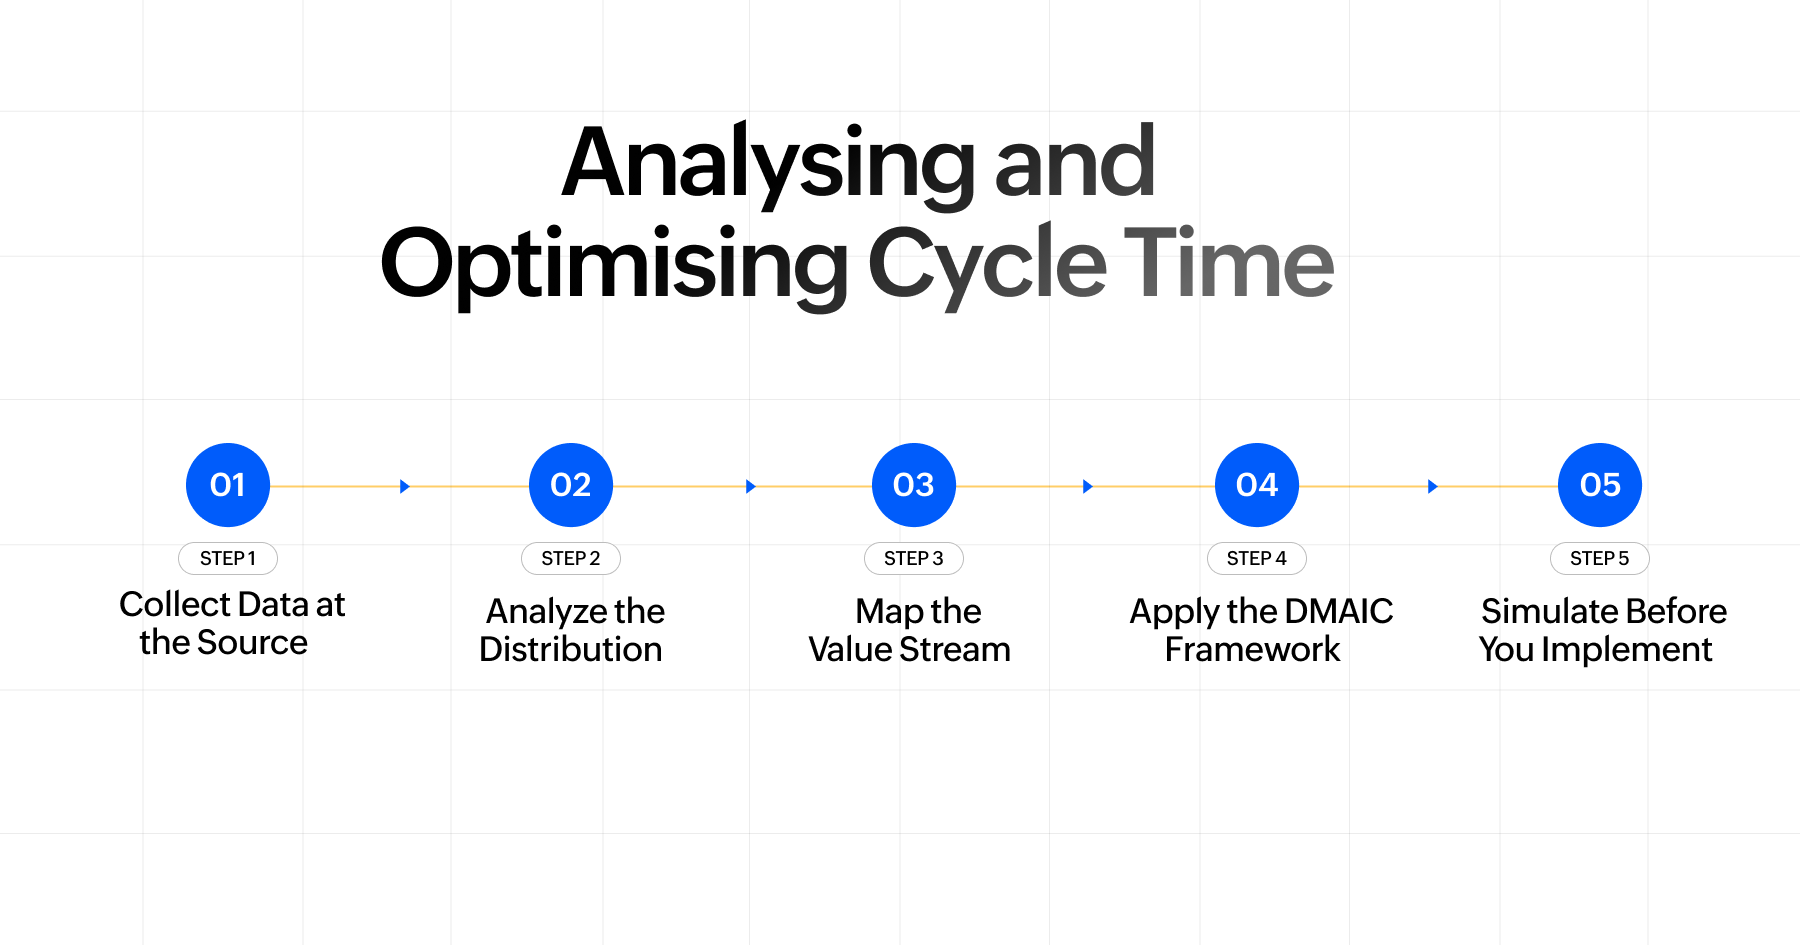
Analyzing and optimizing cycle time is not a one-time exercise, it is a structured, repeatable process. Here is how to approach it step by step.
Step 1: Collect Data at the Source
Start by gathering cycle time data at every workstation, ideally across multiple shifts and operators. Traditionally, this meant trained observers with stopwatches but today, integration with IoT platform at workstation entry and exit points capture timestamps automatically for every unit that passes through, producing continuous, unbiased data without interrupting production. Connecting machines via OPC-UA or MTConnect protocols feeds cycle time data directly into a IoT Platform, giving analysts a complete, real-time dataset to work from rather than a limited manual sample.
Step 2: Analyze the Distribution, Not Just the Average
Once data is collected, plot it. A histogram of cycle time observations reveals whether variation is random (a roughly normal distribution) or driven by a specific pattern, a skewed distribution suggests a recurring delay, while a multi-modal shape may indicate different operators or product types behaving differently. Control charts add a time dimension, helping distinguish between common cause variation that is inherent to the process and special cause variation triggered by identifiable external events like a machine fault or a material change.
Step 3: Map the Value Stream
Value stream mapping (VSM) places cycle time in its full operational context. Rather than viewing each workstation in isolation, VSM maps the entire flow of materials and information through the facility, making visible how much time units spend waiting between process steps. In many plants, actual processing time is a fraction of total floor time VSM surfaces that hidden waste and helps teams prioritize where intervention will have the greatest impact.
Step 4: Apply the DMAIC Framework
With data and mapping complete, the DMAIC framework (Define, Measure, Analyze, Improve, Control) from Six Sigma provides a structured path to improvement. The Improve phase is where root-cause-driven changes are implemented, whether that is rebalancing workloads, redesigning a process step, or addressing a recurring equipment issue. The Control phase is equally important: it locks in the gains through updated standard work, revised control limits, and defined response protocols so that improvements do not erode over time.
Step 5: Simulate Before You Implement
Before committing to physical changes, adding a workstation, restructuring a production cell, or investing in new equipment, discrete event simulation in IoT platform allows engineers to model the proposed changes digitally. By feeding these simulations with real IoT-derived cycle time data, manufacturers can predict how changes will affect throughput, WIP levels, and bottleneck behaviour with far greater confidence, reducing the risk of costly trial-and-error on the live floor.
What is Takt Time?
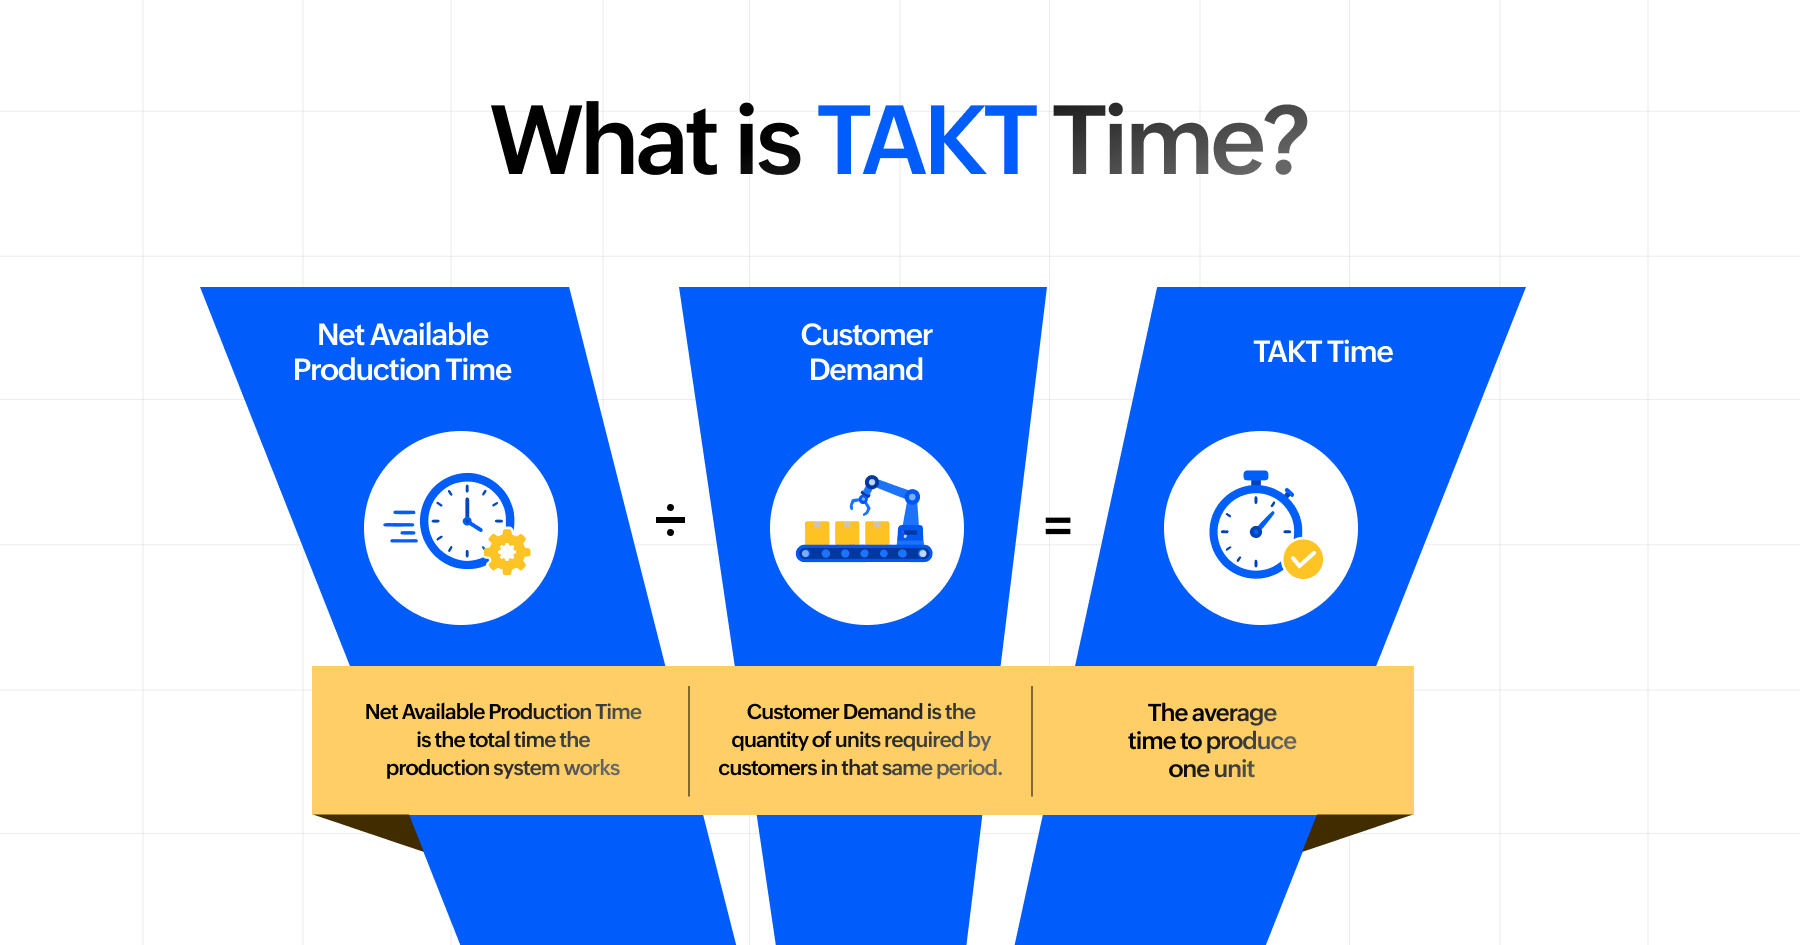
While cycle time describes how fast a process currently runs, takt time describes how fast a process needs to run to meet customer demand. The word "takt" comes from the German word for beat or pulse, and it is an apt metaphor: takt time is the rhythm of production set by the marketplace.
Takt time is not measured on the shop floor. It is a calculated target derived from customer demand and available production time. It serves as the benchmark against which all process cycle times are compared. If a workstation's cycle time exceeds takt time, that station cannot keep pace with demand. If it is significantly below takt time, resources may be over-allocated there. Aligning cycle time with takt time is a central goal of lean manufacturing.
Takt Time Formula
The formula for calculating takt time is:
Takt Time = Net Available Production Time / Customer Demand
Net Available Production Time is the total time the production system is scheduled to work, minus planned downtime. Customer Demand is the quantity of units required by customers in that same period.
Example of Takt Time
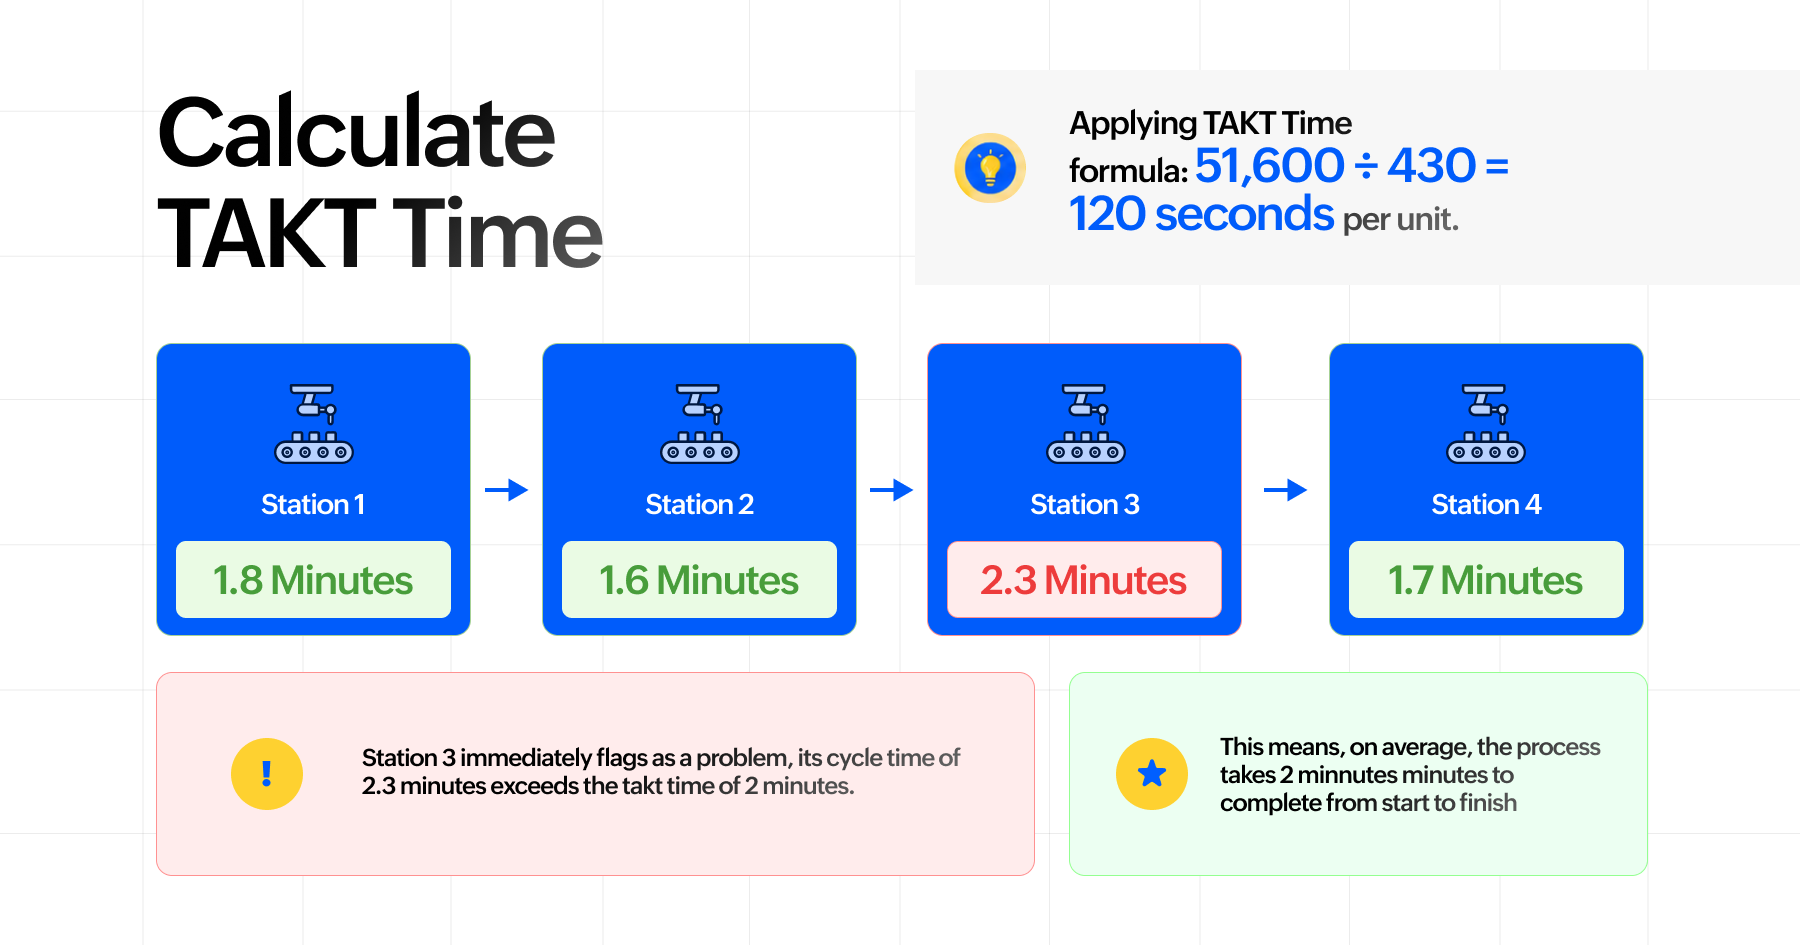
A consumer electronics manufacturer assembles wireless headphones across two 8-hour shifts per day. Each shift includes 40 minutes of planned breaks and a 10-minute startup, giving a net production time of 430 minutes per shift, or 860 minutes (51,600 seconds) per day.
The company must deliver 430 units daily.
Applying the formula: 51,600 ÷ 430 = 120 seconds (2 minutes) per unit.
Evaluating the four assembly stations:
Station 1 runs at 1.8 minutes
Station 2 at 1.6 minutes
Station 3 at 2.3 minutes
Station 4 at 1.7 minutes.
Station 3 immediately flags as a problem, its cycle time of 2.3 minutes exceeds the takt time of 2 minutes. Left uncorrected, this station will fall progressively behind demand over each shift.
What is Lead Time?
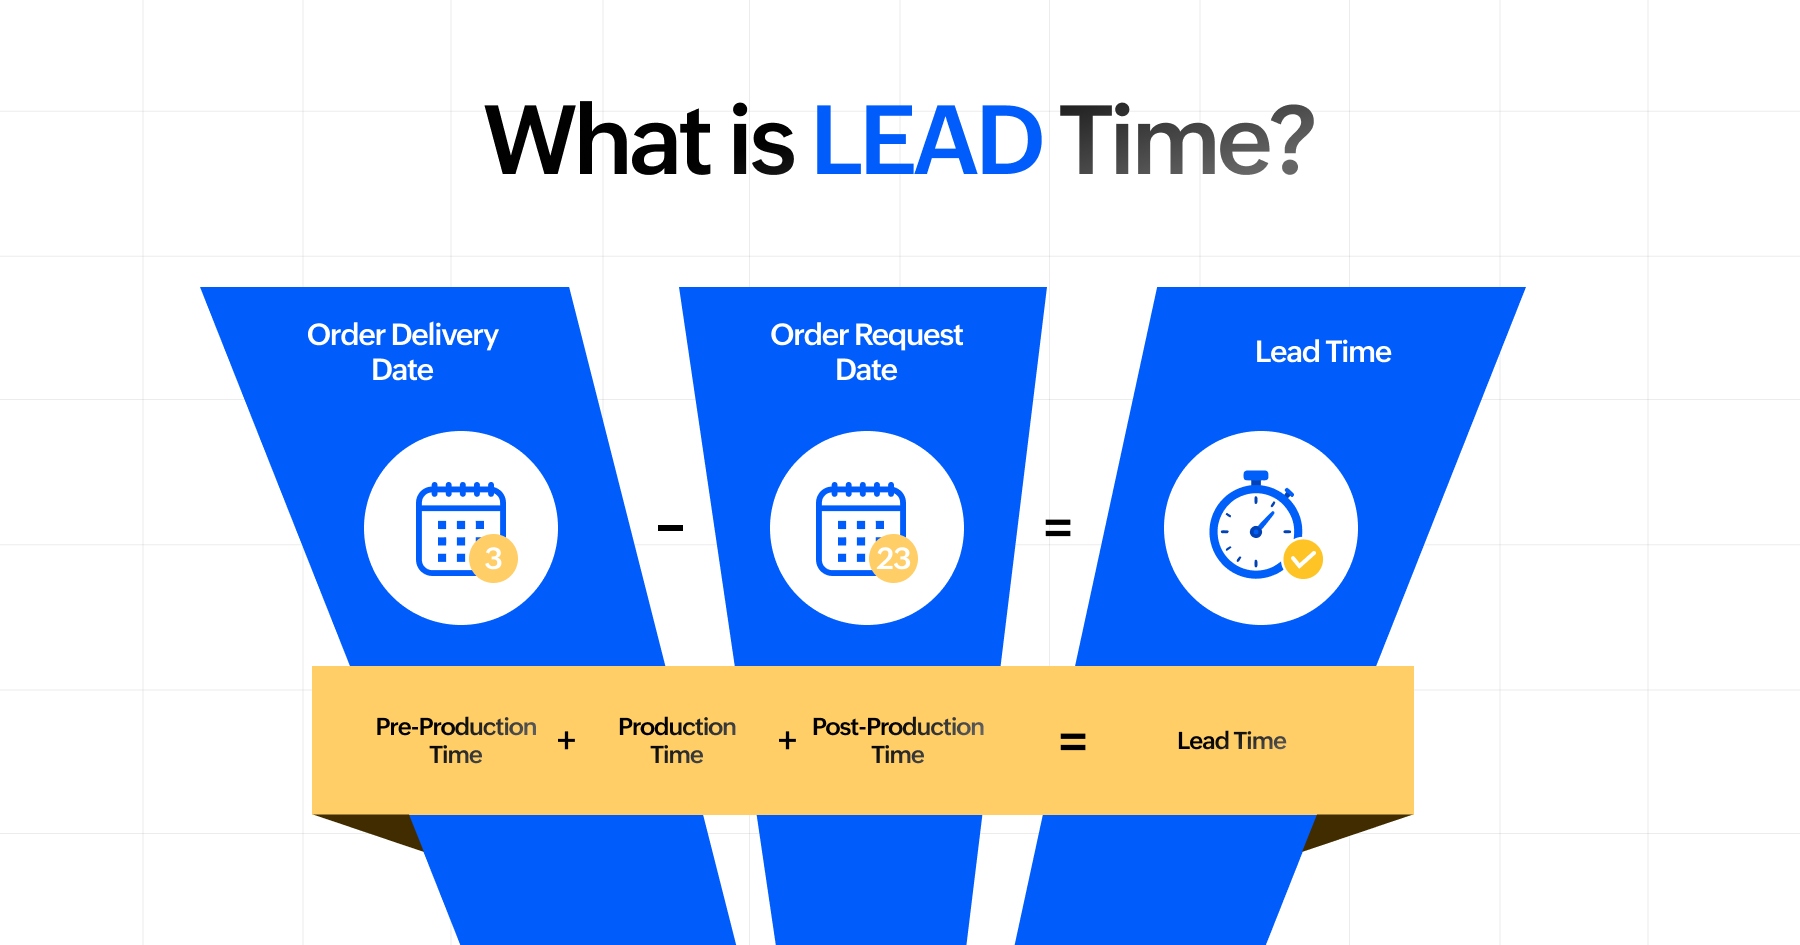
Lead time is the total elapsed time from the moment a customer places an order to the moment that customer receives their product. Unlike cycle time, which is bounded by the production process itself, lead time encompasses every step in the entire fulfillment chain order processing, raw material procurement, production, quality inspection, packaging, shipping, and final delivery.
Lead time is the metric that customers feel most directly. When a customer asks "when will my order arrive?", the answer is determined by lead time. It reflects the cumulative effect of delays, handoffs, transportation times, and waiting periods at every stage of the supply chain.
From an operational standpoint, lead time serves as a comprehensive system health indicator. It captures not just the speed of production but the efficiency of the entire value chain, including supplier performance, inventory management practices, transportation logistics, and order management processes.
Lead Time Formula
There are a couple of ways to express lead time, depending on level of detail. A simple formula is:
Lead Time (order lead time) = (Order Delivery Date) – (Order Request Date).
This gives the overall calendar time between when the order was made and when it was fulfilled. In more detailed terms, lead time can be broken into phases. A common formula for manufacturing lead time is:
Lead Time = Pre-Production Time + Production Time + Post-Production Time
Here, pre-production might include order handling and setup; production is actual manufacturing time (similar to cycle time); and post-production includes packing and delivery.
For inventory management, lead time can also include supplier lead time plus internal processing (sometimes summed as supply delay plus production lead time). Essentially, you sum all relevant durations from the start of an order to its completion. Note that lead time typically includes waits and delays, whereas cycle time usually excludes major waiting.
Example of Lead Time
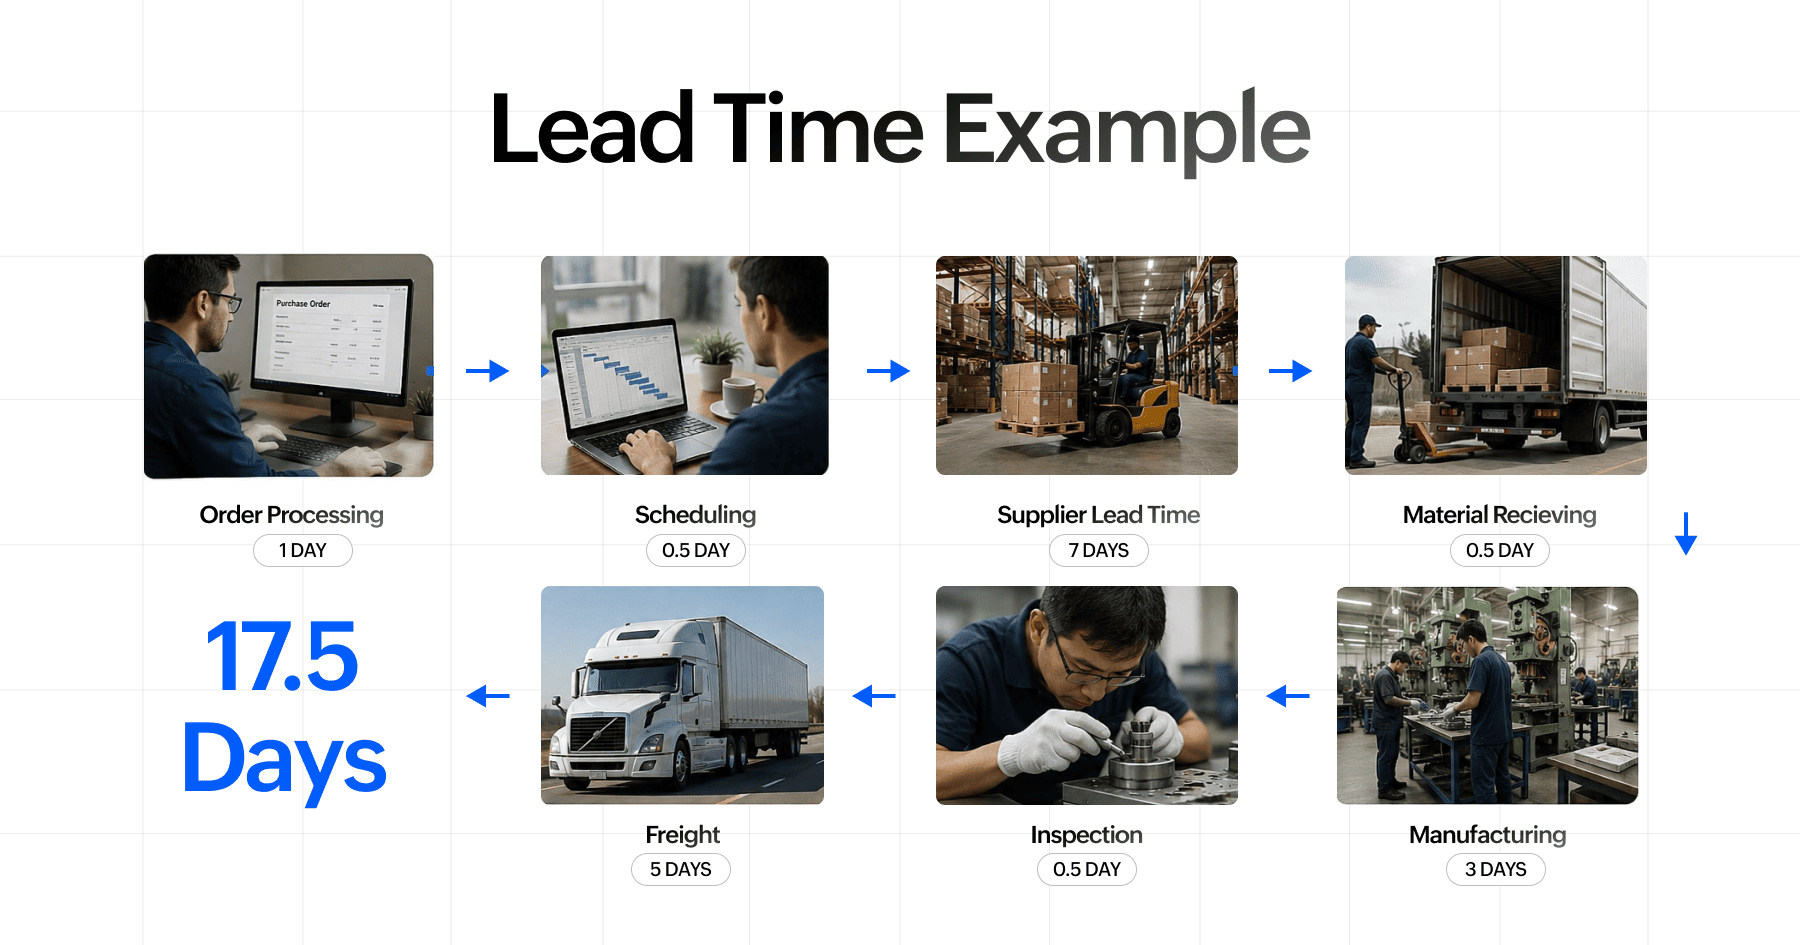
Consider a custom furniture manufacturer that produces made-to-order sofas. When a customer places an order through the company's website, the order is processed by the customer service team, which takes approximately 1 day. The manufacturing team then generates a production order, which takes another half day to enter the production schedule. The required upholstery fabric is sourced from a supplier with a 7-day delivery lead time. Once fabric arrives, it is inspected and logged into inventory, which takes 0.5 days.
Production of the sofa cutting, sewing, padding, and assembling the frame takes 3 days of active manufacturing time. After production, the sofa undergoes a quality inspection lasting 0.5 days. It is then moved to the warehouse staging area, wrapped for shipment, and handed off to the logistics carrier. Freight transit to the customer takes 5 days.
Adding these up: 1 day (order processing) + 0.5 days (scheduling) + 7 days (supplier lead time) + 0.5 days (material receiving) + 3 days (manufacturing) + 0.5 days (inspection) + 5 days (freight) = 17.5 days total lead time.
The actual production cycle time 3 days represents only about 17 percent of the total lead time. The remaining 83 percent is consumed by waiting, administrative processes, supplier delays, and transportation
Comparison Between Cycle Time, Lead Time, and Takt Time
Cycle time, lead time, and takt time each measure a different dimension of manufacturing performance. Understanding how they differ and how they interact is essential for making the right operational decisions.
| Cycle Time | Takt Time | Lead Time | |
| Definition | Time to complete one unit of production | Time allowed per unit to meet customer demand | Total time from customer order to delivery |
| Nature | Descriptive, measures actual performance | Prescriptive, sets the required production pace | Experiential, reflects what the customer feels |
| How it is derived | Measured from shop floor data | Calculated from customer demand and available time | Measured across the entire fulfillment chain |
| Scope | Machine, workstation, or production line | Entire production line | End-to-end supply chain |
| Controlled by | Manufacturing team | Market demand | Operations, supply chain, and logistics |
| Formula | Net Production Time ÷ Units Produced | Net Available Time ÷ Customer Demand | Pre-production + Production + Post-production time |
| Primary use | Identifying bottlenecks and inefficiencies | Line balancing and capacity planning | Measuring customer responsiveness |
| Ideal state | At or below takt time | Matched to actual cycle time | As short and predictable as possible |
In summary, takt time is a production target based on demand; cycle time is a measure of actual performance; lead time is the overall responsiveness of the system.
Measuring Cycle Time, Lead Time, and Takt Time Using IoT
Modern IoT platforms serve as the operational intelligence layer between the shop floor and decision-makers. For cycle time and takt time, these platforms ingest machine and process data continuously, compute metrics in real time, and surface live dashboards that show whether each workstation is running on pace, ahead, or behind without waiting for end-of-shift reports. Built-in analytics automatically detect bottlenecks, flag abnormal deviations, and recalculate takt time instantly when demand inputs change, ensuring the production floor is always working to the right target.
For lead time, IoT platforms integrate data across the entire fulfillment chain connecting ERP, MES, supplier portals, and logistics systems into a single unified view. Planners can see exactly where every order stands, how long it has spent at each stage, and whether it is on track for on-time delivery. Platforms with predictive analytics and digital twin capabilities go further, allowing manufacturers to simulate the impact of process changes before implementing them and forecast how demand shifts will ripple through all three metrics turning cycle time, takt time, and lead time from historical reports into live operational intelligence.
Zoho IoT is built to help manufacturers do exactly this. With its smart manufacturing capabilities, Zoho IoT enables real-time monitoring of production processes, automated cycle time tracking, and end-to-end visibility across the shop floor all from a single connected platform. Whether you are looking to reduce cycle time, align production with takt time, or gain tighter control over lead times, Zoho's Industrial IoT gives you the data and tools to act with confidence. If you are ready to take the next step toward smarter manufacturing, book a demo with our team today.