- HOME
- Industrial IoT
- What is OEE in Manufacturing?
What is OEE in Manufacturing?
- Last Updated : April 17, 2026
- 405 Views
- 10 Min Read
The origin of OEE
The term Overall Equipment Effectiveness was coined by Seiichi Nakajima in 1960s, he is famously known as the father of Total Productive Maintenance (TPM). OEE was the core component of the TPM methodology which evaluates the efficiency of the machine in the manufacturing process.
The term gained popularity after the release of Siichi Nakajima book TPM Tenkai in 1982, and the popularity spread to the west after the release of the book's English adoption Introduction to TPM in 1988. What started as a structured maintenance philosophy in Japan slowly transformed into a universal language of manufacturing performance.
OEE was never meant to be just another metric. It was designed as a mirror, a way for factories to see the gap between what they are capable of producing and what they are actually producing.
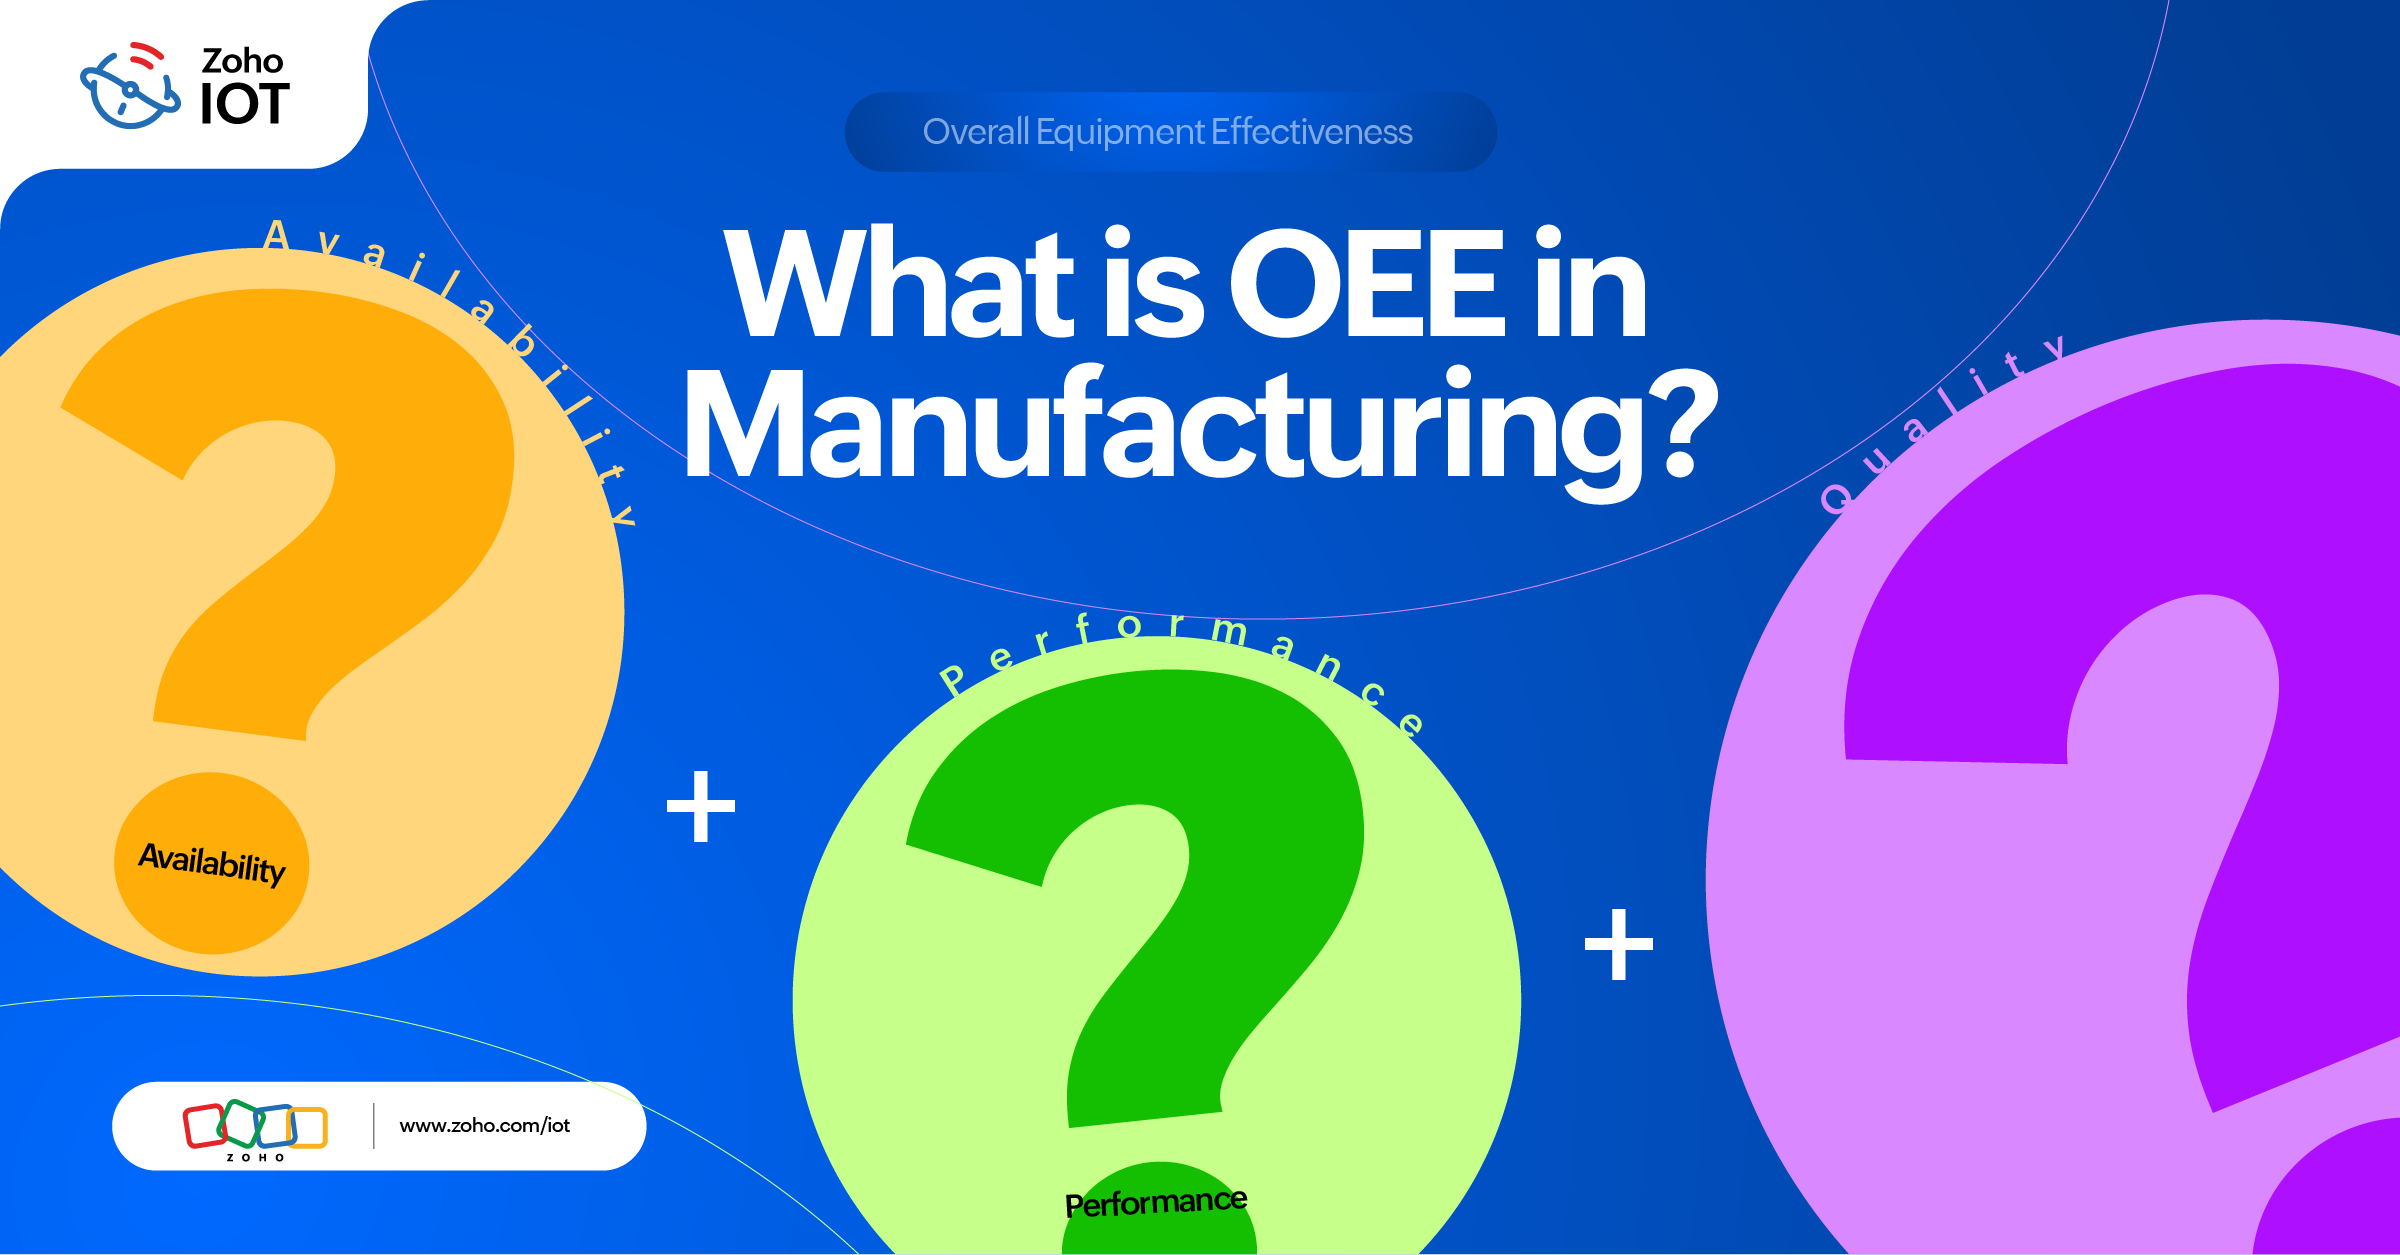
What is OEE?
OEE (Overall Equipment Effectiveness) is a frequently used term on the manufacturing shop floor, this term is key in determining the efficiency and productivity of a individual machine, production line, production unit, or a shop floor.
Today as manufacturers are keen on improving the quality and increasing the efficiency of the shop floor, most manufacturing units aim to improve their OEE score. A factory with good OEE score is considered as a highly efficient and productive factory. On the other hand a factory with low OEE score means it has underutilized resources, hidden losses, and improvement opportunities.
Let's deep dive to know more about OEE, Factors affecting productivity, benefits, IoT in OEE, and impact of improving OEE.
How OEE became the key factor in manufacturing
OEE uncovers the true potential of a manufacturing unit. It quantifies individual machine performance, production line efficiency, and overall shop floor productivity. It identifies what was produced with the available resources compared to what could have been produced under ideal conditions.
This gives us a sneak peek into bottlenecks and the actual problems happening on the shop floor from procurement of materials, planning inefficiencies, machine downtime, operator handling, to packaging delays.
Unlike traditional production metrics that only measure output, OEE highlights losses. It shifts the focus from “How much did we produce?” to “Why didn’t we produce more?”
OEE metrics and data can be used for continuous improvement of the factory. It helps by minimizing the six major losses present in factories. These losses directly impact Availability, Performance, and Quality.
Measuring six big losses in manufacturing using OEE
The manufactures main goal is to minimize or eliminate the six big losses in the production process. These six losses are categorized in the three major categories: availability, performance, and quality. Improving these three categories would in-turn improve the OEE of the factory.
Availability
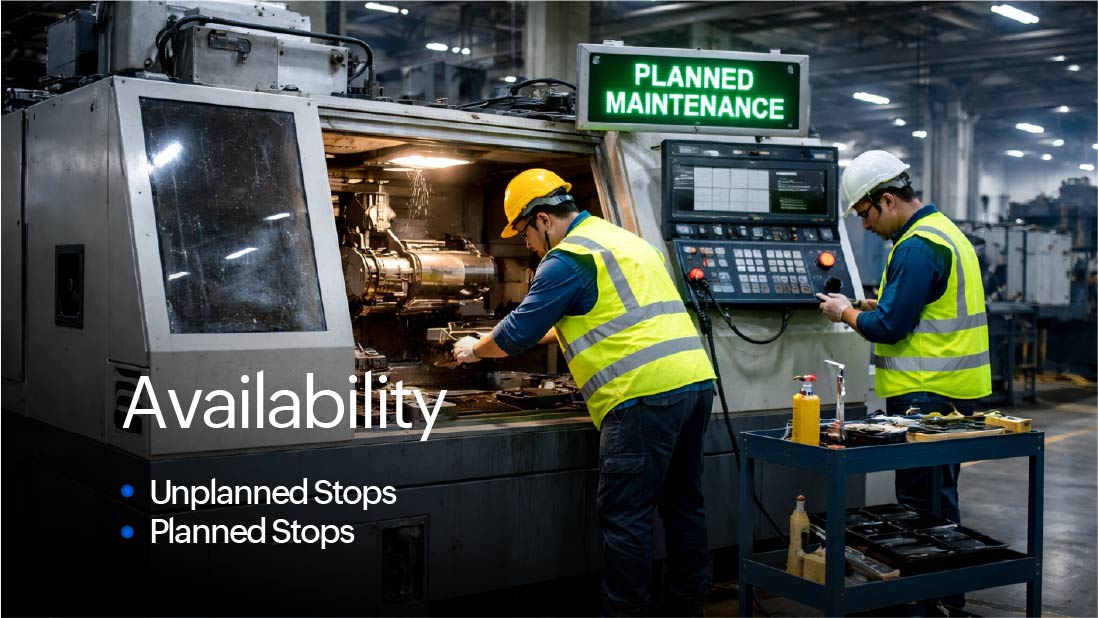
Availability is the ratio of total run time and total planned production time. It measures how much of the scheduled time the machine was actually running. There are two losses that are part of this category unplanned stops and planned stops.
Unplanned stops: One of the major contributors for the unplanned maintenance is the equipment failure. It is usually interpreted as downtime. Some of the common reasons for equipment failure are unplanned maintenance, sudden breakdowns, tooling breakage, and coolant temperature.
Planned stops: Here during the production time the equipment is stopped due to some planned maintenance or similar events. Here Some common reasons for planned stops are equipment setup for the job, major adjustments, tool change, planned maintenance, cleaning, equipment warm-up time, and quality adjustments.
Even a few minutes of downtime repeated multiple times a day can drastically impact the overall OEE score.
Performance
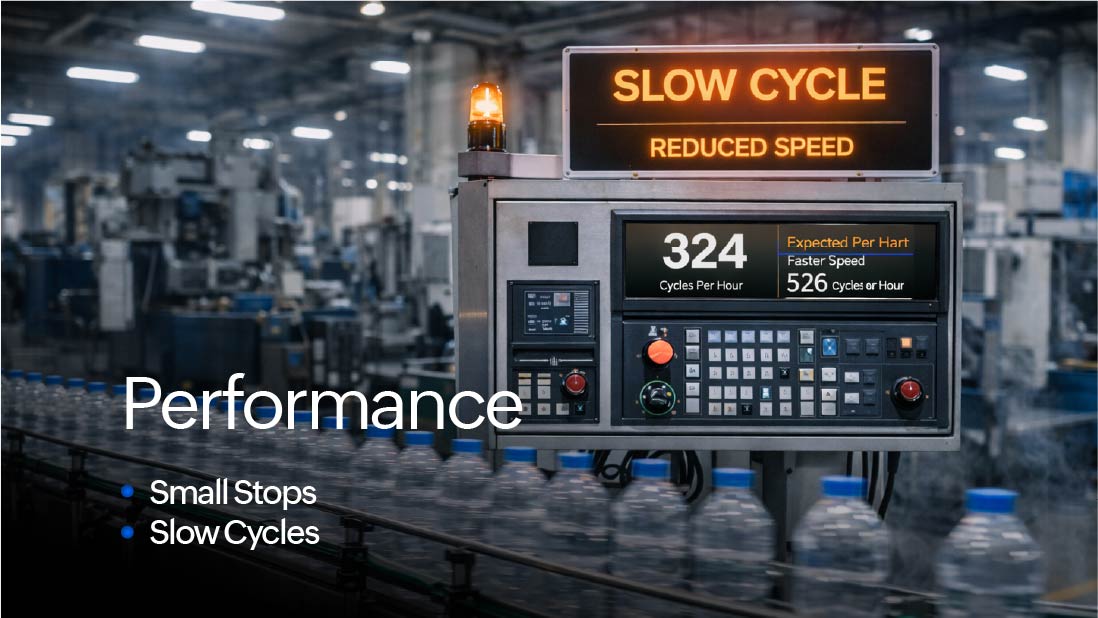
Performance measures whether the machine is running at its designed speed. It compares actual output against the maximum possible output at ideal cycle time. This component does not focus only on units produced but evaluates whether the equipment is operating at its optimal capacity.
Small Stops: Small stops can also be referred to as Idling or minor stops. Here the machine is stopped for a very short time, mostly for a minute or two. These stops are usually resolved by operators and may not require maintenance personnel. A few common reasons for this idling are misalignment, quick cleaning, equipment design issues, material jam, Incorrect settings, and miss-feeds.
Slow Cycles: This happens when the machines run slower than the actual speed. As the name suggested the time taken for each production cycle is less than the theoretically fastest possible time. Another name for slow cycles is reduced speed. Reasons for this scenario can be worn our equipment, poor environment condition, poor lubrication, inexperienced operator, and substandard material. Over time, reduced speed silently erodes productivity.
Performance losses are often the hardest to detect without proper monitoring systems, as machines may appear to be running but not efficiently.
Quality
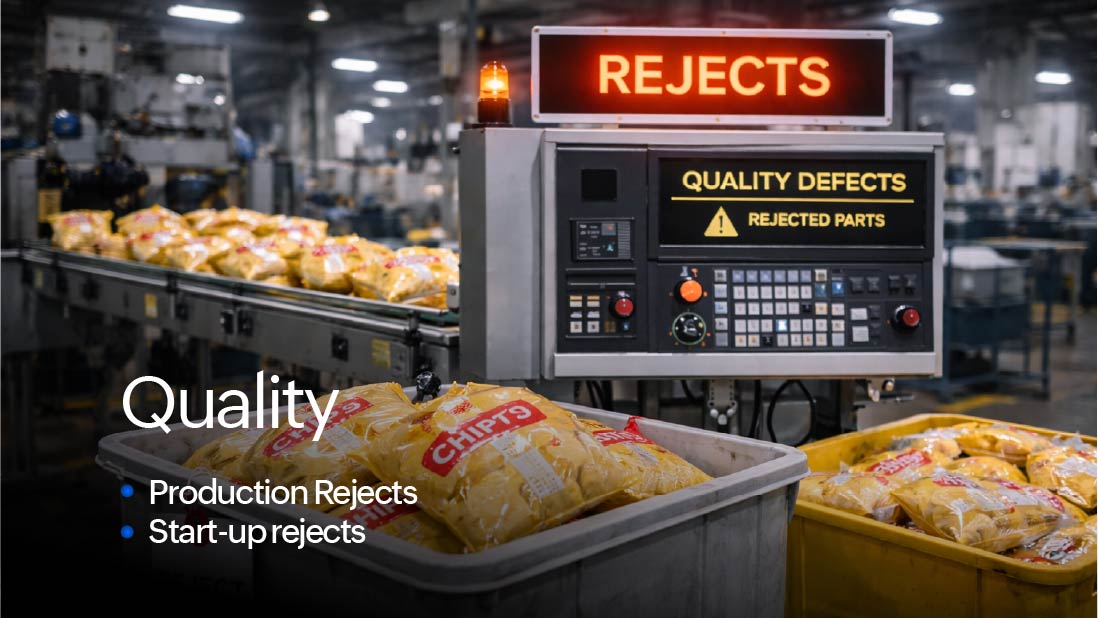
The final component of OEE is Quality. While Availability and Performance focus on time and speed, Quality focuses on output integrity. It measures how many units produced meet customer specifications without requiring rework.
Production rejects: These account for defects that are produced during the stable production as quality in OEE is measures as "Right First Time". These rejects include both the scrapped parts and well as the parts that can be reworked. A few common examples are overweight bags, chemical conformity, label problems, and incorrect equipment settings.
Start-up rejects: These are the defective parts produced from startup to stable or steady state production. These are also known as reduced yield. Start-up rejects occurs after any machine startup. However, these defects are identified mostly after the changeover. Some common reasons are sub-optimal changeovers, machine warm-up cycle, and incorrect machines.
How to implement OEE
Implementing OEE is not just about deploying a formula, it is about building a performance culture. A successful OEE initiative requires structured planning, disciplined data capture, and cross-functional involvement.
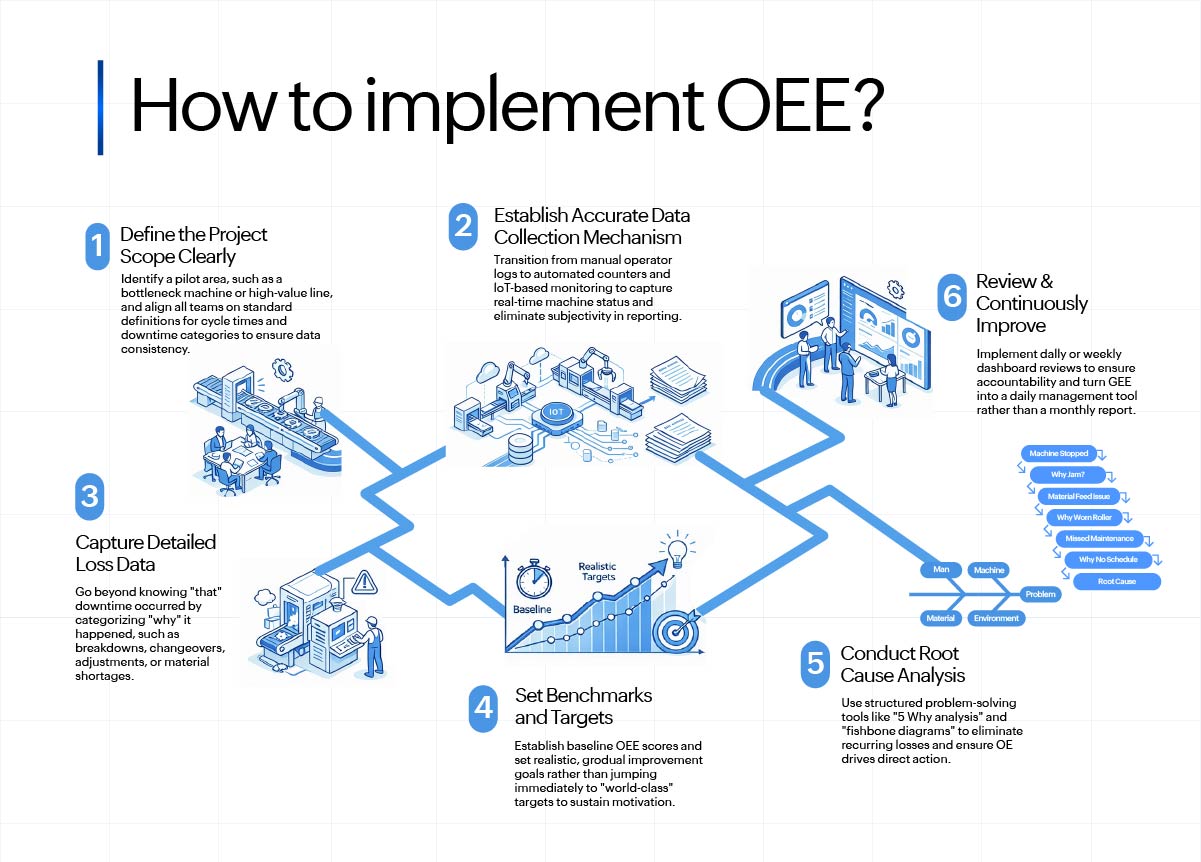
1. Define the Project Scope Clearly
Start by identifying the pilot area, whether it is a bottleneck machine, a high-value production line, or an entire plant. Define ideal cycle times, planned production time, and clear downtime categories. Align production, maintenance, and quality teams on definitions to avoid confusion. Without standard definitions, OEE numbers become inconsistent and unreliable.
2. Establish Accurate Data Collection Mechanisms
Traditionally, operators manually recorded downtime and production counts. While simple, this method often leads to under-reporting or inaccurate categorization. Modern implementation uses automated counters, PLC integrations, and IoT-based monitoring systems to capture real-time machine status, runtime, downtime, and quality data. Automated systems eliminate subjectivity and provide reliable data for analysis.
3. Capture Detailed Loss Data
Knowing that downtime occurred is not enough. Manufacturers must know why it occurred. Downtime should be categorized into breakdowns, changeovers, adjustments, material shortages, operator absence, and other relevant classifications. Granular loss data allows targeted improvement strategies instead of general assumptions.
4. Set Benchmarks and Targets
Establish baseline OEE scores and set realistic improvement goals. Avoid setting unrealistic “world-class” targets immediately. Gradual improvement sustains motivation and cultural adoption.
5. Conduct Root Cause Analysis
Use structured problem-solving methods such as "5 Why analysis" and "fishbone diagrams" to eliminate recurring losses. OEE should drive action, not just reporting.
6. Review and Continuously Improve
OEE dashboards must be reviewed daily or weekly. Regular review meetings ensure accountability and encourage continuous improvement. When implemented correctly, OEE becomes a daily management tool rather than a monthly report.
World Class OEE
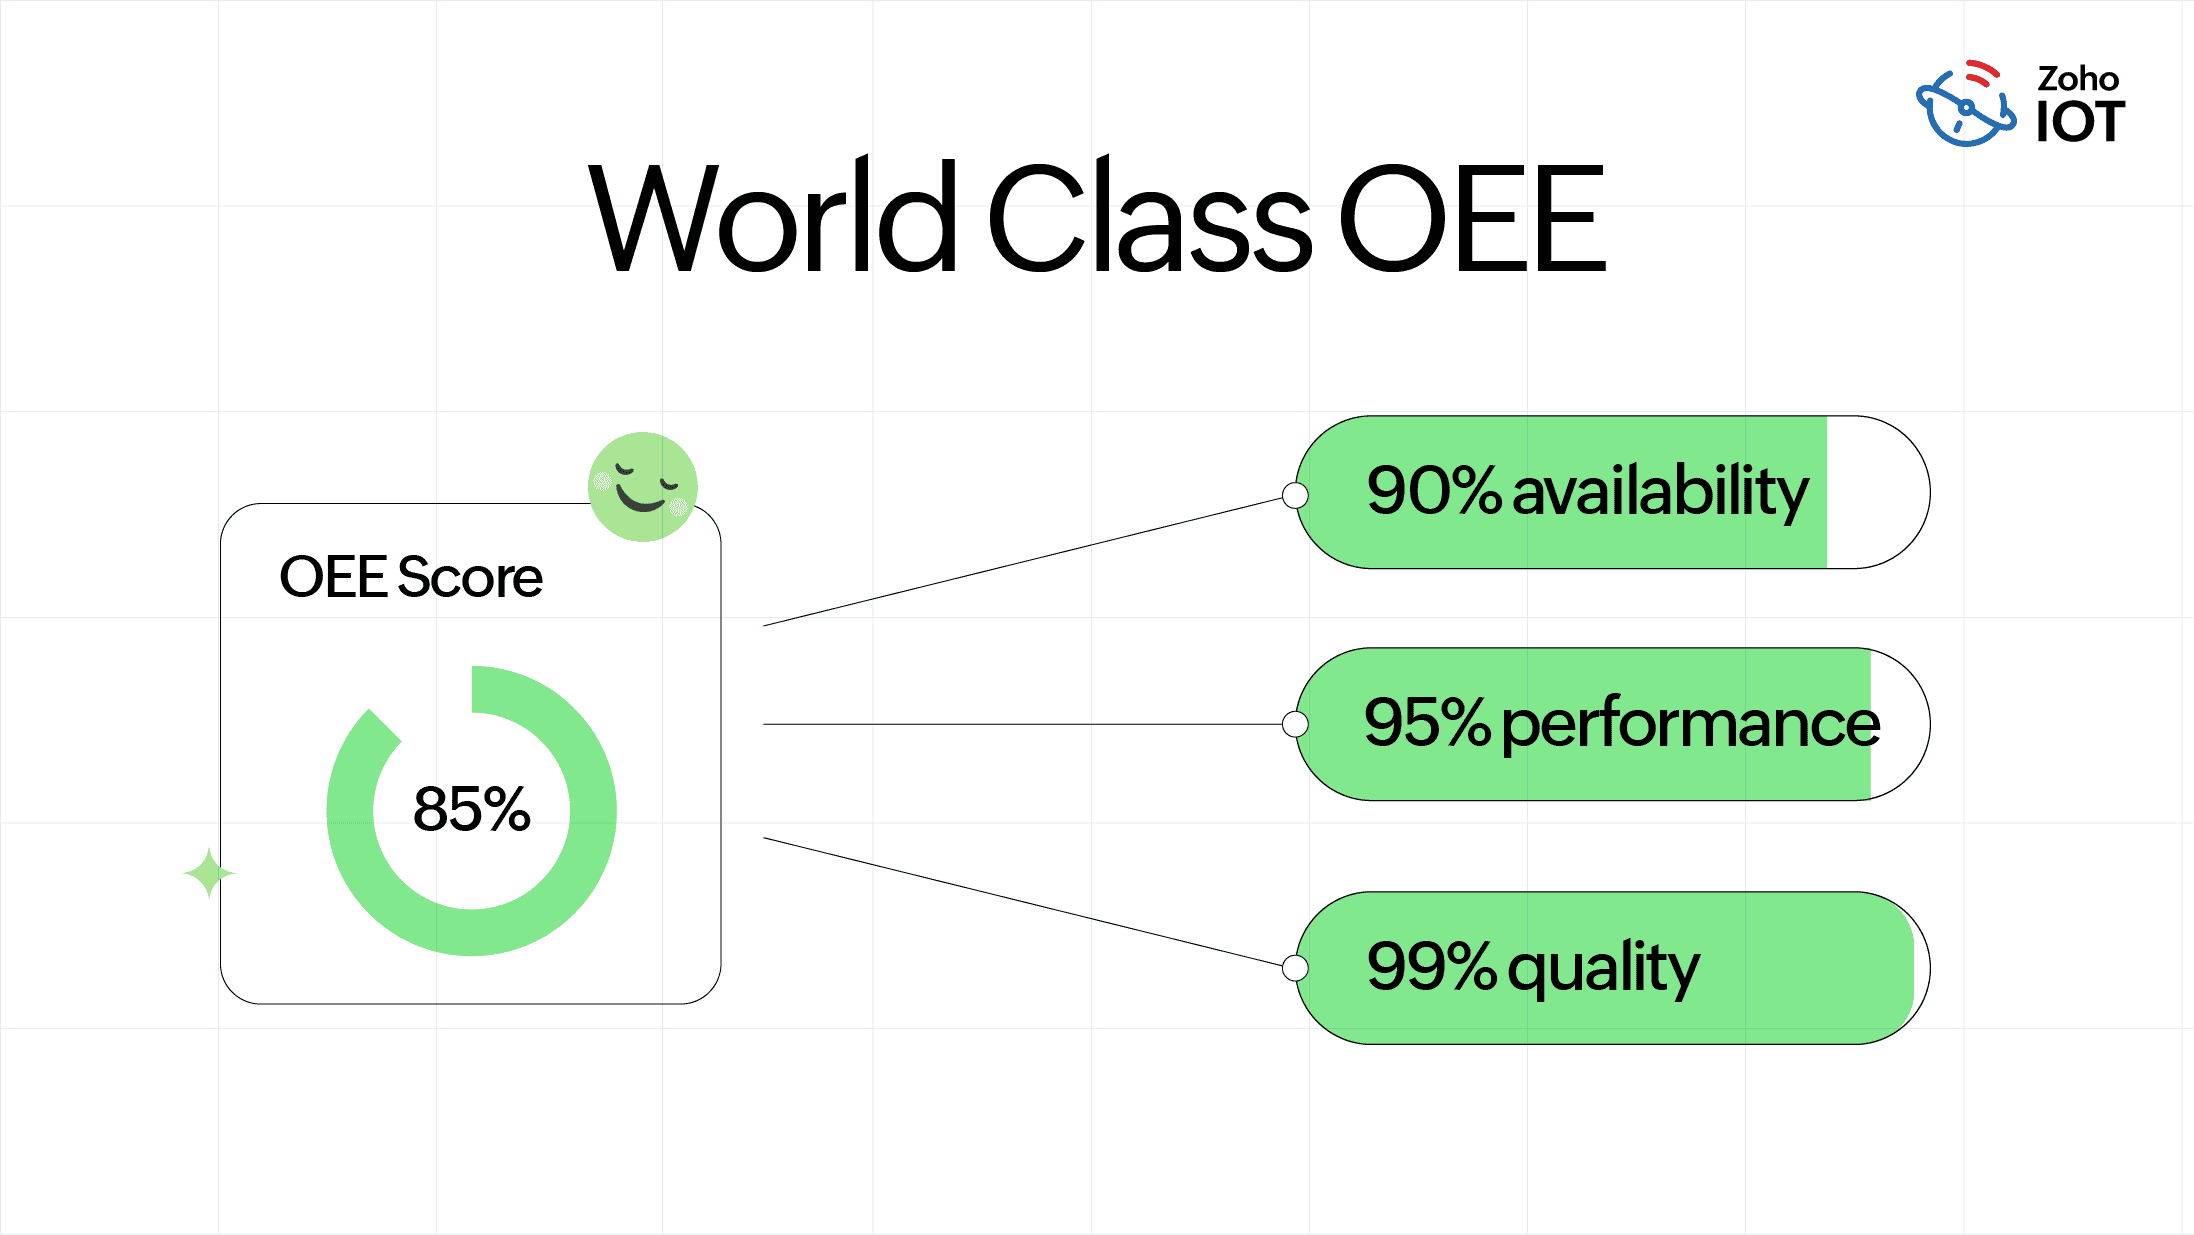
In manufacturing, an OEE score of 100% represents perfect production, no downtime, maximum speed, and zero defects. However, this is practically impossible in real-world scenarios.
An OEE score of 85% is often considered world-class performance. This typically reflects 90% availability, 95% performance, and 99% quality.
Most factories operate between 50% to 70% OEE, which indicates significant improvement potential. The gap between current OEE and world-class OEE represents hidden factory capacity.
Improving OEE by even 5% can result in massive gains in throughput without investing in new machinery.
How to improve OEE
Improving OEE is not about chasing a number, it is about systematically eliminating losses that reduce Availability, Performance, and Quality. Several proven methodologies help manufacturers achieve sustainable OEE improvement. Among the most impactful are Lean Manufacturing, Six Sigma, Theory of Constraints, and IoT-driven optimization.
Lean Manufacturing
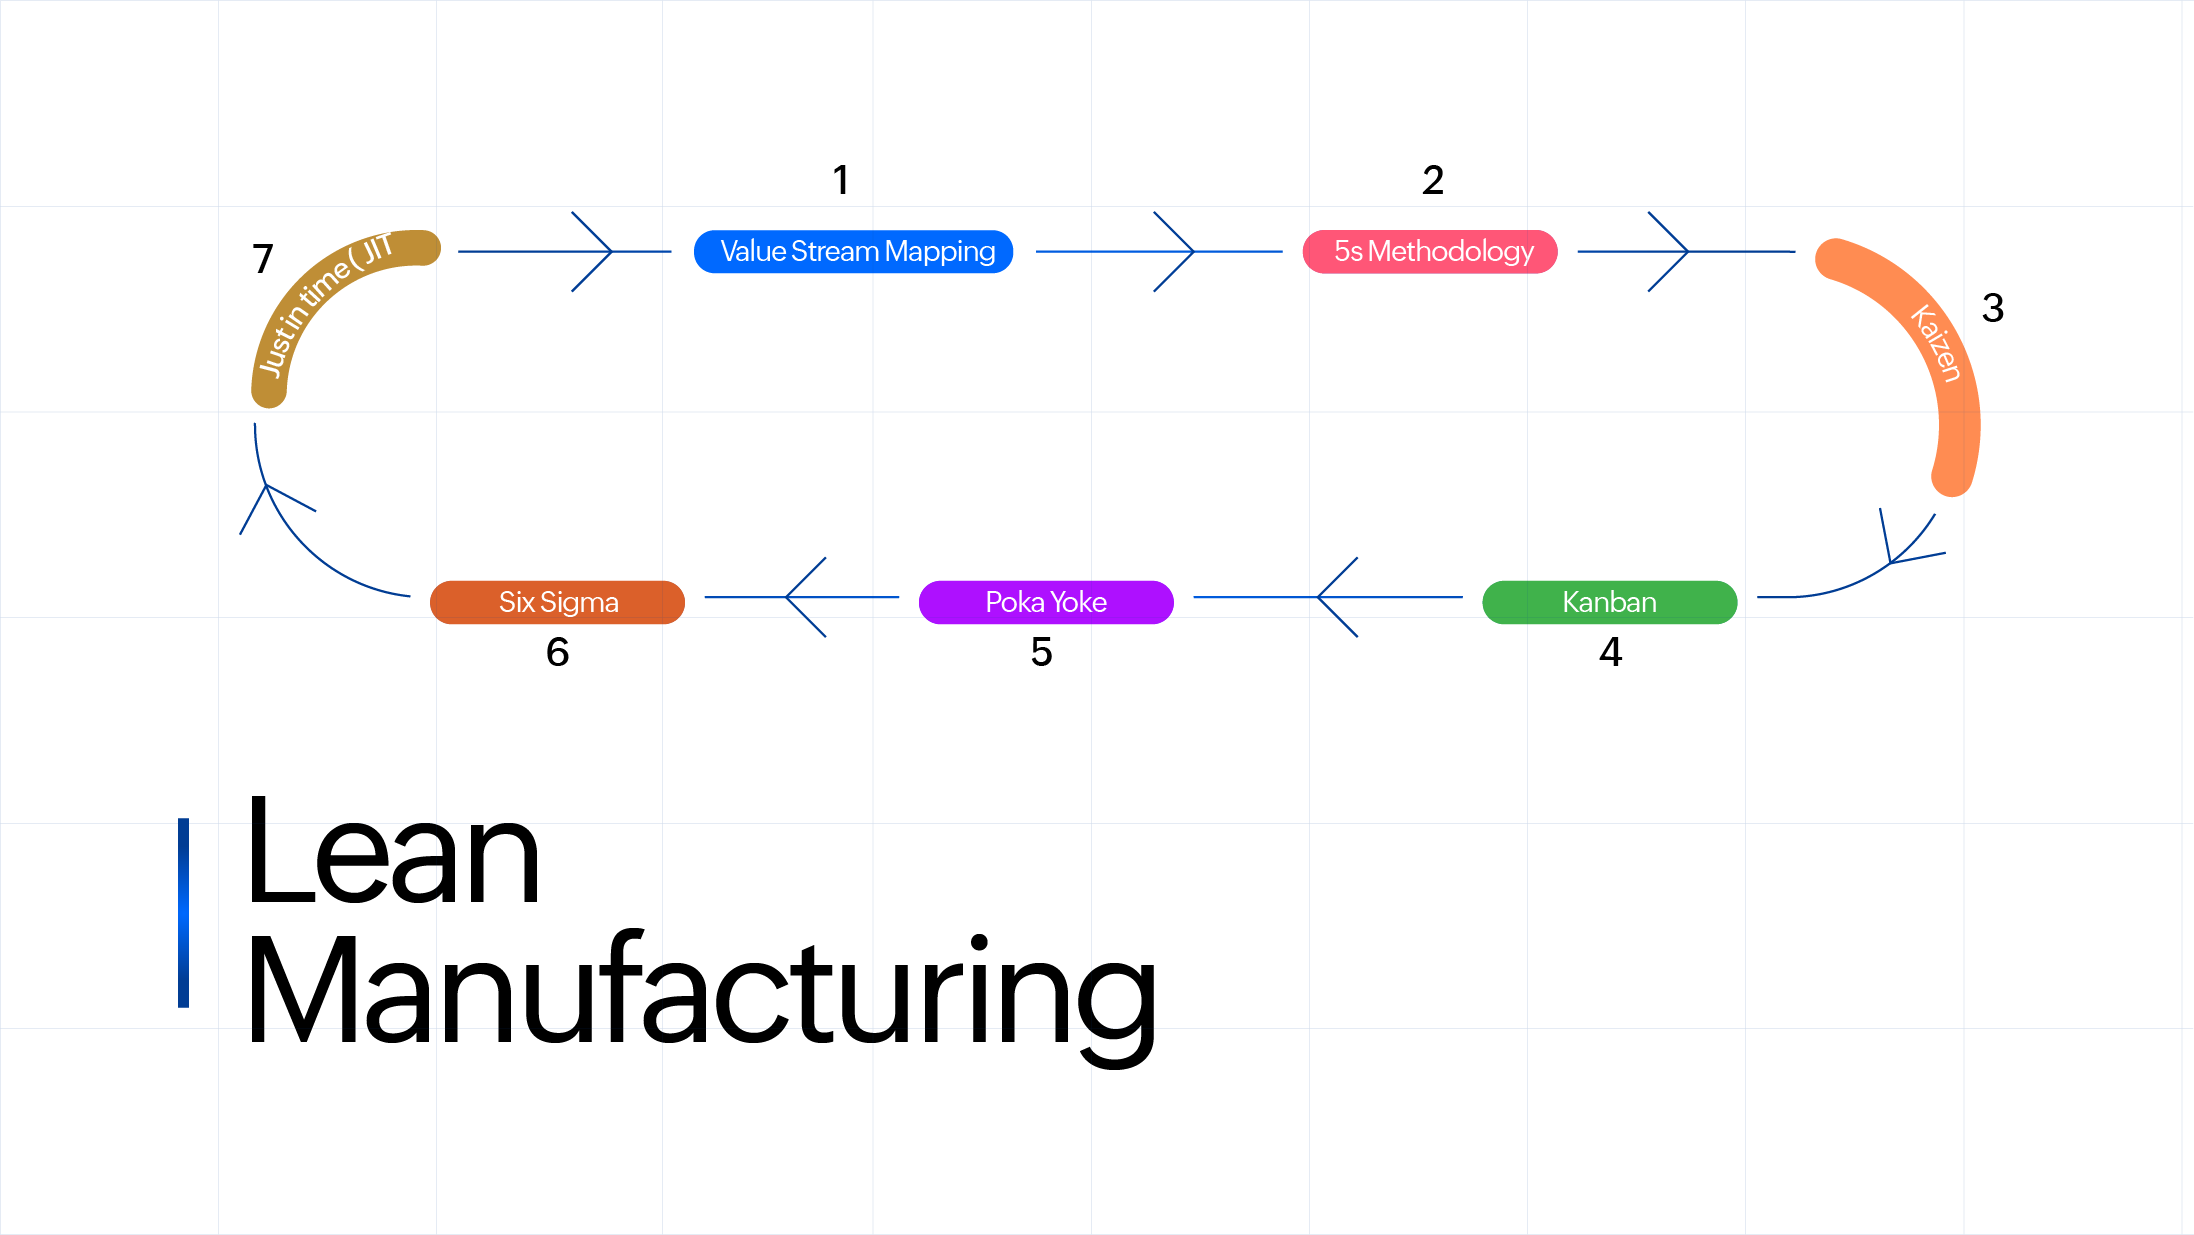
Lean Manufacturing focuses on eliminating waste from processes. Waste, in manufacturing terms, refers to any activity that consumes resources but does not add value to the customer.
Lean identifies seven major wastes: overproduction, waiting time, transportation, excess inventory, unnecessary motion, over-processing, and defects. All these wastes directly or indirectly impact OEE.
Impact on Availability: Lean reduces waiting time between processes, optimizes changeovers using SMED (Single-Minute Exchange of Dies), and streamlines maintenance planning. Faster setups and fewer interruptions increase runtime.
Impact on Performance: By improving layout design, line balancing, and standardized work procedures, Lean reduces minor stops and speed losses. A balanced line ensures machines operate closer to their ideal cycle time.
Impact on Quality: Lean promotes mistake-proofing (poka-yoke), visual management, and standardized processes. These reduce variability and defects, improving the Quality component of OEE.
Six Sigma
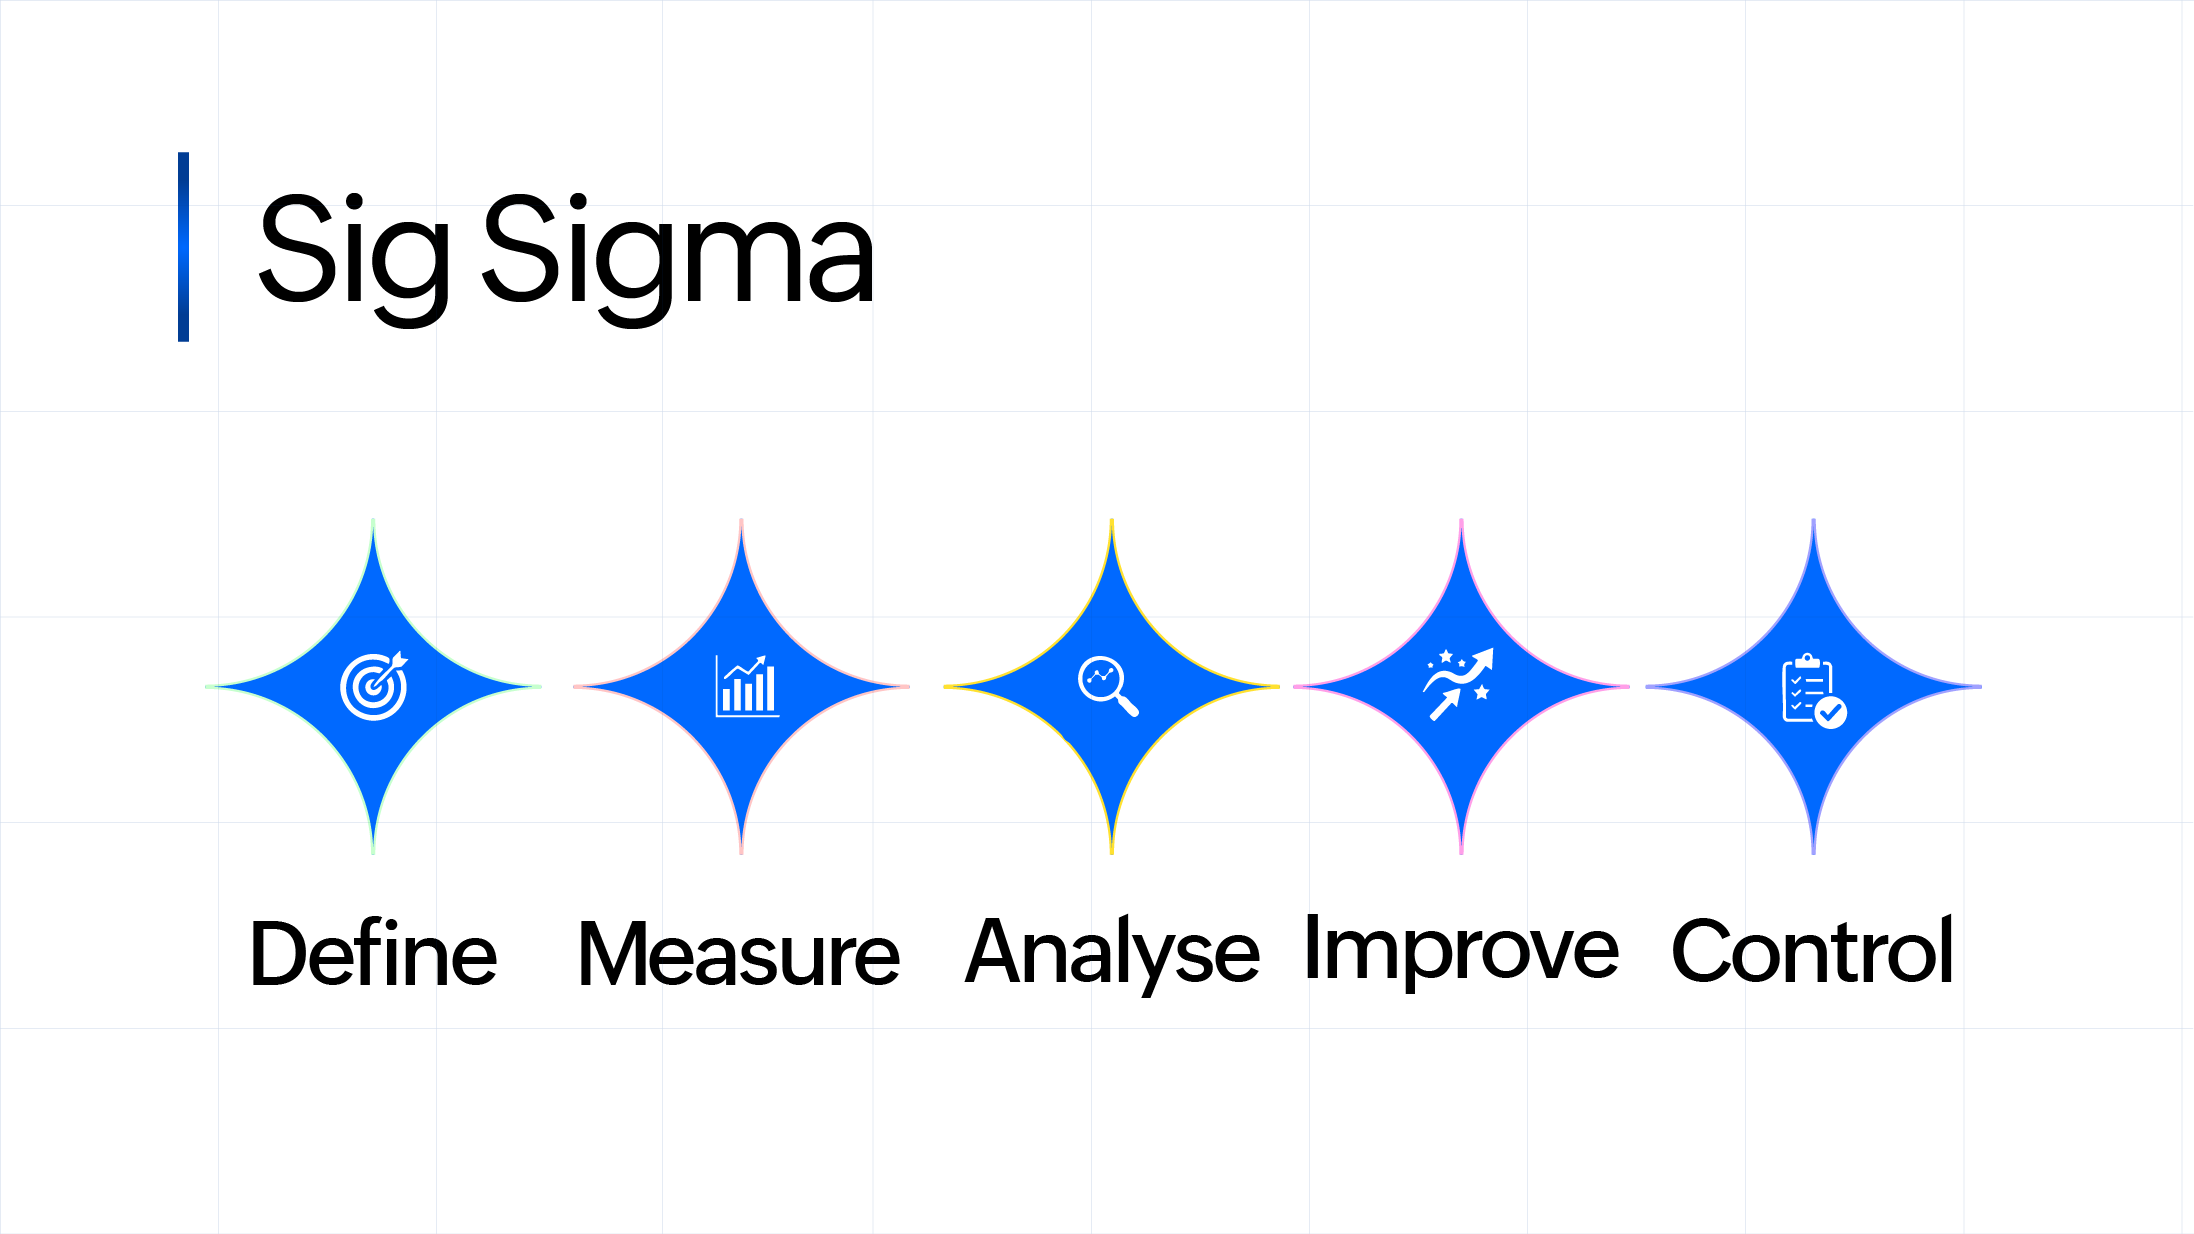
Six Sigma is a data-driven methodology focused on reducing process variation and improving quality consistency. It uses statistical analysis and structured problem-solving techniques such as DMAIC (Define, Measure, Analyze, Improve, Control).
In many factories, machines are running, but outputs vary. That variation leads to defects, rework, scrap, and customer complaints all of which reduce OEE.
Impact on Availability: Six Sigma identifies recurring failure patterns and process instability that cause breakdowns or interruptions. By stabilizing critical parameters, downtime caused by unpredictable variation is reduced.
Impact on Performance: Statistical analysis helps identify why machines run slower than designed speeds. It detects hidden inefficiencies such as suboptimal parameter settings or environmental influences.
Impact on Quality: By minimizing variation, defect rates reduce significantly. Improved first-pass yield directly boosts the Quality component of OEE.
Six Sigma ensures that processes are not just running but running consistently within control limits. Stable processes mean fewer surprises, fewer defects, and higher OEE.
Theory of Constraints (TOC)
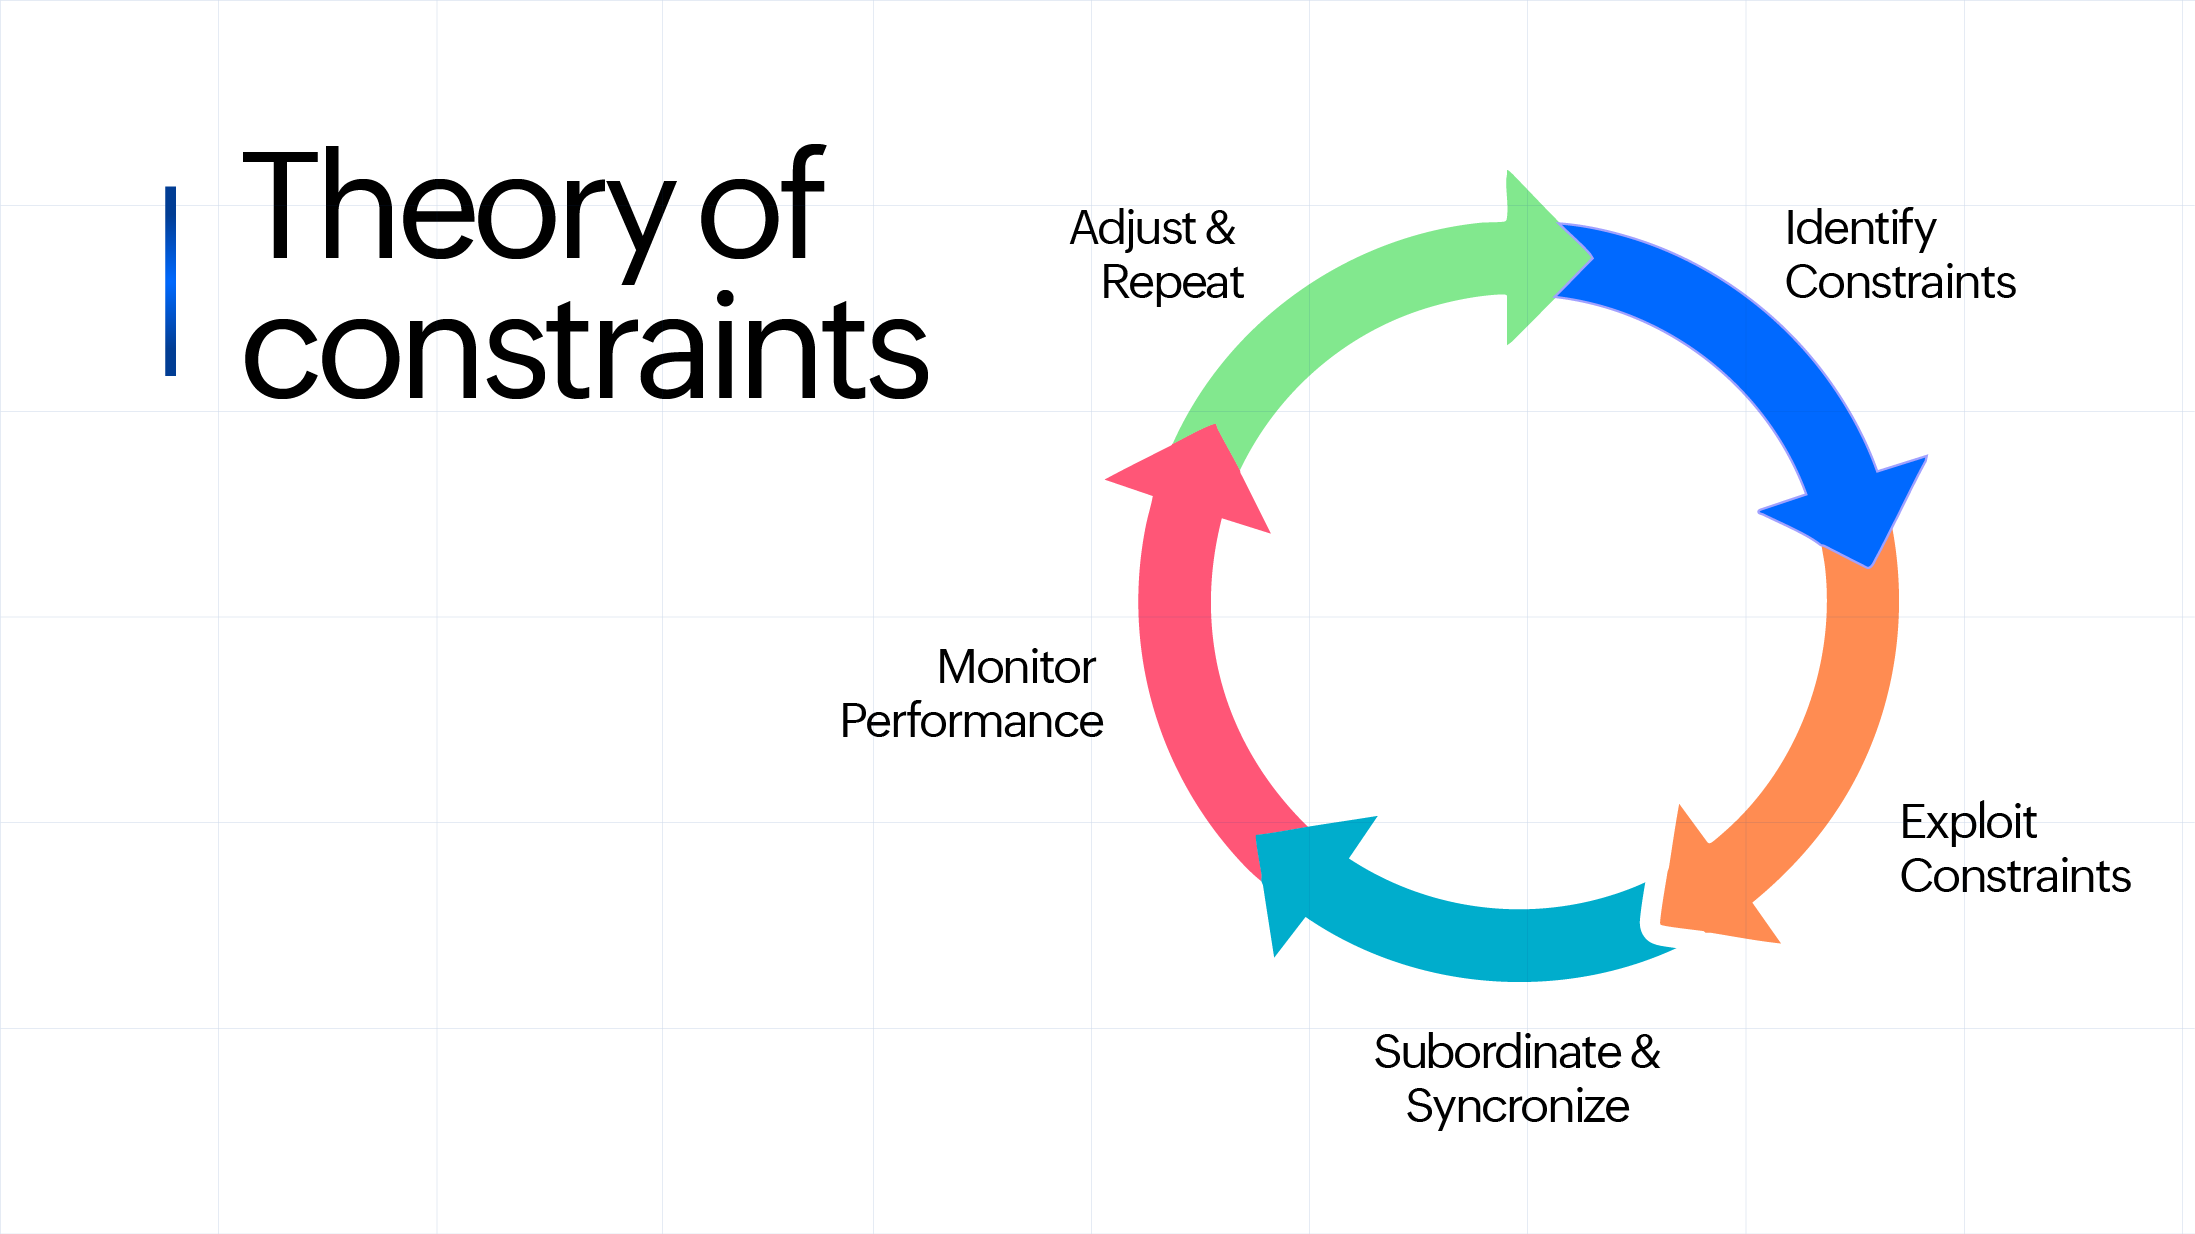
The Theory of Constraints focuses on identifying and improving the bottleneck within a production system. Every manufacturing system has at least one constraint that limits overall throughput.
Improving non-bottleneck machines may increase their individual OEE, but it does not increase overall plant output if the bottleneck remains unchanged.
TOC follows five steps:
- Identify the constraint
- Exploit the constraint
- Subordinate everything else to the constraint
- Elevate the constraint
- Repeat the cycle
Impact on Availability: Ensuring the bottleneck machine has maximum uptime is critical. Preventive maintenance is prioritized for constraint equipment.
Impact on Performance: Bottleneck machines must operate at optimal speed with minimal minor stops. Even small inefficiencies here affect total plant output.
Impact on Quality: Defects produced at the bottleneck are highly expensive because they waste the most valuable production time.
TOC ensures improvement efforts are focused where they matter most. Instead of spreading resources thin across all machines, it directs attention to the constraint that governs throughput. When the bottleneck improves, overall OEE and output improve significantly.
Benefits of OEE in Manufacturing
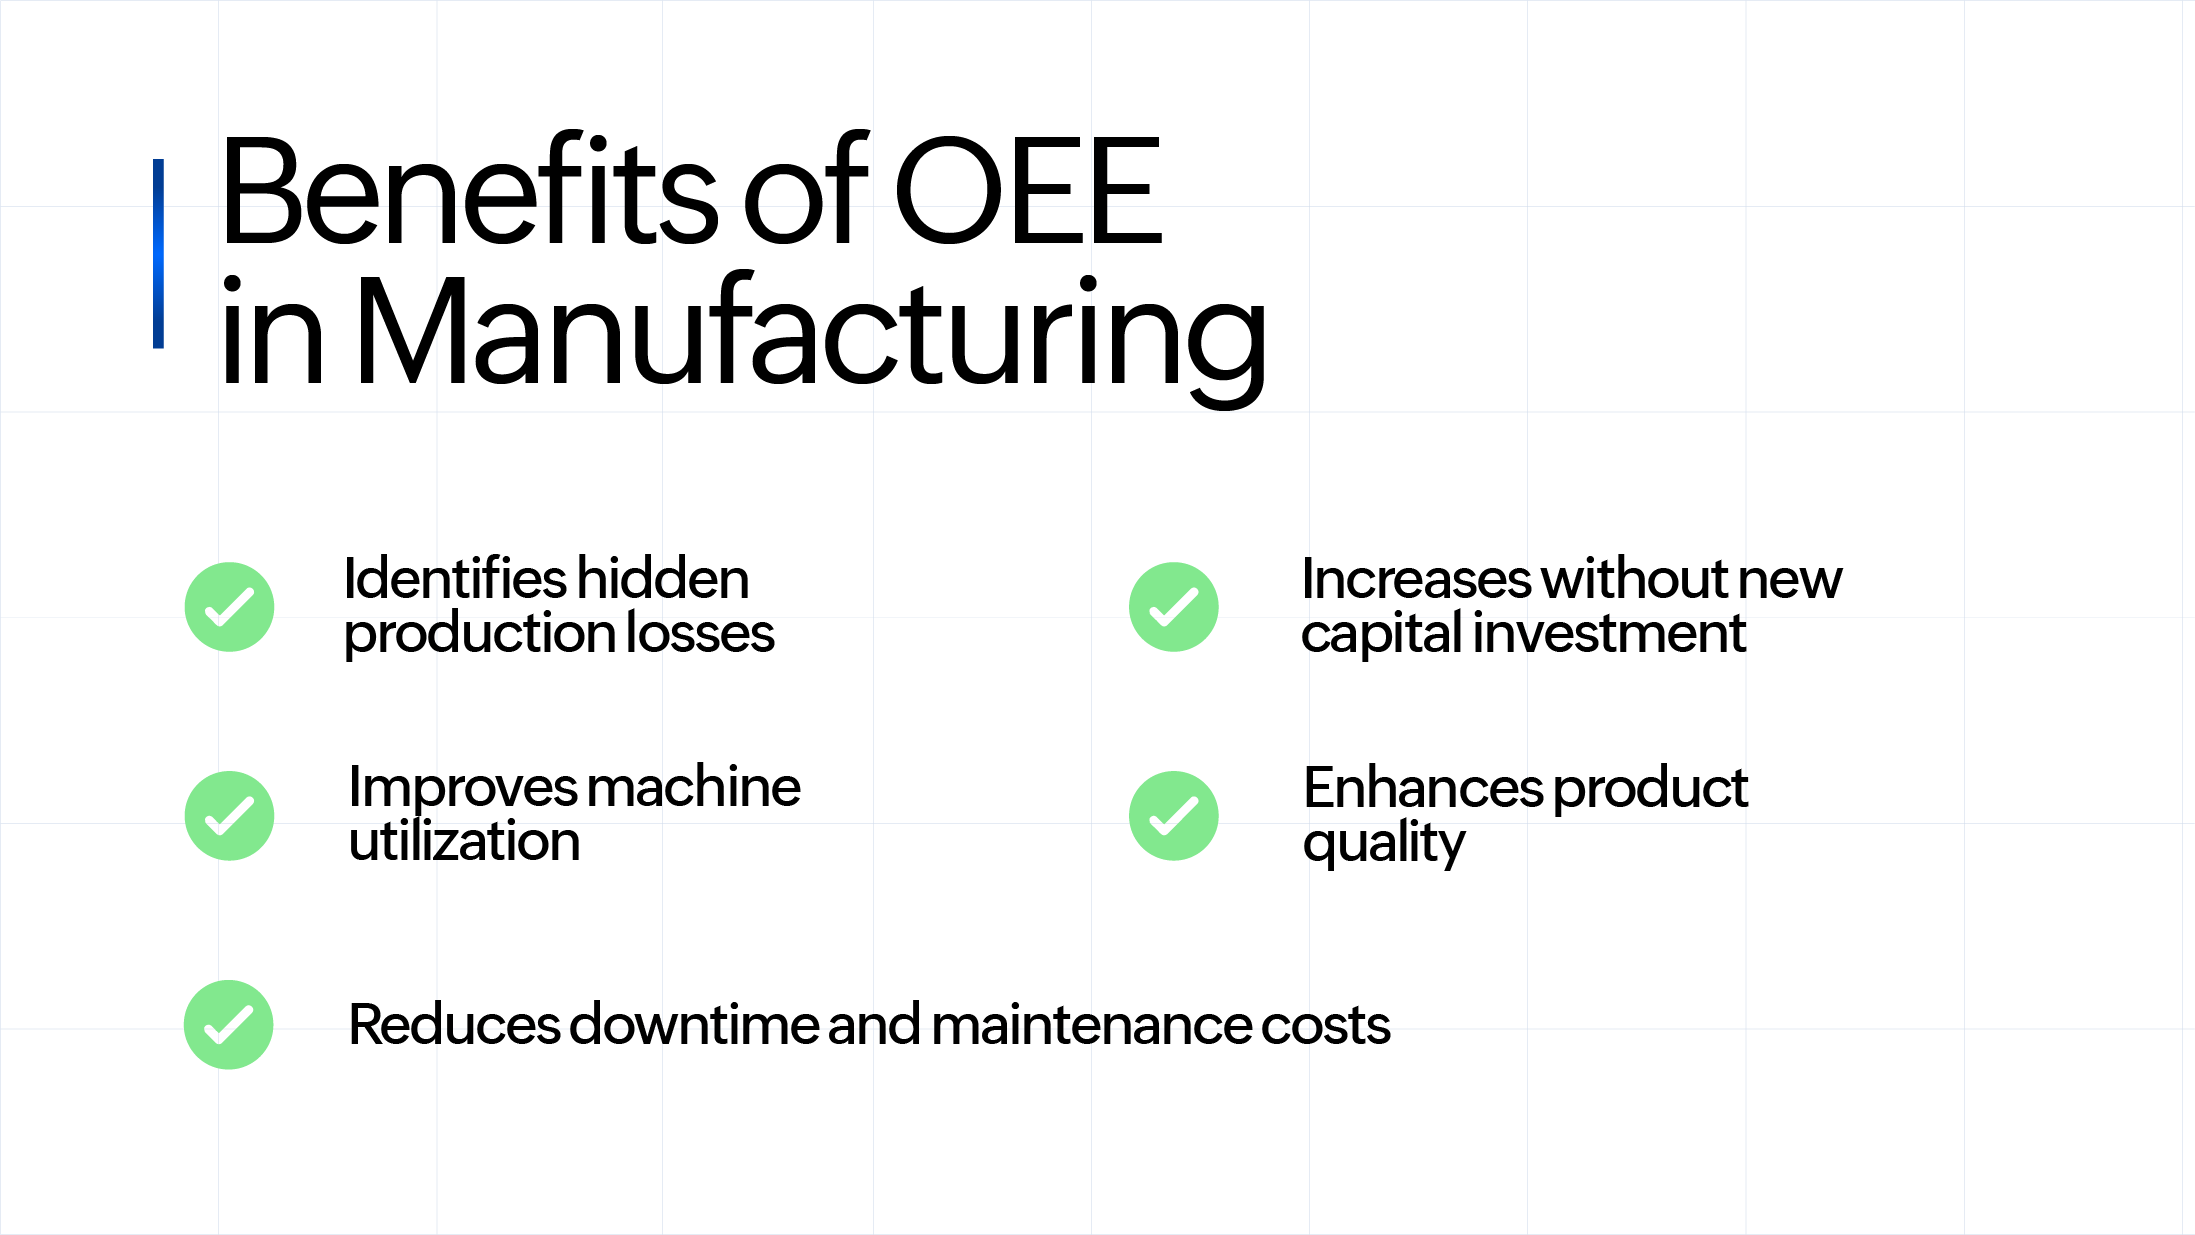
Identifies hidden production losses: OEE highlights losses that are not visible in traditional production reports, enabling manufacturers to address inefficiencies systematically.
Improves machine utilization: By identifying downtime and slow cycles, machines are used closer to their full capacity.
Increases throughput without new capital investment: Improving OEE unlocks hidden capacity, reducing the need for additional machines or expansion.
Enhances product quality: Tracking defects and startup losses improves process stability and customer satisfaction.
Reduces downtime and maintenance costs: Understanding breakdown patterns enables preventive and predictive maintenance strategies.
Improvement in OEE with IoT
Traditional OEE calculation relied heavily on manual reporting. This often led to inaccurate or delayed data. With IoT-enabled systems, OEE measurement becomes real-time, automated, and highly accurate.
Improving Availability with IoT
IoT sensors connected to machines continuously monitor operational states. They detect downtime instantly and categorize stoppages automatically. Maintenance teams receive real-time alerts, reducing response time. Predictive maintenance algorithms can analyze vibration, temperature, and runtime data to predict failures before they occur. This significantly reduces unplanned downtime.
Improving Performance with IoT
IoT systems track cycle time and compare it with ideal cycle time. If machines operate below designed speed, alerts are triggered. Operators and supervisors gain visibility into slow cycles and minor stops that were previously unnoticed. Real-time dashboards help teams optimize settings and eliminate bottlenecks faster.
Ensuring Quality with IoT
IoT integrates with quality inspection systems, vision systems, and production counters. Defects can be traced back to specific machines, batches, operators, or environmental conditions. Root cause analysis becomes data-driven instead of assumption-based. Early detection reduces scrap and rework.
Benefits of IoT-Based Solutions in Monitoring OEE
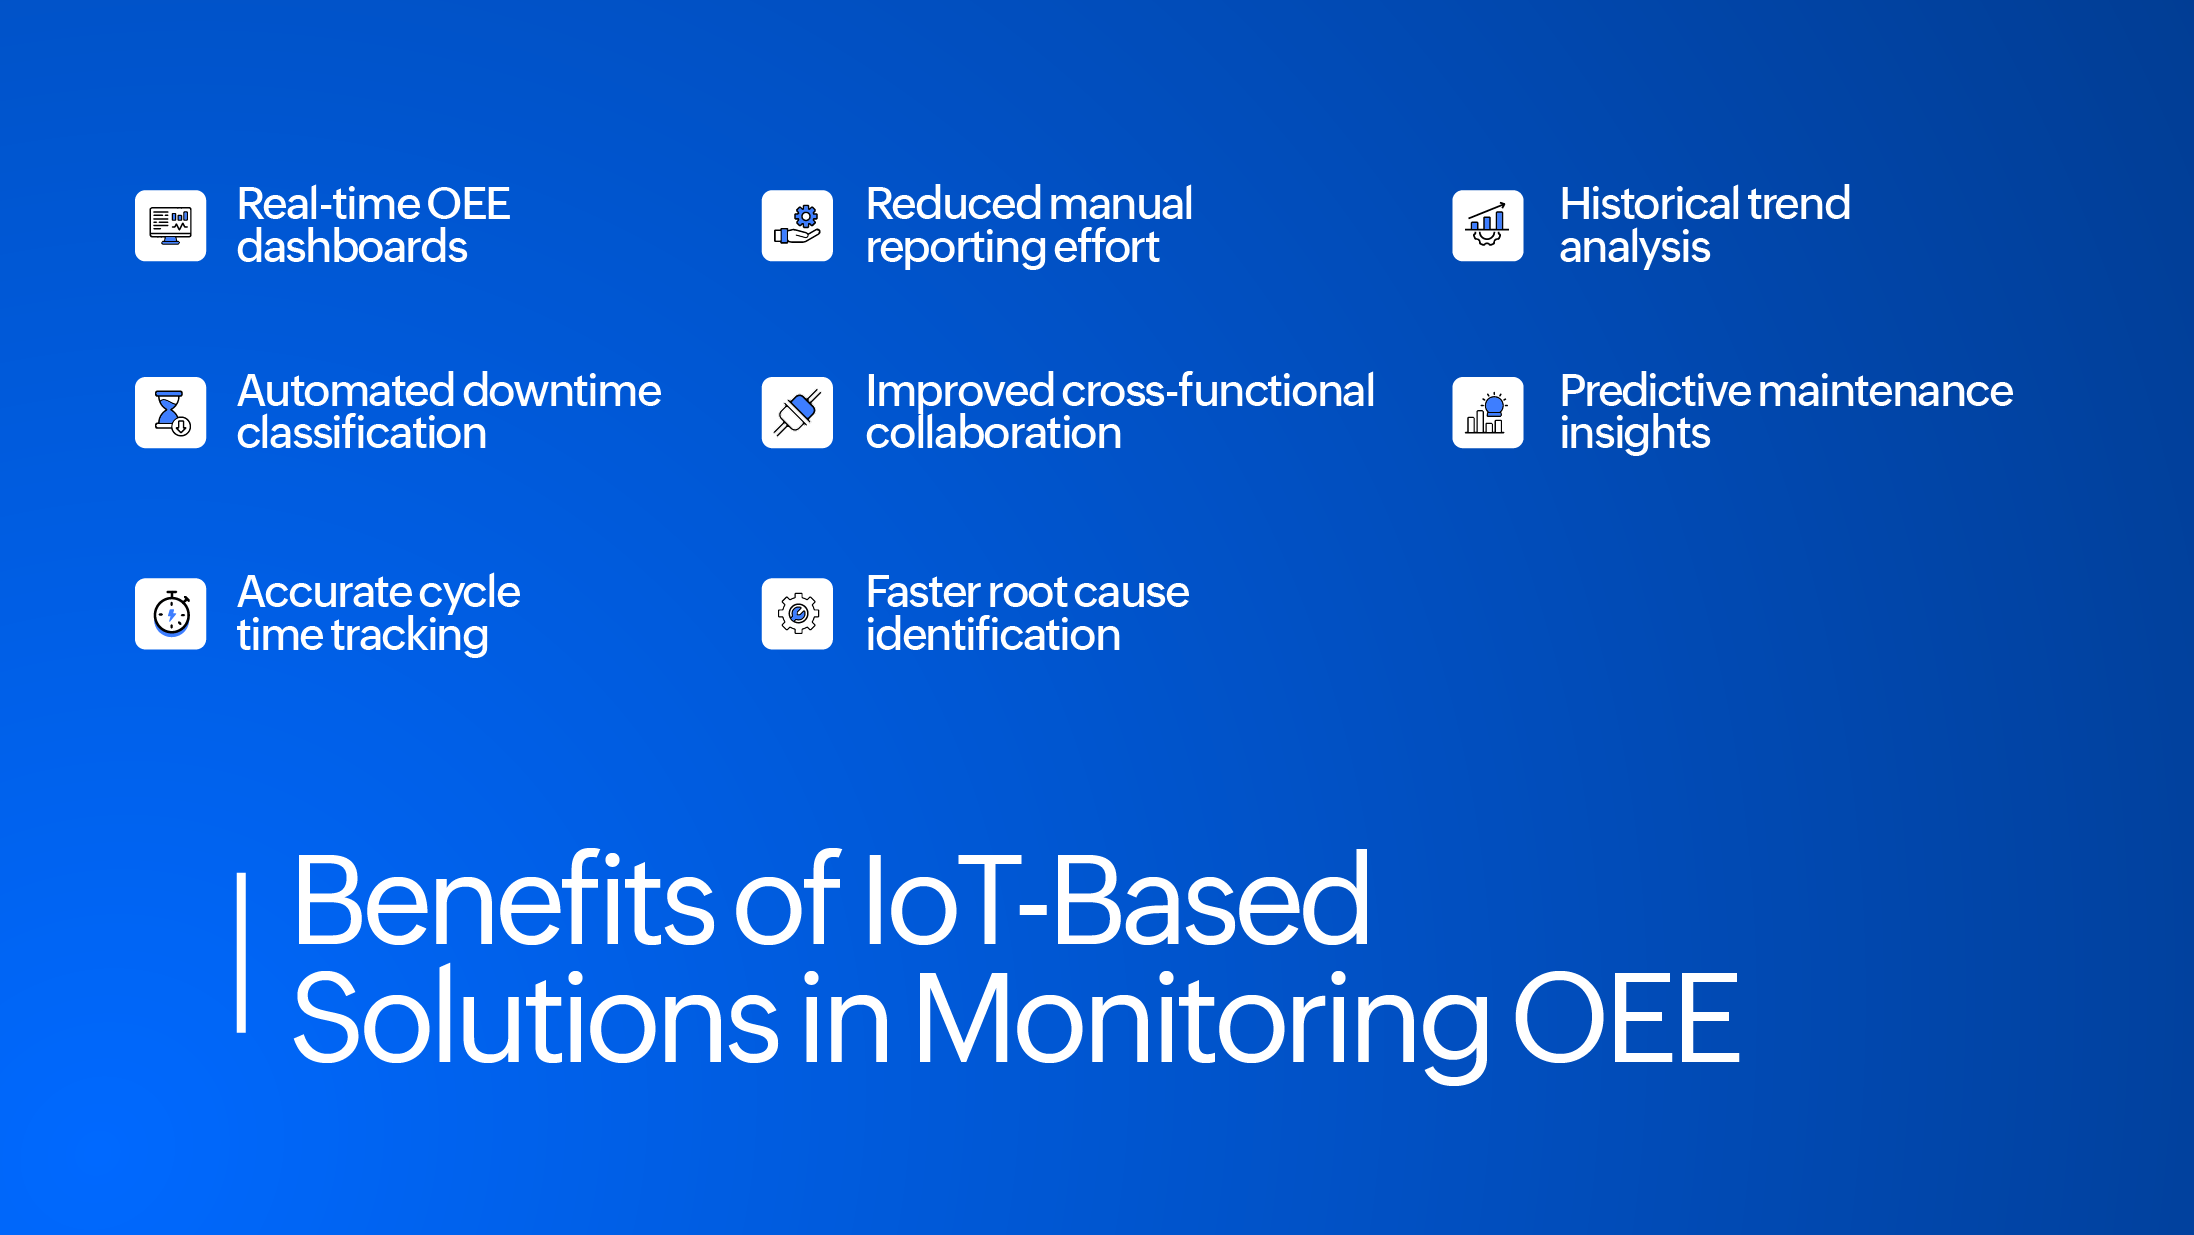
Real-time OEE dashboards:IIoT solutions provide live visibility into Availability, Performance, and Quality (APQ) metrics across machines, lines, and plants. Instead of waiting for end-of-shift or end-of-day reports, supervisors can instantly see deviations and take corrective action immediately.
Automated downtime classification: IoT systems automatically detect machine states such as running, idle, fault, setup, or maintenance using PLC signals and sensors. This eliminates manual logging errors and ensures accurate root cause categorization of downtime events.
Predictive maintenance insights: By analyzing vibration, temperature, current, pressure, and runtime data, IoT systems can predict potential failures before they occur. This significantly reduces unplanned downtime, improves Availability, and extends equipment lifespan.
Accurate cycle time tracking: IoT-based counters measure actual cycle times and compare them against ideal cycle times in real time. This helps identify slow cycles and performance degradation that may not be visible to operators.
Historical trend analysis: IoT systems store long-term production and downtime data, enabling trend analysis over weeks, months, or years. This helps identify recurring patterns, seasonal inefficiencies, and gradual performance degradation.
Faster root cause identification: With timestamped and categorized data, engineers can quickly correlate downtime with specific machine parameters, operators, shifts, or environmental conditions. This reduces the time spent in investigation and accelerates corrective action.
Improved cross-functional collaboration: Since OEE data is accessible to production, maintenance, and quality teams simultaneously, decision-making becomes collaborative. Shared visibility breaks silos and aligns teams toward common performance goals.
Reduced manual reporting effort: Operators no longer need to fill in paper logs or spreadsheets. Automated data capture reduces administrative burden and allows operators to focus on production activities.
The impact of improving OEE
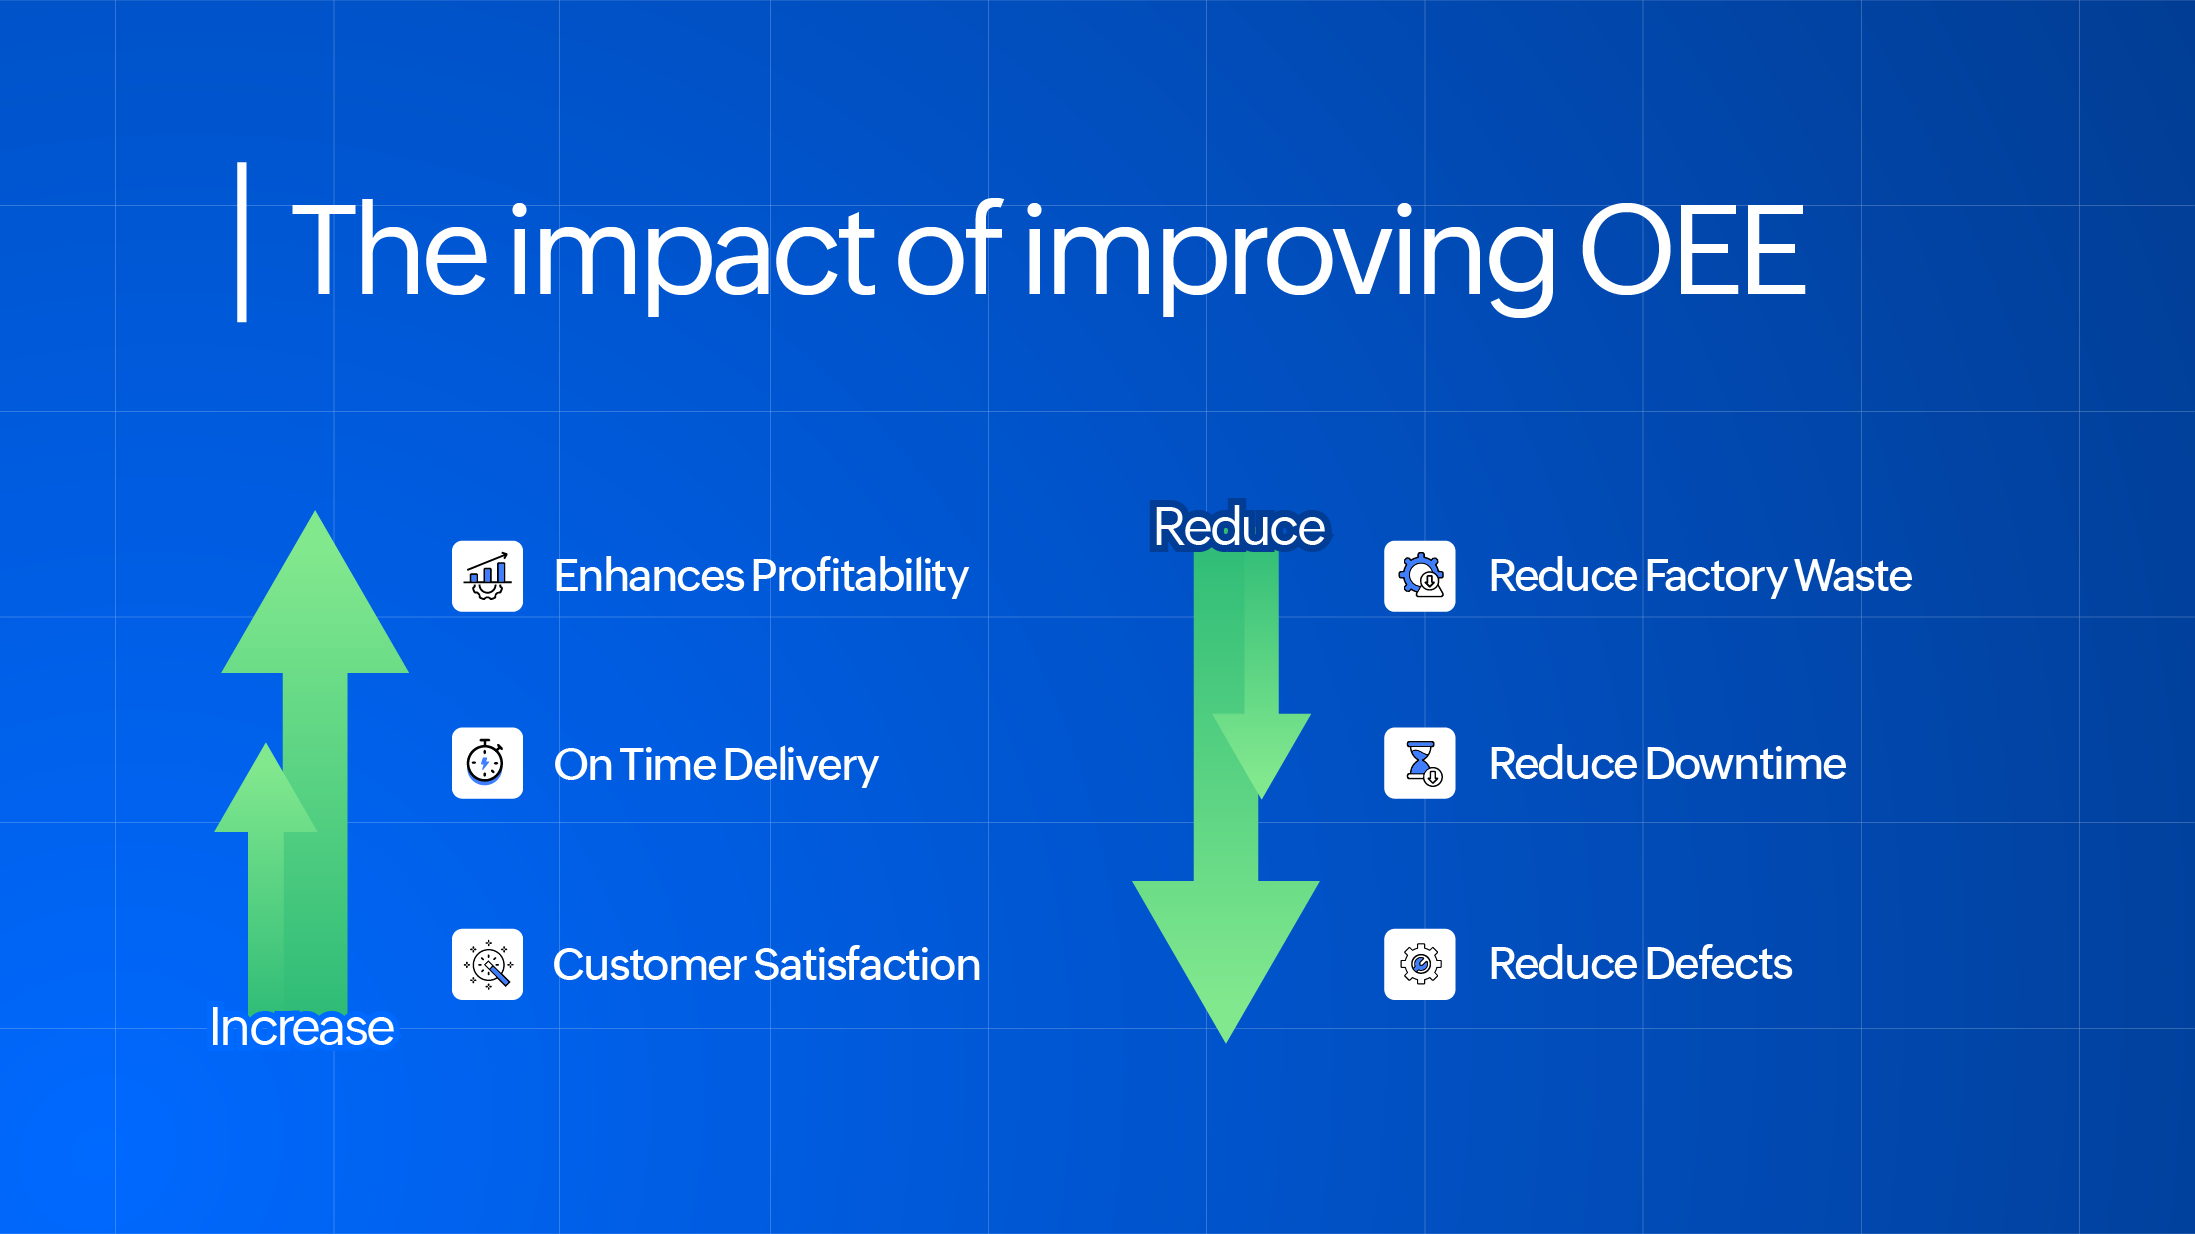
Improving OEE directly increases production capacity without additional capital expenditure. It enhances profitability by reducing waste, downtime, and defects.
Higher OEE leads to better on-time delivery performance, improved customer satisfaction, and stronger competitive positioning. It creates a culture of accountability and continuous improvement on the shop floor.
When OEE becomes part of daily operational discussions, decision-making shifts from reactive firefighting to proactive optimization.
Conclusion
OEE is not just a number; it is a reflection of how efficiently a factory operates. From its origin in TPM philosophy to becoming a global manufacturing benchmark, OEE has evolved into a powerful performance measurement tool.
By understanding Availability, Performance, and Quality and systematically reducing the six big losses manufacturers unlock hidden capacity and drive operational excellence.
With the integration of IoT technologies, OEE monitoring is no longer reactive or manual. It becomes intelligent, predictive, and actionable.
Factories that master OEE do not just improve productivity; they build resilient, data-driven, and future-ready manufacturing ecosystems.
To take this a step further, manufacturers can leverage platforms like Zoho IoT to monitor OEE in real time. With live dashboards, factories can track Availability, Performance, and Quality metrics across machines and production lines as they happen. Historical data captured over time provides deeper insights into recurring losses, performance trends, and quality deviations, enabling continuous improvement initiatives.
Ready to see it in action? Book your free demo today and experience how OEE monitoring and data-driven insights can transform your shop floor performance.