- HOME
- Know Your Tech
- Application performance issues: Causes, fixes, and tips
Application performance issues: Causes, fixes, and tips
- Last Updated : March 2, 2026
- 853 Views
- 11 Min Read
Is your application slowing down during critical business hours? Application performance issues directly affect revenue, productivity, and customer satisfaction. In fact, data shows that businesses experience losses of around $200 million annually from digital system issues.
Highlights
- Monitor performance regularly: Set up alerts to quickly detect and address performance issues, ensuring a smooth user experience.
- Optimize database and server configurations: Improve query efficiency and adjust server settings to handle growing traffic demands.
- Implement caching and CDNs: Use caching and content delivery networks to speed up data retrieval and reduce load times.
- Refactor code and review third-party integrations: Regularly optimize your code and evaluate external services to maintain high application performance.
Cloud-based applications provide significant advantages, including scalability, flexibility, and cost savings—but they're not without their challenges. Misconfigurations, network congestion, and traffic overloads can all contribute to poor performance, slowing down workflows and affecting the user experience.
As a business leader, understanding how to troubleshoot application performance is essential. While cloud environments can be complex, pinpointing performance issues doesn't have to be difficult. In this guide, we’ll explore practical ways to identify misconfigurations, manage traffic, and use techniques like distributed tracing and synthetic testing.
What are application performance issues?
Application performance issues are problems related to response time, resource usage, or system reliability that prevent applications from functioning as expected. These issues often arise from inefficient code, insufficient server resources, or poorly optimized database queries.
Performance problems may manifest as slow load times, long transaction processing, or lag during user interactions. For instance, during peak shopping hours, an ecommerce checkout page might take 15 seconds to load instead of 2 seconds due to database query delays. This slowdown causes abandoned carts and lost revenue.
Such issues not only hinder user experience but can also impact revenue and customer satisfaction. As businesses scale, the need for efficient application performance becomes increasingly critical, as systems must handle growing traffic and complex processes.
Common causes of application performance issues
The application performance monitoring market worldwide is anticipated to grow at a rate of 11.31% annually from 2025 to 2032. This growth shows how organizations now prioritize effective systematic monitoring and troubleshooting to manage increasing complexity.
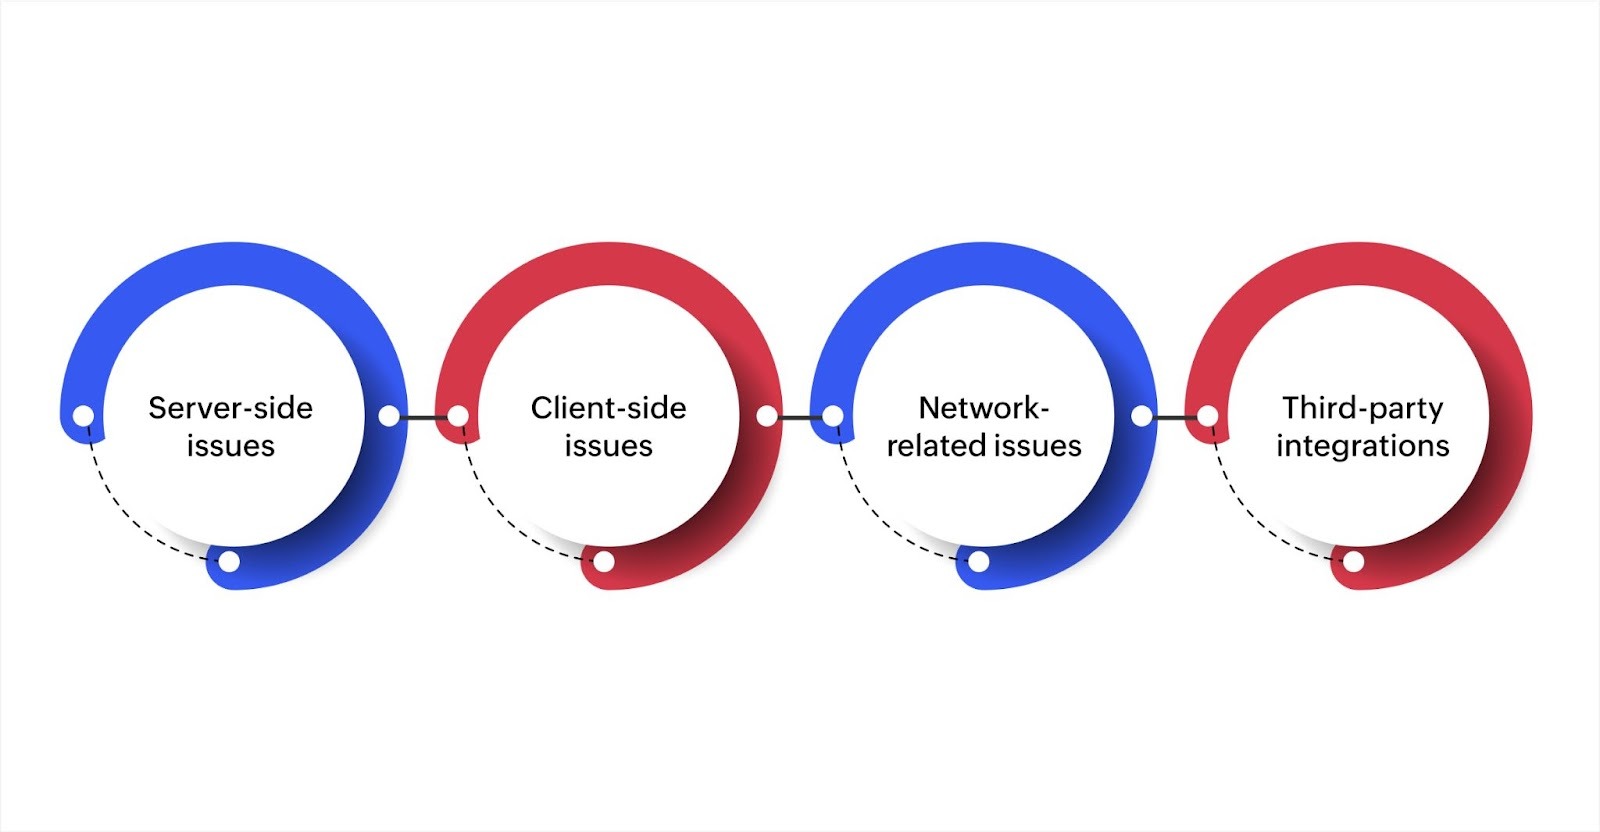
To ensure smooth functionality and maintain a positive user experience, it's essential to understand the various causes of performance issues, such as server-side, client-side, network-related, and third-party integrations.
Server-side issues
Server-side problems originate from the backend infrastructure, where your application processes requests and manages data. These issues affect all users because they impact the core systems running your application.
Common server-side problems include:
- Insufficient server resources: Servers have limited CPU, memory, and processing capacity. When usage exceeds these limits, response times increase and applications may crash. For instance, a customer database handling 10,000 concurrent queries might run out of memory if results aren't cached properly.
- Inefficient code execution: Code that processes data poorly consumes excess server resources. Loops running thousands of unnecessary iterations or functions that don't release memory create slowdowns that worsen as more users access the application.
- Poorly optimized databases: Slow queries or missing database indexes delay data retrieval. A query that searches through millions of records without proper indexing might take 10 seconds instead of less than one second.
Handling server-side issues typically involves optimizing code, improving database queries through better indexing, and ensuring adequate server capacity for your workload.
Client-side issues
Client-side problems occur on user devices and browsers, affecting how interfaces load and respond to interactions. These issues create inconsistent experiences because they vary based on each user's device and browser.
Typical client-side problems you'll encounter:
- Browser compatibility differences: Different browsers render code differently due to varying JavaScript engines and CSS support. A dashboard that loads smoothly in Chrome might lag in Safari, causing frustration for users on specific browsers.
- Heavy front-end processing: Large JavaScript files or complex rendering logic slow page loads, especially on mobile devices with limited power. A page loading 15 chart libraries simultaneously might take 8 seconds to render instead of 2 seconds.
- Unoptimized images and assets: Large image files or uncompressed resources increase load times. High-resolution images that aren't properly sized for web display force users to download unnecessary data.
Fixing client-side issues involves testing across major browsers, optimizing front-end scripts, compressing assets, and ensuring code runs efficiently on various devices.
Network-related issues
Network problems introduce delays in data transmission between users and servers, affecting how quickly your application responds to requests. These issues become more noticeable as your user base spreads geographically.
The most common network problems are:
- High latency: Data traveling long distances experiences delays. For instance, users in Asia accessing servers in North America might wait 300 milliseconds per request instead of 50 milliseconds, making the application feel sluggish.
- Packet loss: When data packets fail to reach their destination, systems must resend them, increasing delays. Even small amounts of packet loss during video calls or real-time updates create noticeable disruptions.
- Bandwidth constraints: Limited bandwidth slows transfers when multiple users access large files simultaneously. For instance, 50 employees downloading reports at month-end might saturate available bandwidth, causing timeouts across the application.
Reducing network issues requires using geographically distributed servers, implementing content delivery networks to serve files from locations closer to users, and optimizing data transfer through compression and efficient protocols.
Third-party integrations
Applications often depend on external services for payments, authentication, or data enrichment. Problems in these external systems directly affect your application's performance, even when your own infrastructure functions properly.
Issues with external services include:
- API failures and delays: Third-party services experience performance issues or outages. When a shipping calculator API responds slowly, order processing stalls. An API that normally returns rates in 1 second but suddenly takes 8 seconds causes checkout delays and customer frustration.
- Service unavailability: External services sometimes go offline completely. If your authentication service becomes unavailable, users cannot log in even though your application works fine otherwise.
- Rate limiting: Third-party APIs often limit how many requests you can make per minute. Exceeding these limits causes failed requests and forces your application to retry operations, creating additional delays.
Managing third-party integration issues involves implementing fallback mechanisms, adding retry logic with appropriate delays, monitoring each integration's performance separately, and having contingency plans when external services fail.
Also read: 6 challenges that hinder application development, and how Zoho Creator can help
Key metrics to monitor for performance troubleshooting
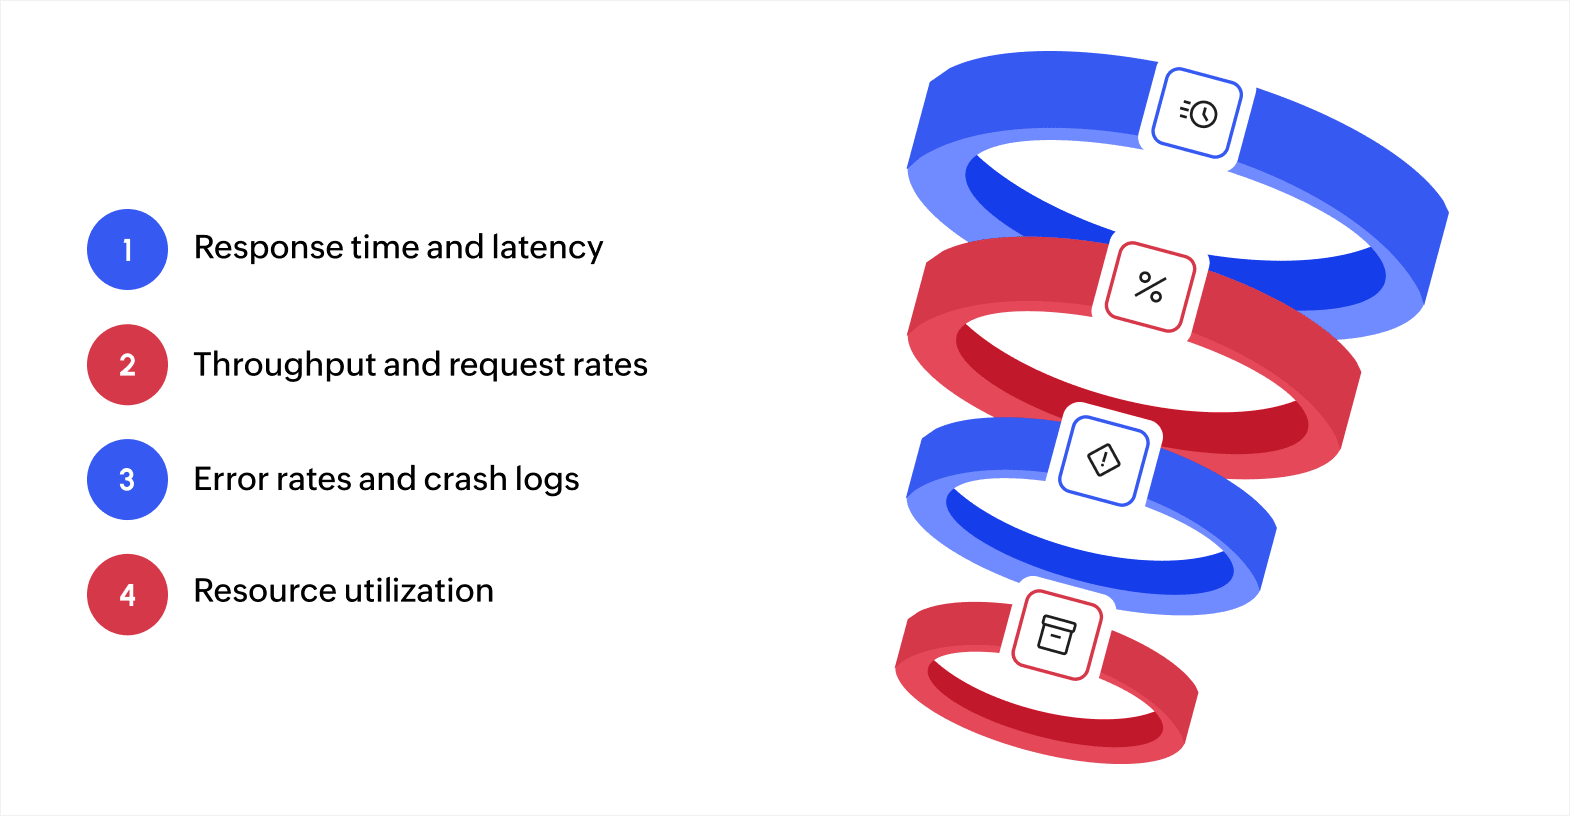
Understanding your metrics helps pinpoint areas where performance might degrade and allows you to take corrective action before these issues disrupt business operations. Here's a breakdown of the metrics to track for maintaining optimal performance.
Response time and latency
Response time measures how long applications take to process requests from start to completion. Latency measures the delay before processing begins.
High response times indicate processing bottlenecks in your code, database, or infrastructure. Consistently slow responses point to capacity problems or inefficient operations. Sudden spikes in response time during specific hours suggest load-related issues that require scaling solutions.
Latency reveals network and infrastructure delays. High latency between services indicates network congestion or geographic distance between components. Tracking latency patterns helps determine whether performance issues originate from network paths or application processing.
Throughput and request rates
Throughput measures how many requests your application processes per unit of time. Request rates track incoming demand.
Low throughput relative to request rates indicates your system can't handle current demand. This mismatch reveals capacity constraints requiring infrastructure scaling or code optimization. For instance, if request rates triple during peak hours but throughput only increases minimally, you have a scaling problem.
Monitoring both metrics together shows whether performance issues stem from insufficient capacity or inefficient processing. High request rates with proportional throughput suggest healthy scaling. High requests with flat throughput indicate bottlenecks.
Error rates and crash logs
Error rates track the frequency of failed requests, exceptions, and crashes. Crash logs provide detailed context about failures.
Rising error rates signal code problems, resource exhaustion, or integration failures. Patterns in error types reveal specific issues, like database timeout errors indicating query problems, while memory errors suggest resource leaks.
Crash logs contain stack traces showing exactly where failures occur. Reviewing these logs systematically helps identify whether crashes occur because of specific code paths, particular user actions, or resource conditions.
Resource utilization (CPU, memory, storage)
Resource utilization tracks CPU usage, memory consumption, and storage capacity across your infrastructure.
High CPU usage indicates processing-intensive operations or inefficient algorithms consuming excess computational power. Sustained high CPU suggests code optimization needs or insufficient processing capacity for the current load.
Memory consumption patterns reveal whether applications manage data efficiently. Gradually increasing memory usage without corresponding load increases indicates memory leaks. Sudden memory spikes during specific operations point to inefficient data handling in those processes.
Step-by-step guide to troubleshooting application performance
Application performance issues can hinder both user experience and business operations. Following a structured approach ensures that these issues are diagnosed and resolved effectively. Here’s a step-by-step guide for troubleshooting performance problems.
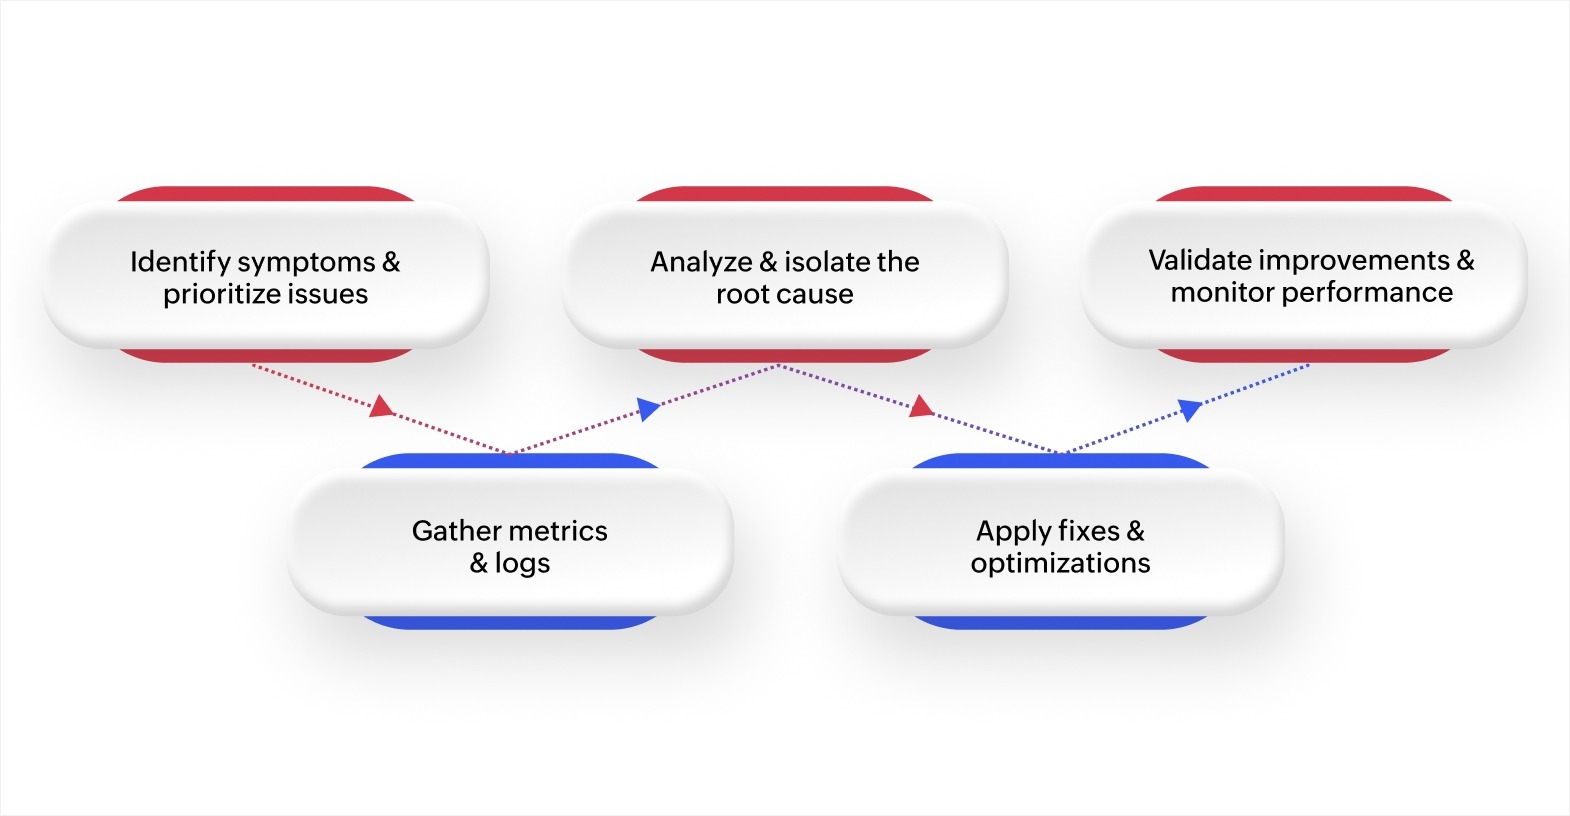
Step 1: Identify symptoms and prioritize issues
Start by identifying the performance issues users are facing. Common symptoms include slow response times, frequent errors, system crashes, or high resource usage.
Once you've identified the issues, prioritize them based on their impact. Problems affecting user transactions or key business processes should be dealt with first.
Step 2: Gather metrics and logs
Collect relevant metrics and logs to help diagnose the problem. Key metrics include:
- Response time: The time taken for the system to respond to requests
- Error rates: The frequency of errors or failures in the system
- Resource usage: CPU, memory, and disk usage statistics
- Throughput: The volume of requests the application handles over a specific period
Logs from the application, database, and web servers provide valuable data for pinpointing issues. Use application performance monitoring (APM) tools to capture real-time metrics and visualize trends that can guide your investigation.
Step 3: Analyze and isolate the root cause
Analyze the data you've collected to identify patterns or anomalies. Look for signs of specific issues, such as:
- Database delays: Slow queries or inefficient data retrieval
- Code inefficiencies: Areas of the code that may be taking too long to execute
- Network delays: Latency between services or systems
- Scalability challenges: The system's inability to handle increased load
By isolating the root cause, you ensure that you're addressing the actual problem rather than treating only the symptoms.
Step 4: Apply fixes and optimizations
Once you've identified the root cause, apply fixes that directly address the issue. This may involve:
- Refactoring code: Making improvements to the way data is handled or processing is done
- Optimizing database performance: Using better indexing, rewriting queries, or introducing caching
- Scaling infrastructure: Adding servers or using load balancing to handle higher traffic volumes
- Implementing caching: Using caching tools to reduce the load on backend systems
Validate changes in a staging environment first to confirm they work as expected, and don’t introduce any new problems before deploying them to production.
Step 5: Validate improvements and monitor ongoing performance
After applying fixes, validate any improvements by performing tests under typical usage conditions. Tools like Apache JMeter (an open-source load testing tool commonly used by development teams to verify performance) or LoadRunner (an enterprise testing platform for organizations managing large-scale applications) can simulate real-world traffic and help you confirm that the issues have been resolved.
Once fixes are confirmed, implement continuous monitoring. Tools such as Grafana, Prometheus, or Datadog help track the application's performance in real time and alert you to any emerging issues, allowing you to react quickly and maintain stable performance.
By following this systematic troubleshooting approach, you can quickly identify and resolve performance problems. Focusing on the root cause and applying targeted fixes will help maintain smooth application performance over time. Ongoing monitoring ensures that the application continues to perform well as user needs evolve.
Best practices and tips for maintaining optimal application performance
Here are some key strategies to keep your application performing at its best:
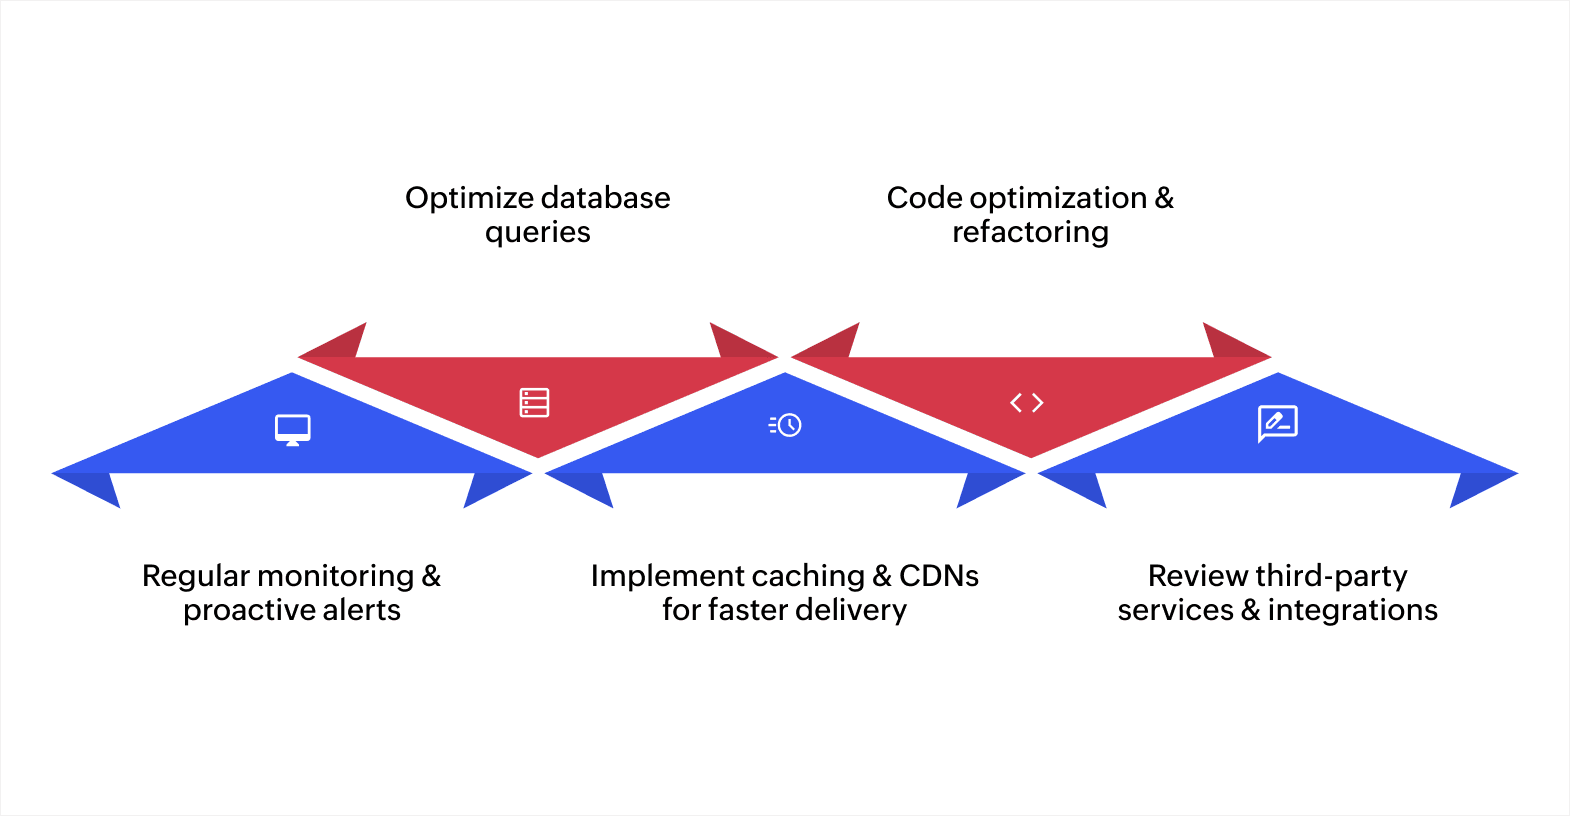
Set up regular monitoring and proactive alerts
Monitoring is vital for ensuring that your application functions smoothly. By tracking performance indicators like response times and system resource usage, you can spot potential issues before they impact users. Platforms like Zoho Creator provide real-time insights into your application's health, allowing you to stay on top of performance metrics.
Setting proactive alerts helps you respond to problems quickly. By being notified of performance issues as they arise, you can take corrective action before users notice a slowdown.
Optimize database queries and server configurations
Database queries and server configurations are often the root causes of performance bottlenecks. Ensure your queries are optimized to reduce load times and database strain. Techniques such as indexing and query restructuring can significantly improve performance.
Also, periodically review and adjust your server configurations, including memory allocation and thread management, to ensure they match your application's requirements. Optimized server settings can handle higher traffic and resource demands without slowing down.
Implement caching and CDNs for faster delivery
Leveraging caching and content delivery networks significantly accelerate your application by reducing latency and improving the efficiency of data transfer. Caching temporarily stores frequently accessed data, reducing database load and improving response times. CDNs, which distribute content across global servers, allow users to access data more quickly by serving it from the nearest location. Together, these tools help reduce latency and enhance the overall speed of your application.
Optimize and refactor code
Over time, your code may become inefficient, which can affect performance. Regularly optimizing and refactoring your codebase removes redundancies, simplifies complex logic, and improves processing speed.
This approach not only enhances performance but also ensures scalability as your application grows. A well-structured codebase supports new features and higher traffic without sacrificing performance.
Review third-party services and integrations
While third-party services enhance functionality, they can also introduce performance challenges. Consistently evaluate how third-party services are affecting your application's performance. Ensure that these integrations are running smoothly and that they don’t slow down your system.
If a service is causing delays, explore alternative solutions or optimize how it integrates with your application. This ensures your app remains fast, even as it relies on external services.
Proactive monitoring, database optimization, caching, and managing third-party services are all essential in keeping your application efficient and responsive.
Ensuring optimal application performance
Ensuring that your application performs at its best isn’t just about fixing problems as they arise; it’s about actively preventing them. By regularly monitoring your application, optimizing key areas like databases and server configurations, and keeping an eye on third-party integrations, you can maintain a smooth, efficient user experience.
At Zoho Creator, this process is simplified with its unique low-code capabilities, combining ease of use with powerful features. With drag-and-drop functionality, you can quickly build custom applications that meet your business needs.
Its built-in analytics and performance monitoring tools make it easier to track and resolve performance issues in real time. Creator also integrates seamlessly with other Zoho apps and third-party services, allowing you to create a fully connected ecosystem.
Ready to improve your application’s performance? Sign up for Zoho Creator today and start building custom applications with ease!
FAQ
1. How can the scalability of my application affect its performance?
As your user base expands, ensuring scalability becomes essential for maintaining performance. Without proper scaling, your application may struggle to handle increased traffic, resulting in slow load times and poor performance.
2. What tools can help with real-time performance troubleshooting?
Tools like New Relic, Datadog, and Grafana can provide real-time monitoring of your application's performance. These tools enable you to visualize key metrics and quickly identify performance delays, allowing for immediate corrective actions.
3. How can I prevent performance issues when deploying new features?
To prevent performance problems when deploying new features, use staging environments to test code under real traffic conditions. Load testing and performance profiling can also help ensure that new updates don't negatively impact application performance.
4. What’s the impact of inefficient code on long-term application performance?
Inefficient code can lead to increasing performance issues over time, especially as your application scales. Code that’s not optimized can consume more system resources, causing slowdowns, crashes, or memory leaks, which degrade user experience and increase operational costs.
 Bharathi Monika Venkatesan
Bharathi Monika Venkatesan is a content writer at Zoho Creator. Outside of work, she enjoys exploring history, reading short novels, and cherishing moments of personal introspection.