Why traditional dashboards make interpretation harder—and how Dashboard 2.0 reshapes visibility

As organizations grow more interconnected, the challenge is no longer collecting information. It is understanding what that information is saying in the context of ongoing work.
Dashboards were originally designed as reporting surfaces. They brought numbers together from different systems and presented them side by side. Over time, as work became more distributed, those dashboards accumulated more widgets, more charts, and more metrics. What they did not accumulate was context.
In practice, people move between dashboards, reports, and applications to form a picture of what is happening.
This movement requires mental reconstruction: connecting signals that were never designed to be seen together. The effort involved is subtle, but it affects how quickly and confidently teams can interpret what they are seeing.
This is the gap Dashboard 2.0 addresses.
Why visibility needed to change
Many dashboards mirror the structure of the systems they pull data from. Sales metrics appear in one place, financial indicators in another, operational data somewhere else. While this reflects how software is organized, it does not reflect how people think when they are trying to understand a situation.
A sales leader reviewing pipeline health may also need to consider cash flow trends. A support manager tracking ticket volume may need to understand staffing or escalation patterns. When these signals are separated by design, users spend time assembling meaning rather than evaluating it.
The friction does not come from a lack of information. It comes from how information is arranged and surfaced.
A shift in how dashboards are designed
Dashboard 2.0 takes a different approach by treating dashboards as "perception surfaces" rather than reporting containers.
Instead of focusing on how data is stored or which application it originates from, Dashboard 2.0 focuses on how information is interpreted. The emphasis shifts from displaying everything to presenting what is relevant for a given role, situation, or line of inquiry.
This reframing allows dashboards to support reasoning, not just observation.
How Dashboard 2.0 works in everyday use
Dashboard 2.0 introduces changes that affect both how dashboards are built and how they are experienced.
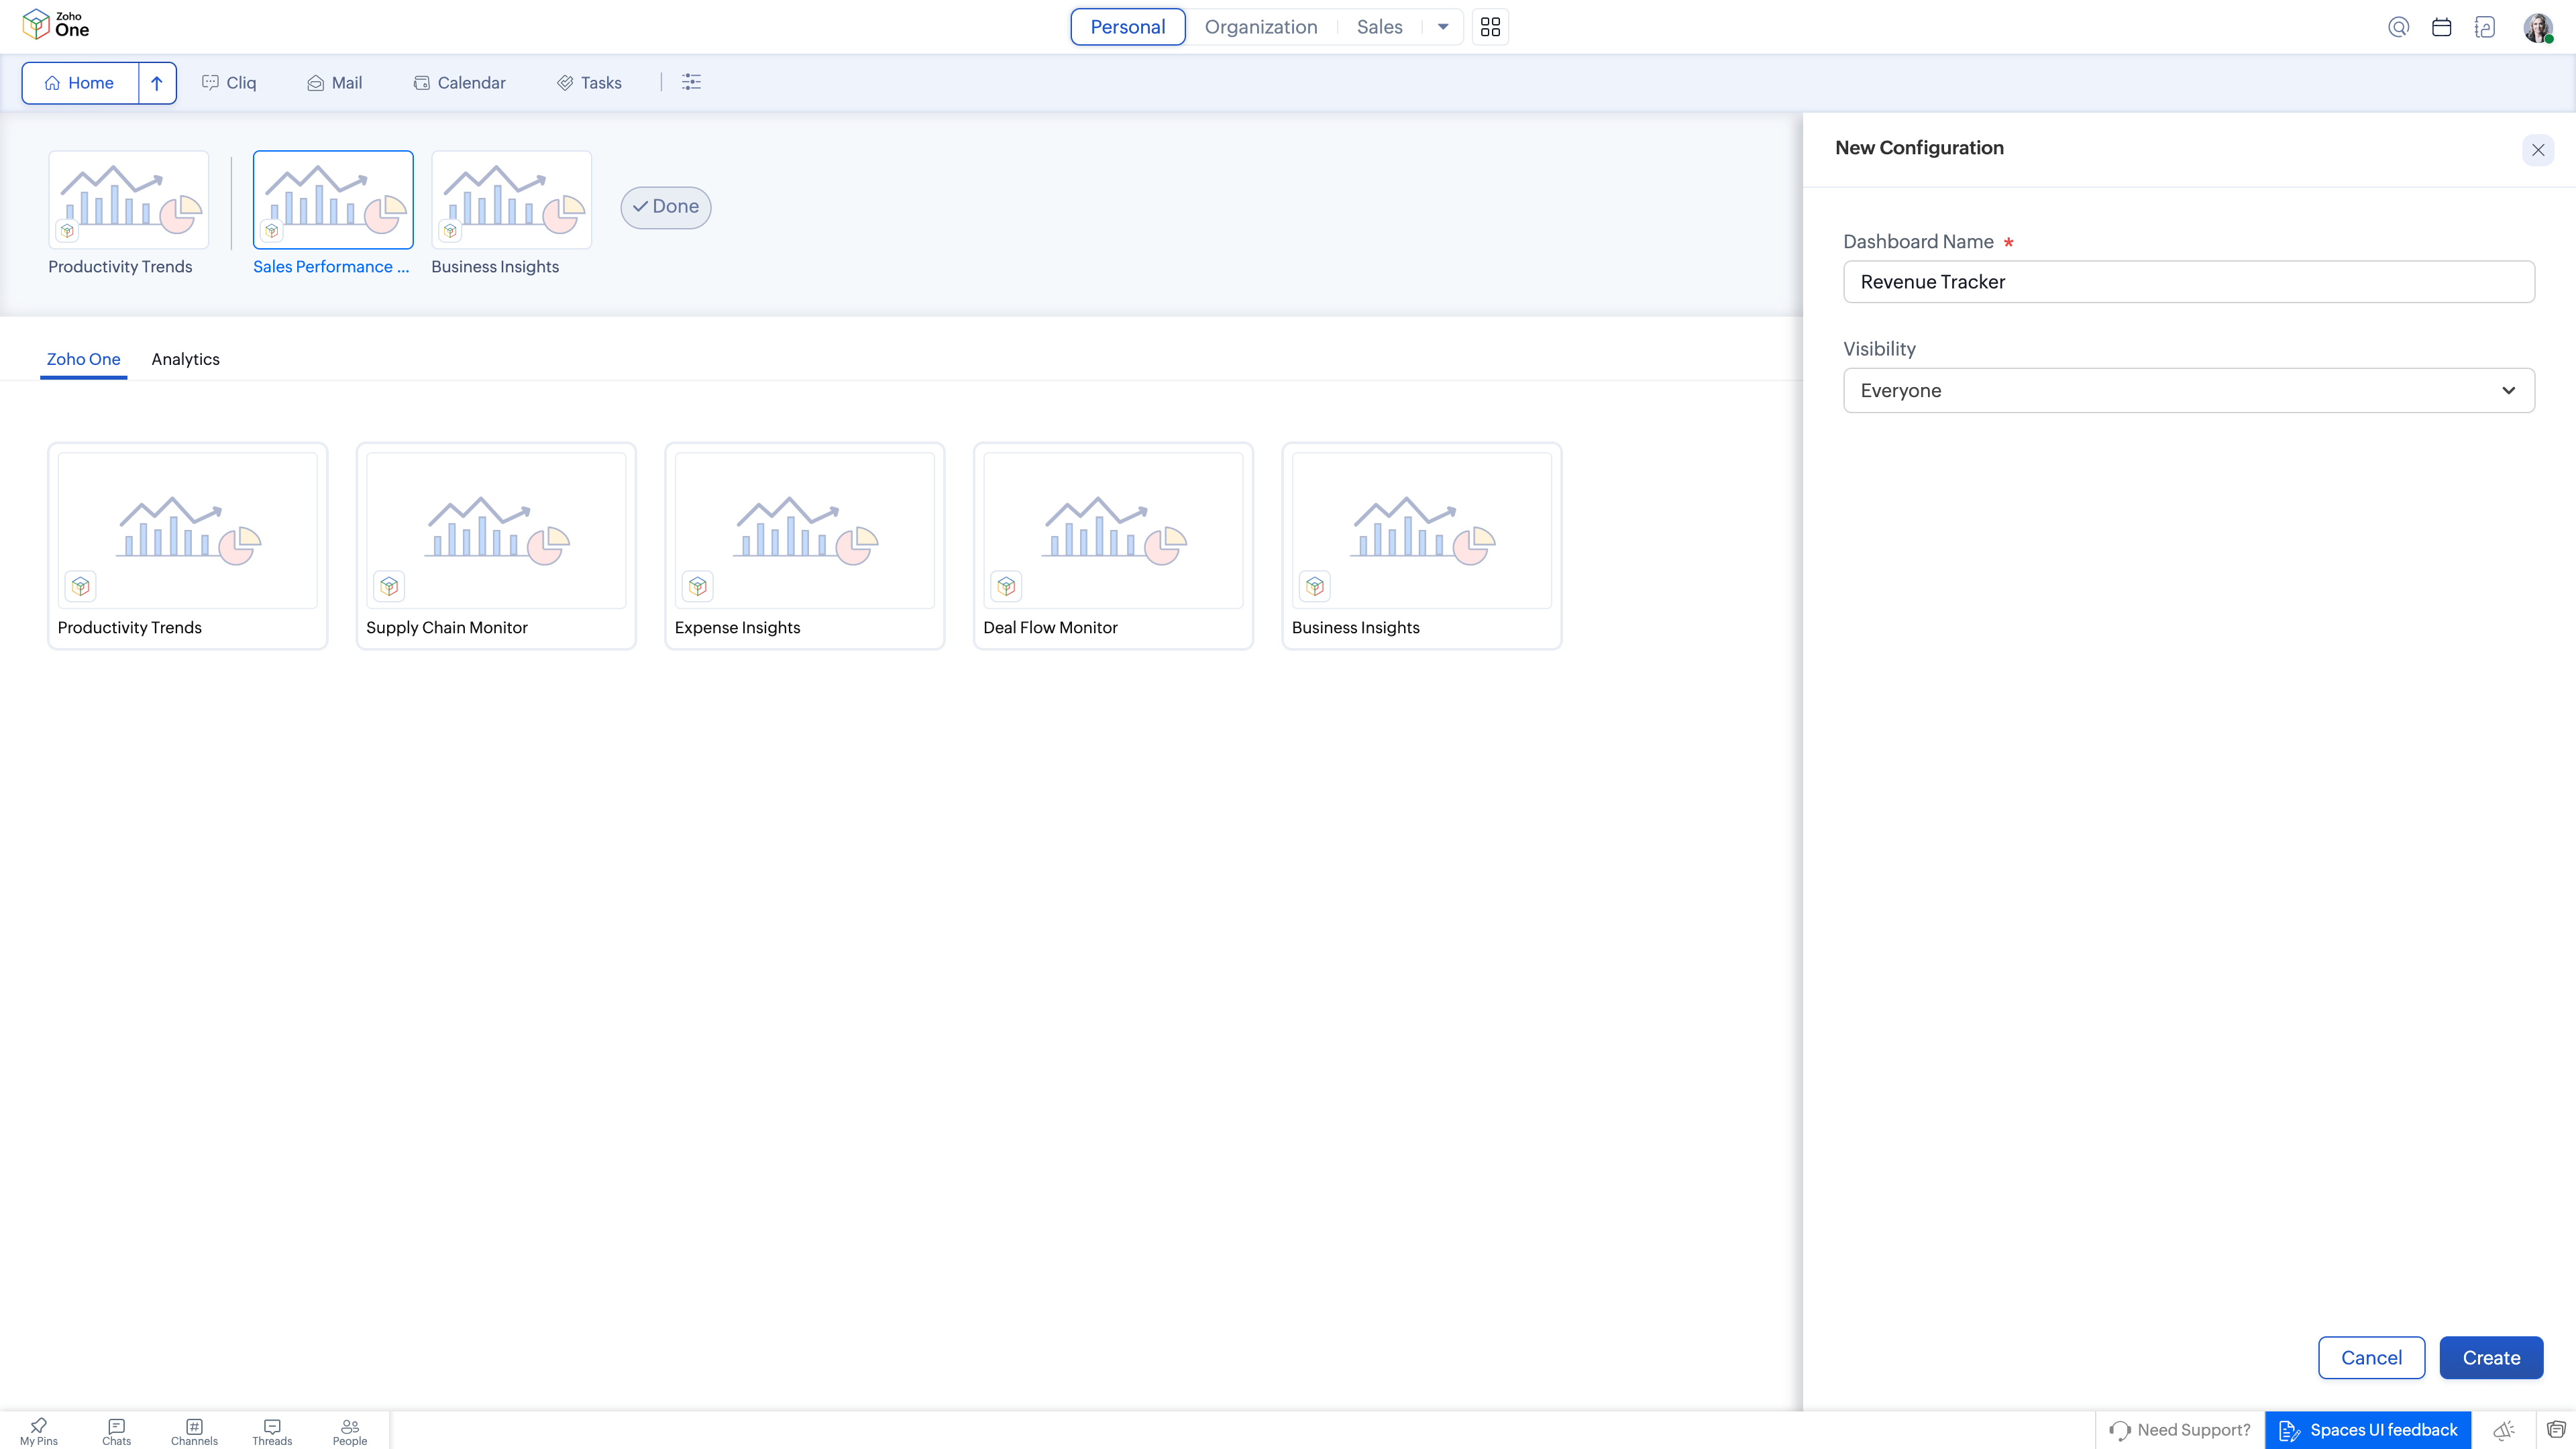
Multiple dashboards for different ways of thinking
Dashboard 2.0 supports the use of multiple dashboards, each serving a distinct purpose. Rather than forcing all information into a single, overloaded view, users can maintain different dashboards aligned with how they review work.
For example, one dashboard may be used to observe long-term trends, another to monitor daily operational rhythm, and another to watch for emerging risks or anomalies. Each view acts as a lens, helping users align what they see with the kind of judgment they are making.
This reduces cognitive strain by separating concerns instead of compressing them.
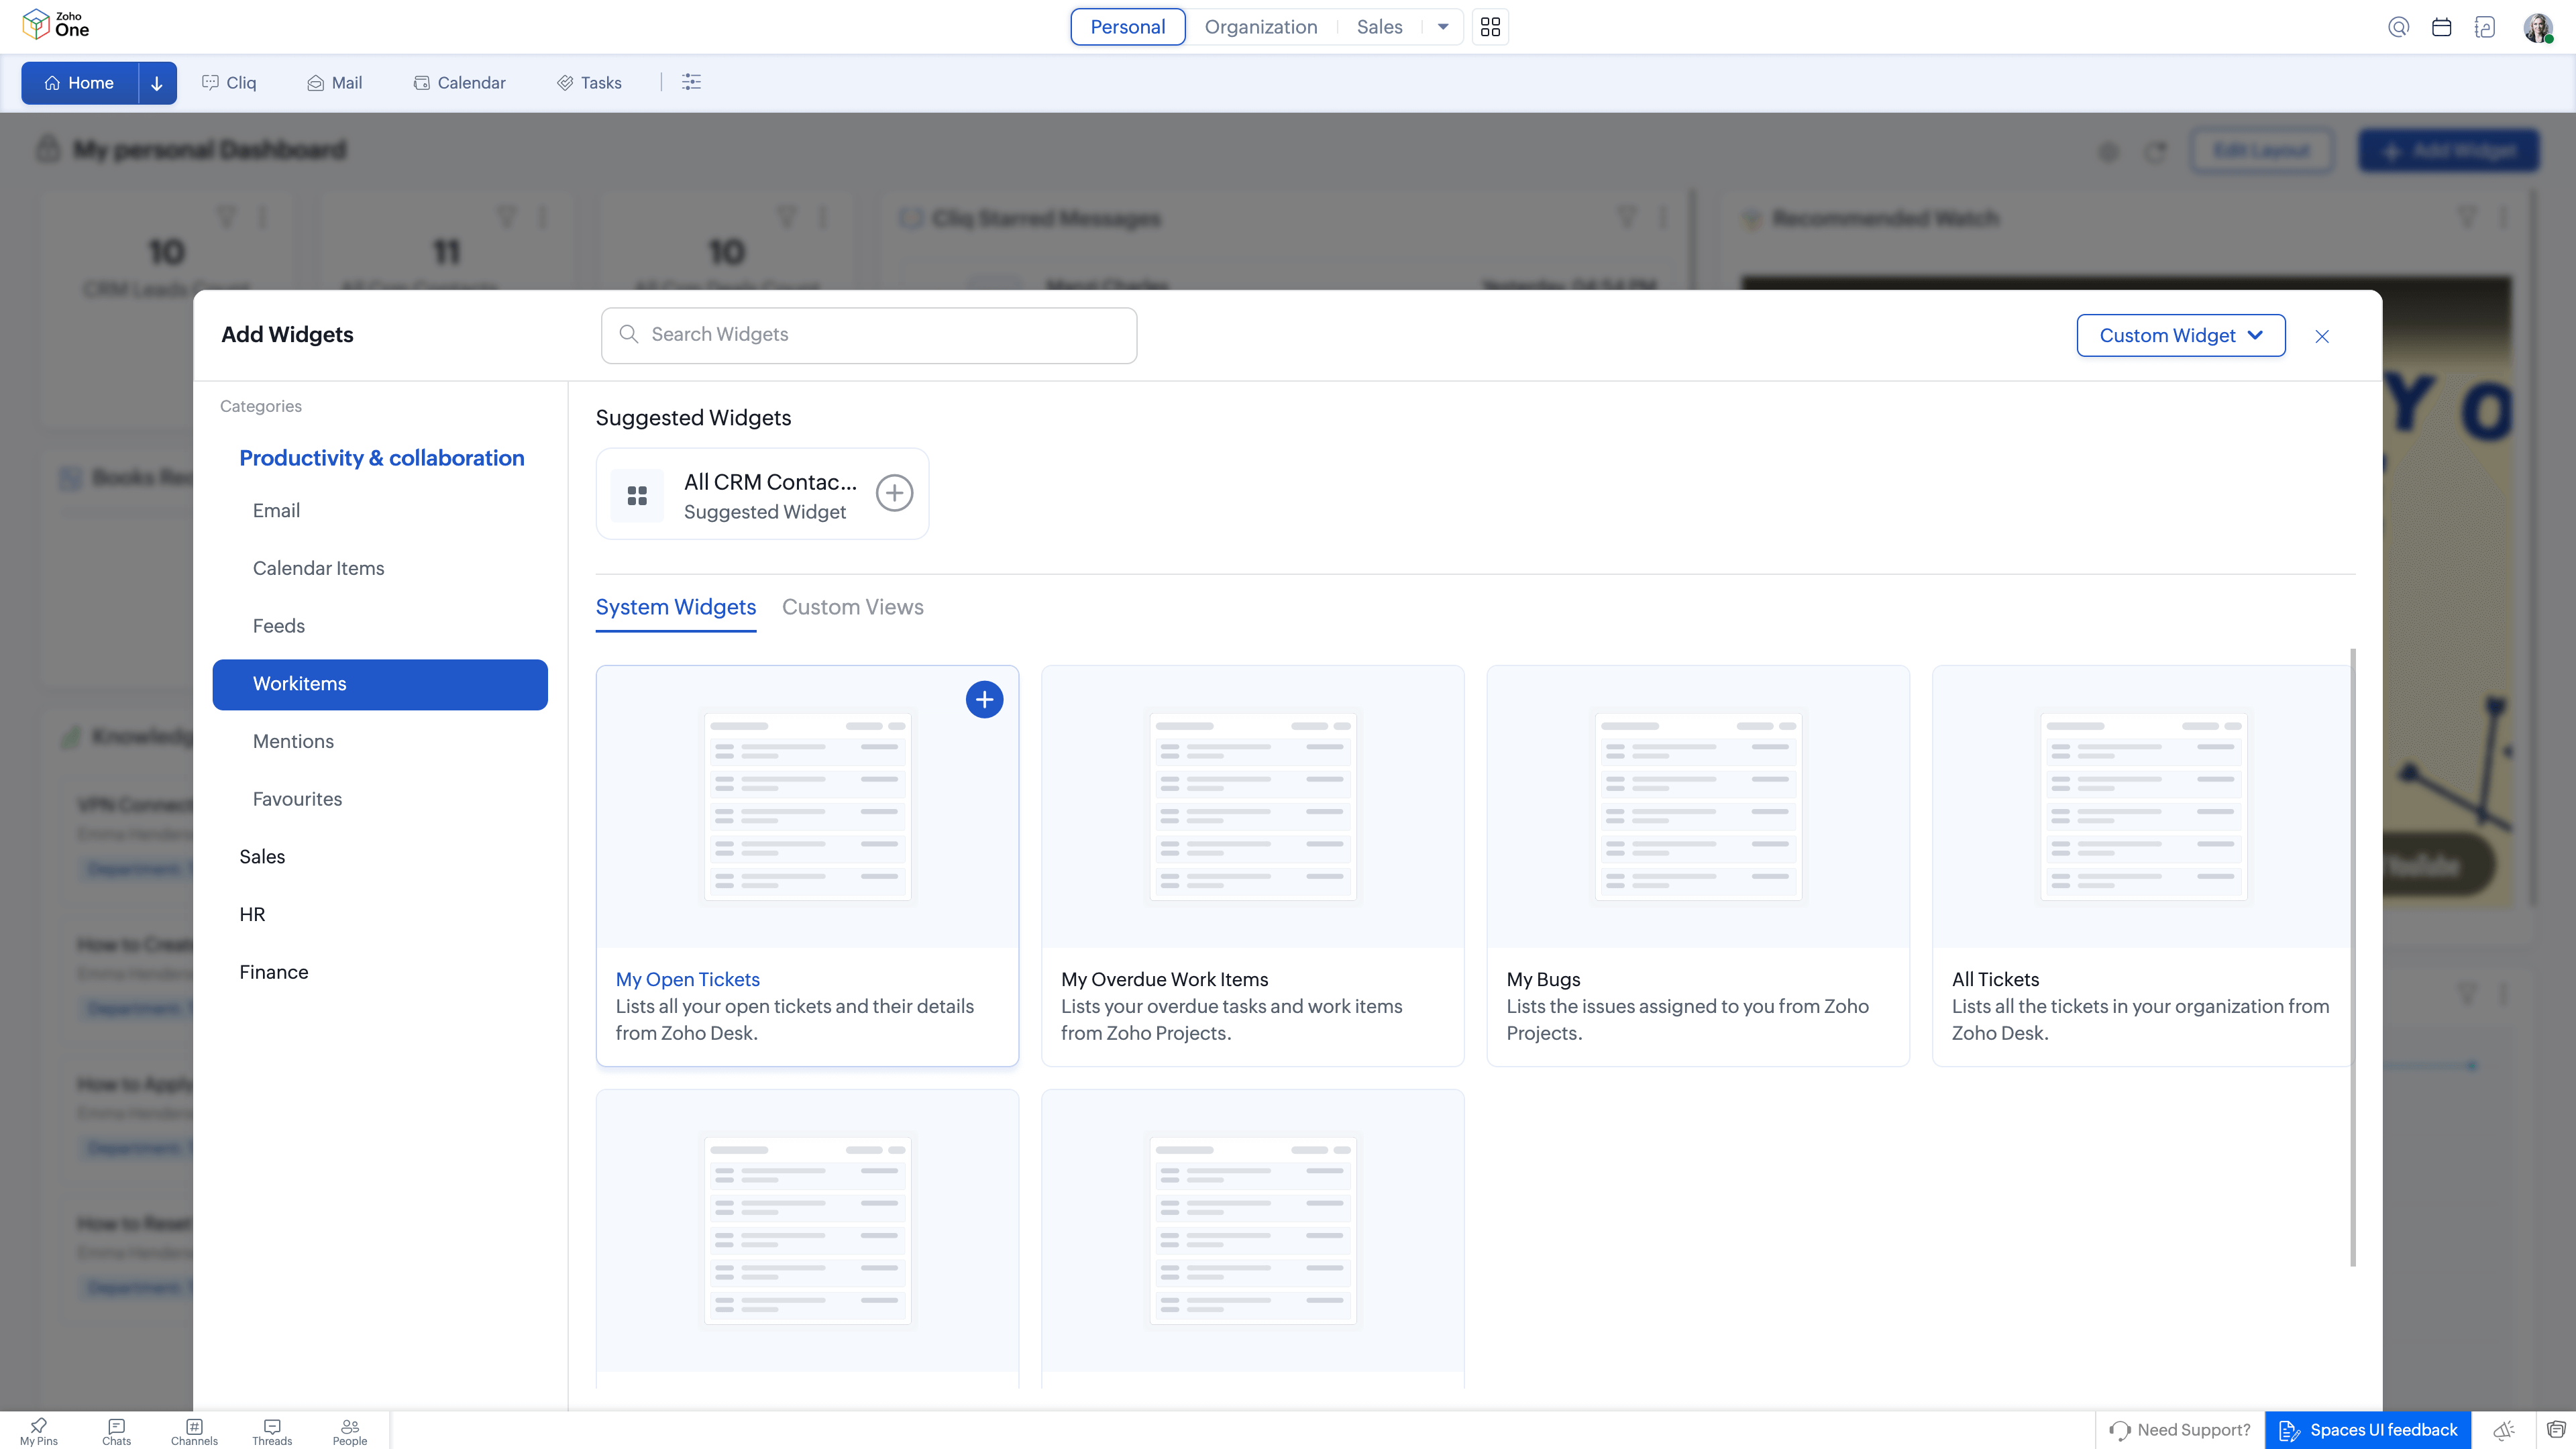
Personalized widgets shaped around relevance
Dashboard 2.0 allows users to compose dashboards using a mix of custom and templated widgets. These include metrics, lists, embedded links, and quick links, which can be arranged based on what a user needs to pay attention to.
Widgets are not treated as generic blocks. They are configured to reflect role-specific priorities. A finance lead may emphasize revenue trends and budget variance, while a project manager may focus on milestones and blockers. The same system supports both without forcing a common layout.
This personalization helps dashboards reflect mental habits rather than impose a single structure.
Embedding dashboards across applications
Dashboard 2.0 supports embedding dashboards sourced from other Zoho applications. For example, dashboards from Zoho Analytics can be embedded directly now.
This allows analytical views to appear alongside operational indicators instead of being isolated in a separate reporting tool. Users can examine trends and performance measures in the same environment where they review tasks, activities, or pipeline data.
The effect is not consolidation for its own sake, but reduced context switching during interpretation.
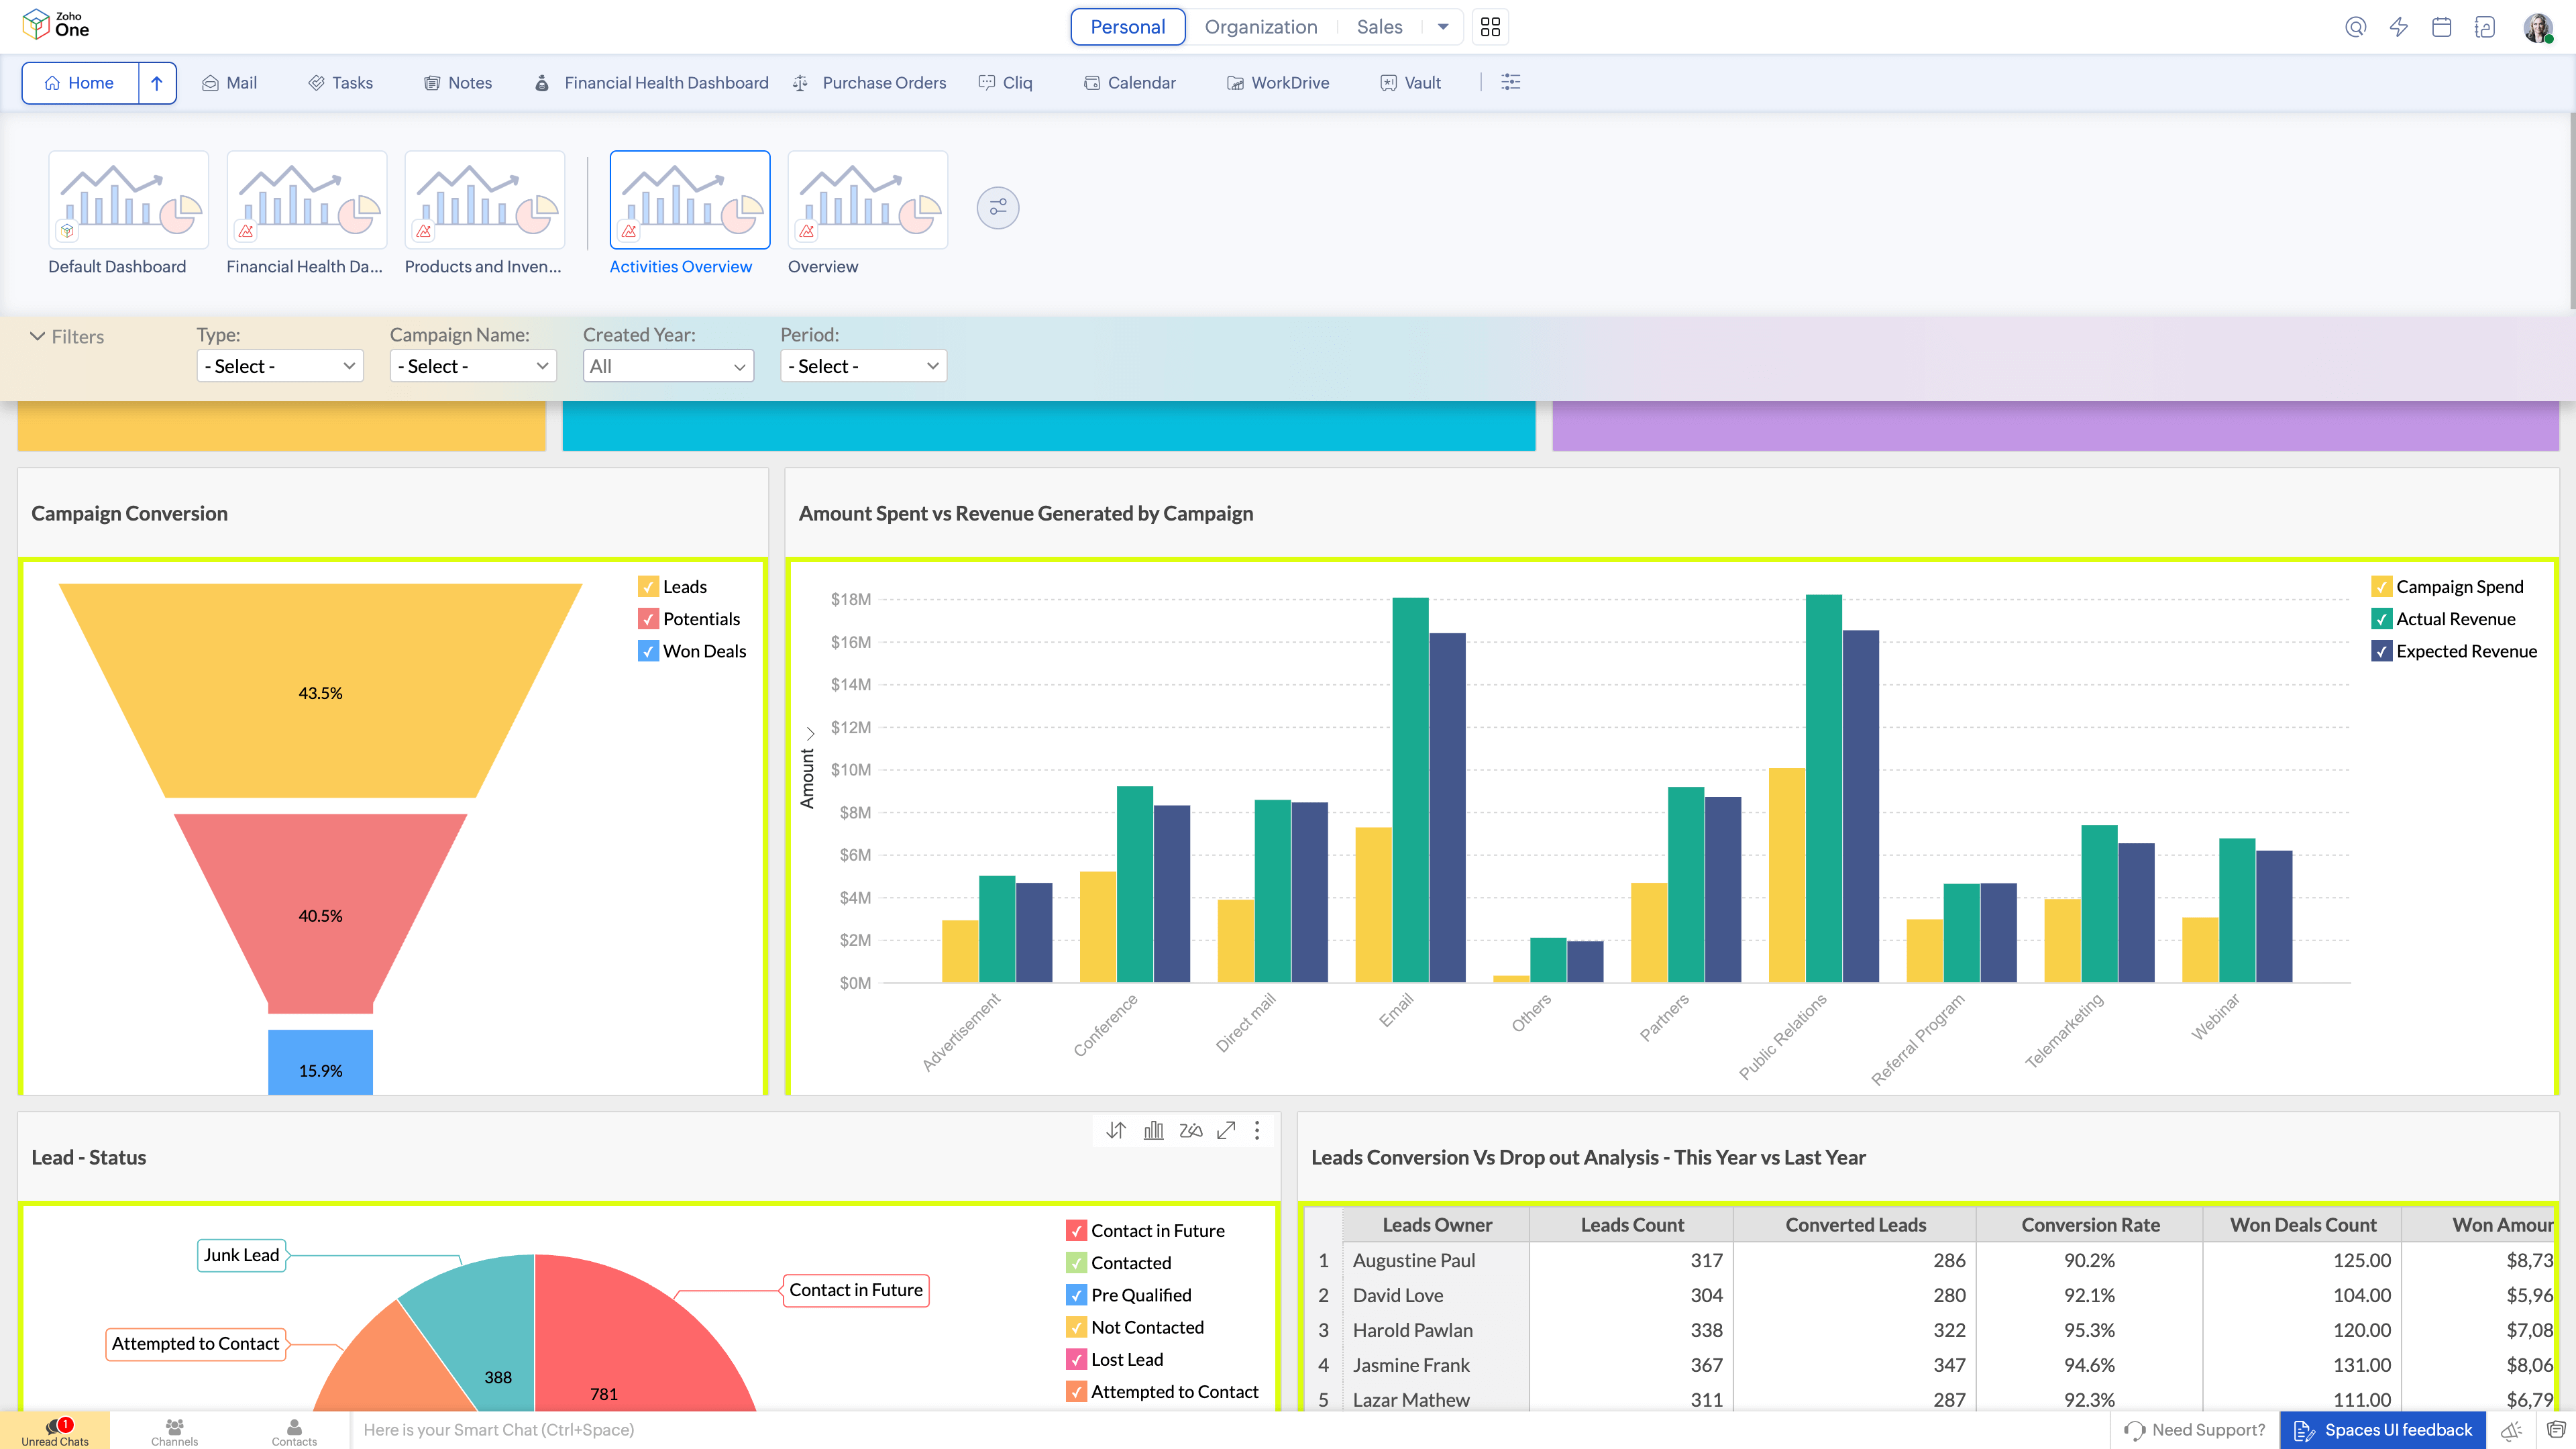
Current state visibility without extra effort
Dashboard 2.0 populates widgets with up-to-date data from across applications such as CRM, Books, Projects, and Desk. Because related indicators appear within the same surface, users are less likely to leave the dashboard to confirm details elsewhere.
This supports reasoning with the current state of work rather than relying on outdated snapshots or manually refreshed reports.
How this changes day-to-day decision making
When dashboards are structured around interpretation, teams spend less time assembling meaning and more time evaluating options.
Meetings can begin with shared views that already reflect the context of the discussion, rather than relying on manually prepared slides. Cross-functional conversations become easier when participants are looking at the same signals, arranged in ways that reflect the question at hand.
Over time, this shortens feedback loops and makes decisions feel more grounded because the information required to understand a situation is already in view.
How Dashboard 2.0 fits into the broader system design
Dashboard 2.0 is part of a broader design direction within Zoho One that focuses on reducing cognitive friction across the work cycle:
Spaces — where work lives
Dashboard 2.0 — how work is seen
Quick Nav — how work moves
Each of these addresses a different aspect of how people engage with complex systems. Dashboard 2.0 concentrates on visibility and interpretation, ensuring that what users see supports how they reason about work.
Why this matters in practice
Dashboards shape behavior by shaping attention. When information is presented in ways that align with real decision contexts, teams rely less on external reports and ad-hoc analysis to understand what is happening.
Dashboard 2.0 shifts dashboards from being places people visit to collect numbers into environments where understanding develops naturally as work unfolds. This supports more confident decision making, clearer conversations, and a better alignment between observation and action.

Comments