
BI portal offers three core functions
- Unified access to connect to existing BI tools and data sources. Your Tableau dashboards, Power BI reports, and custom analytics all appear in one searchable library.
- Smart organization to sort automatically and tag content so users can find what they need through search or personalized suggestions, eliminating the need for manual navigation.
- Controlled distribution that delivers insights through email, mobile apps, Slack, or embedded within applications ensuring teams receive analytics within their workflow instead of searching for them.
TL;DR
- A BI Portal is a centralized layer that brings together dashboards, reports, and analytics from multiple BI tools into one governed experience
- It shifts the focus from creating reports to understanding how analytics are organized, accessed, and used across the enterprise.
- Enterprises adopt BI Portals to solve fragmented BI system, inconsistent KPIs, low analytics adoption, and rising governance and compliance challenges.
- Key capabilities include unified access to analytics, certified data models, role-based security, self-service exploration, automated insights, embedded analytics, and AI-assisted analysis.
- A BI Portal standardizes KPIs, makes insights easy to discover, and deliver analytics directly into everyday workflows.
- The result is faster decision making, higher BI adoption, reduced analyst workload, and stronger ROI from existing business intelligence investments
Why enterprises need a BI Portal in 2026?
Enterprises are generating more data than ever, yet access to meaningful insights remains limited. While analytics investments continue to grow, leaders still face challenges due to fragmented systems, inconsistent metrics, and weak user engagement.
Choosing the right business intelligence BI software is critical for enterprises looking to consolidate their analytics infrastructure and drive data-driven decision-making across all departments.
By 2026, the challenge isn’t having analytics tools. It’s making analytics usable, trusted, and actionable at scale.
Fragmented BI ecosystems
Most enterprises typically run multiple BI and analytics tools across team, such ah sales using Salesforce dashboards, marketing relying on Google Analytics, finance depending on ERP reports, and operations using custom tools like Tableau. This leads to fractured data views and inconsistent reporting methods.
For instance, when different departments interpret key metrics like customer value or revenue metrics differently, it causes delays in quarterly reviews. In fact, data silos remains a top BI challenge for 41% of analytics teams, even as BI usage expands.
These siloed systems also mean analysts are spending excessive time stitching data sources together instead of generating insights, slowing down alignment across functions.
Difficulty finding the right insights
Reports and dashboards exist, but they're hard to find. Teams frequently recreate existing analytics due to locating the right dashboard on time.For example, a finance manager looking for a sales forecast might spend time navigating several BI tools and spreadsheet files before finding a report created by another team weeks prior.
This inefficiency in accessing information slows down decision-making. This drag on decision workflows is consistent with broader industry patterns, where 78% of enterprises have at least one BI platform, yet only a small fraction of employees actually use them regularly.
The result is a growing volume of ad-hoc requests, long turnaround times from analytics teams, and decisions made without timely visibility.
Inconsistent and untrusted metrics
Without standardized definitions and consistent certification process for metrics, various teams may derive contradictory results from the same data like "active customer", 'revenue', and "churn rate". These discrepancies erode confidence and stall decision.
For example, when a sales plan depends on "customer lifetime value", but finance uses a different calculation, leaders might postpone investments until the metrics are aligned. Studies reveal that data quality and completeness are consistently identified as major obstacles to successful business intelligence. by a majority of enterprise data leaders.
This lack of uniformity weakens confidence in analytics, causing teams to revert to spreadsheets or personal judgment, which worsens data fragmentation.
Poor return on BI investments
Despite spending heavily on BI platforms, enterprises often see low adoption and ROI. Simply investing in BI tools does not guarantee broad usage or tangible business outcomes. While adoption of BI is on the rise, employee engagement remains low, with many organizations finding that only a small portion of their workforce regularly uses these systems.
As a result, costly BI solutions often go underutilized, and valuable reports accumulate without driving decisions - a classic example of investing in technology without solving the underlying access and adoption problem.
Rising governance and compliance pressure
As data access expands, so do risks. Uncontrolled data access, exports, and sharing expose organizations to compliance failures and security breaches.
As analytics access expands beyond traditional BI teams, the risks associated with data mishandling and compliance violations grow. Uncontrolled data access, exports, and sharing expose organizations to compliance failures and security breaches.
Industry insight says that poor data quality carries a heavy price. Organizations face average breach costs in the millions, and compliance failures like GDPR penalties can exceed €1.78 billion in a single case,underscoring the importance of robust data governance.
In highly regulated industries such as finance and healthcare, weak governance not only leads to fines but reputation damage as well.
What's different in 2026
- Data sources have multiplied across Saas apps, cloud, and internal data sources
- Analytics becomes a daily requirement for every role - not just analysts
- AI-driven insights depend on centralized and governed analytics foundations
- Leaders expect faster decisions, not static reports or delayed insights
The role of a BI Portal
A BI Portal addresses these challenges by acting as a single, governed layer for enterprise analytics, bringing structure to complexity.
It enables organizations to:
- Centralize dashboards and reports across tools
- Enfore consistent, trusted metrics
- Improves discoverability and adoption
- Delivers insights directly into user workflows
- Balances self-service analytics with governance and control
Imagine a large enterprise with multiple departments such as sales, finance, marketing, and operations, each relying on their own analytics tools and reporting systems.
Before a BI Portal:
Ahead of a quarterly business review, the CFO asks for updated revenue and forecast numbers. Finance extracts data from ERP systems, sales shares from a BI reporting tool, and marketing presents pipeline insights from a separate BI tool. While each team trusts their own data, the figures don't align. Analysts spend days reconciling metrics, validating calculations, and addressing additional queries. As leadership finally settles on a consistent set of numbers, critical decisions are delayed and opportunities are already slipping.
After a BI Portal:
With a BI Portal in place, the same data review appears dramatically different. Executives, department managers, and analysts all use a unified enterprise analytics platform. Key metrics like revenue, sales pipeline, churn, and performance metrics are already standardized and verified. Each leader views the same business dashboards, filtered to their role, with the ability to drill down when needed. Questions are answered instantly, not through back-and-forth emails, and decisions are made in real-time based on trusted, shared data.
This transition from disjointed analytics to a centralized, organization-wide approach, fundamentally transforms how companies make decisions.
A detailed comparison: Before vs After a BI Portal
| Aspect | Before a BI Portal | After a BI Portal |
|---|---|---|
| Analytics Access | Analytics scattered across multiple BI tools and departmental systems with no central hub | Single, unified portal consolidates all enterprise analytics in one searchable location |
| Metric Consistency | KPIs vary by team and tool, causing constant validation conflicts and reporting delays | Standardized, certified metrics used consistently across all BI reporting and business dashboards |
| Decision Speed | Decisions delayed by fragmented insights, manual data gathering, and reconciliation efforts | Real-time access to trusted insights enables faster, confident decision-making |
| Analytics Adoption | BI usage limited to analysts and power users; low enterprise-wide engagement | Self-service analytics accessible across all roles, driving organization-wide adoption |
| Governance & Security | Uncontrolled data exports and ad-hoc sharing increase compliance and security risks | Centralized access controls, audit trails, and role-based security ensure compliance |
| ROI on BI Investment | High BI costs with underutilized tools and uncertain business impact | Maximum ROI through increased adoption, efficiency, and reuse of existing analytics assets |
Employee adoption: BARCS's studies shows the percentage of employees actively using BI/analytics tools is currently 24% on average, reflecting minimal growth in the past seven years.
What to look for while evaluating a BI tool
When evaluating BI Portal dashboard software , enterprises should look beyond traditional analytics and prioritize analytics that supports enterprise-wide access, governance, and real decision-making. A BI Portal that is easier to access, easier to trust, and easier to act on. The following capabilities define what enterprises need from a BI Portal to support real decision-making at scale.
Selecting business analytics software requires evaluating not just reporting capabilities, but also governance features, integration flexibility, and the ability to support diverse user personas across the enterprise.
Single access point for enterprise analytics
A BI Portal must act a single access point for analytics across departments and tools. With structured reporting, defined ownership, and advanced search capabilities, users can quickly locate the right insights without navigating multiple platforms or rebuilding existing reports.
Why it matters: This saves time spent searching and allows users for more in-depth analysis.
Unified data integration and blending
Companies use a variety of SaaS platforms, databases, spreadsheets, and internal systems. A BI Portal connects to these sources, automatically cleans and structures the data, and enable unified, cross-functional analysis in one place.
Auto data blending capabilities eliminate manual data preparation work by automatically joining and harmonizing data from multiple sources, enabling analysts to focus on insights rather than data wrangling.
As enterprises manage big data from diverse sources, a BI Portal must handle large-scale data processing while maintaining performance and enabling real-time analysis.
Why it matters: This allows business questions to be answered with complete, connected data rather than fragmented datasets.
Governed data models and certified metrics
A BI Portal establishes standardized metrics using centralized data models and certification workflows. Teams can see how KPIs are derived and obtained, ensuring uniformity in reporting and business dashboards.
Why it matters: This fosters trust while enabling controlled self-service exploration.
Role-based access and personalization
Different users need different views, but from the same data foundation. A BI Portal delivers personalized views based on user roles while implementing precise access restrictions.
Why it matters: Sensitive data remains protected, and analytics stays accessible to the right users at the right time.
Self-service analytics for business users
A BI Portal empowers business users to create dashboards, reports, and drill into metrics without relying on analysts. Interactive data exploration with drag-and-drop interface speeds up decision-making and lessens the workload on data teams.
Why it matters:Teams move faster by answering follow-up questions on their own.
Automated insights and alerts
Insights should reach users when action is needed, not just during routine checks. A BI Portal enables scheduled reports delivered via email or in-app notifications, alerts triggered by thresholds, and mobiles access, helping teams respond to changes early, even before problems worsen.
Why it matters:Analytics should be available to users when it matters. Not only during reviews.
Embedded and shared analytics
A BI Portal enhances analytics beyond internal teams by supporting secure sharing and embedded analytics. Dashboards can be integrated into internal tools, customer portal, or external applications, while sharing with external stakeholders is secure.
Why it matters:Analytics becomes more valuable when it's a part of everyday workflow.
AI-assisted analysis and natural language analysis
As data volume increases, manual exploration alone is no longer enough. A BI Portal enables users to ask questions in natural language and get instant insights, automatically identifies trends, anomalies, and provides contextual explanation that help interpret results.
Beyond standard reporting, advanced analytics capabilities like predictive modeling, statistical analysis, and trend forecasting help organizations move from descriptive insights to prescriptive recommendations.
Why it matters: Users spend less time analyzing and more time deciding.
Key takeaway
A BI Portal is not defined by dashboards alone. It is defined by how effectively it centralizes analytics through:
- robust data analytics software
- Enforces consistency
- Enable self-service
- Delivers insights in context
These features combined determine whether analytics becomes an everyday business asset or remains underused.
Zoho Analytics: BI Portal for your enterprise needs
Zoho Analytics helps enterprises to centralize and govern their analytics within a single unified BI platform that supports decisions across teams, roles, and business function, without adding operational complexity. Instead of being just another BI tool, it brings structure, consistency, and automation to how analytics is accessed and utilized throughout the organization.

"Zoho Analytics has essentially become the front door to all our applications. It’s where everything connects and where we make sense of what’s happening across the business."
 Dr. Mohan Babu MurugesanCEO, Bits Secure IT InfrastructureRead more here
Unified data integration across every source
Zoho Analytics connects to more than 500 native data sources including databases, files and feeds, custom apps, and third-party tools, making it easier to standardize BI reporting across finance, marketing, operations, and leadership teams. Data from ERP systems, CRM platforms, spreadsheets, and cloud applications can be prepared, blended, and refreshed automatically, cutting down on manual work and speeding up reporting.
This creates a single source of truth for cross-functional insights, including finance BI and operational reporting.
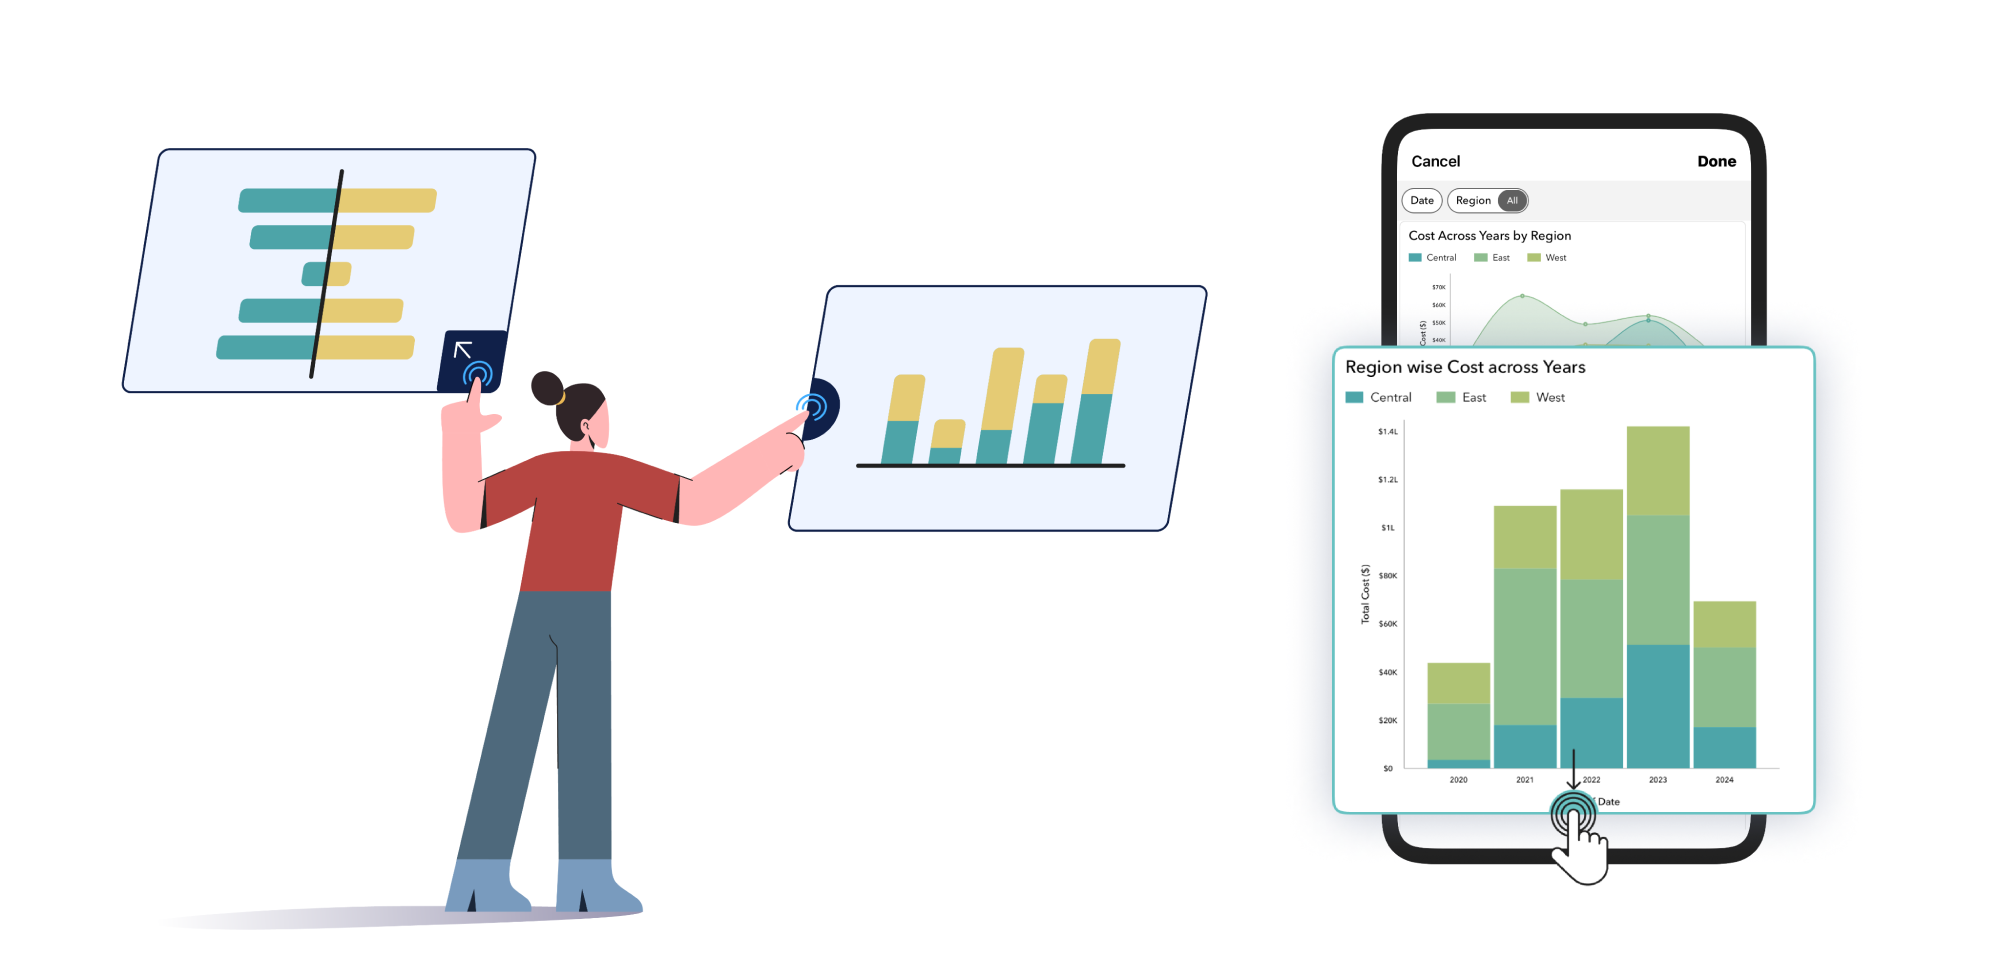
Business dashboards for every role
Teams use data in different ways. Zoho Analytics allows enterprises to create customized dashboards for every user group, while staying on the same data foundation. From executive KPI dashboards to department specific views for finance, sales, and operations, and secure access for partners or customers, each dashboard is aligned with role-based analytics and data security.
This approach drives greater adoption by ensuring analytics are directly relevant to each user's needs.

Self-service reporting without losing governance
Business users can analyze data on their own without interfering with standard reporting processes. Thanks to certified datasets, reusable data models, intuitive reporting tools, and controlled sharing with version management, users can now answer follow-up questions on their own without redefining metrics.
This reduces dependency on analytics teams while maintaining trusted metrics.
Advanced data visualization with built-in AI
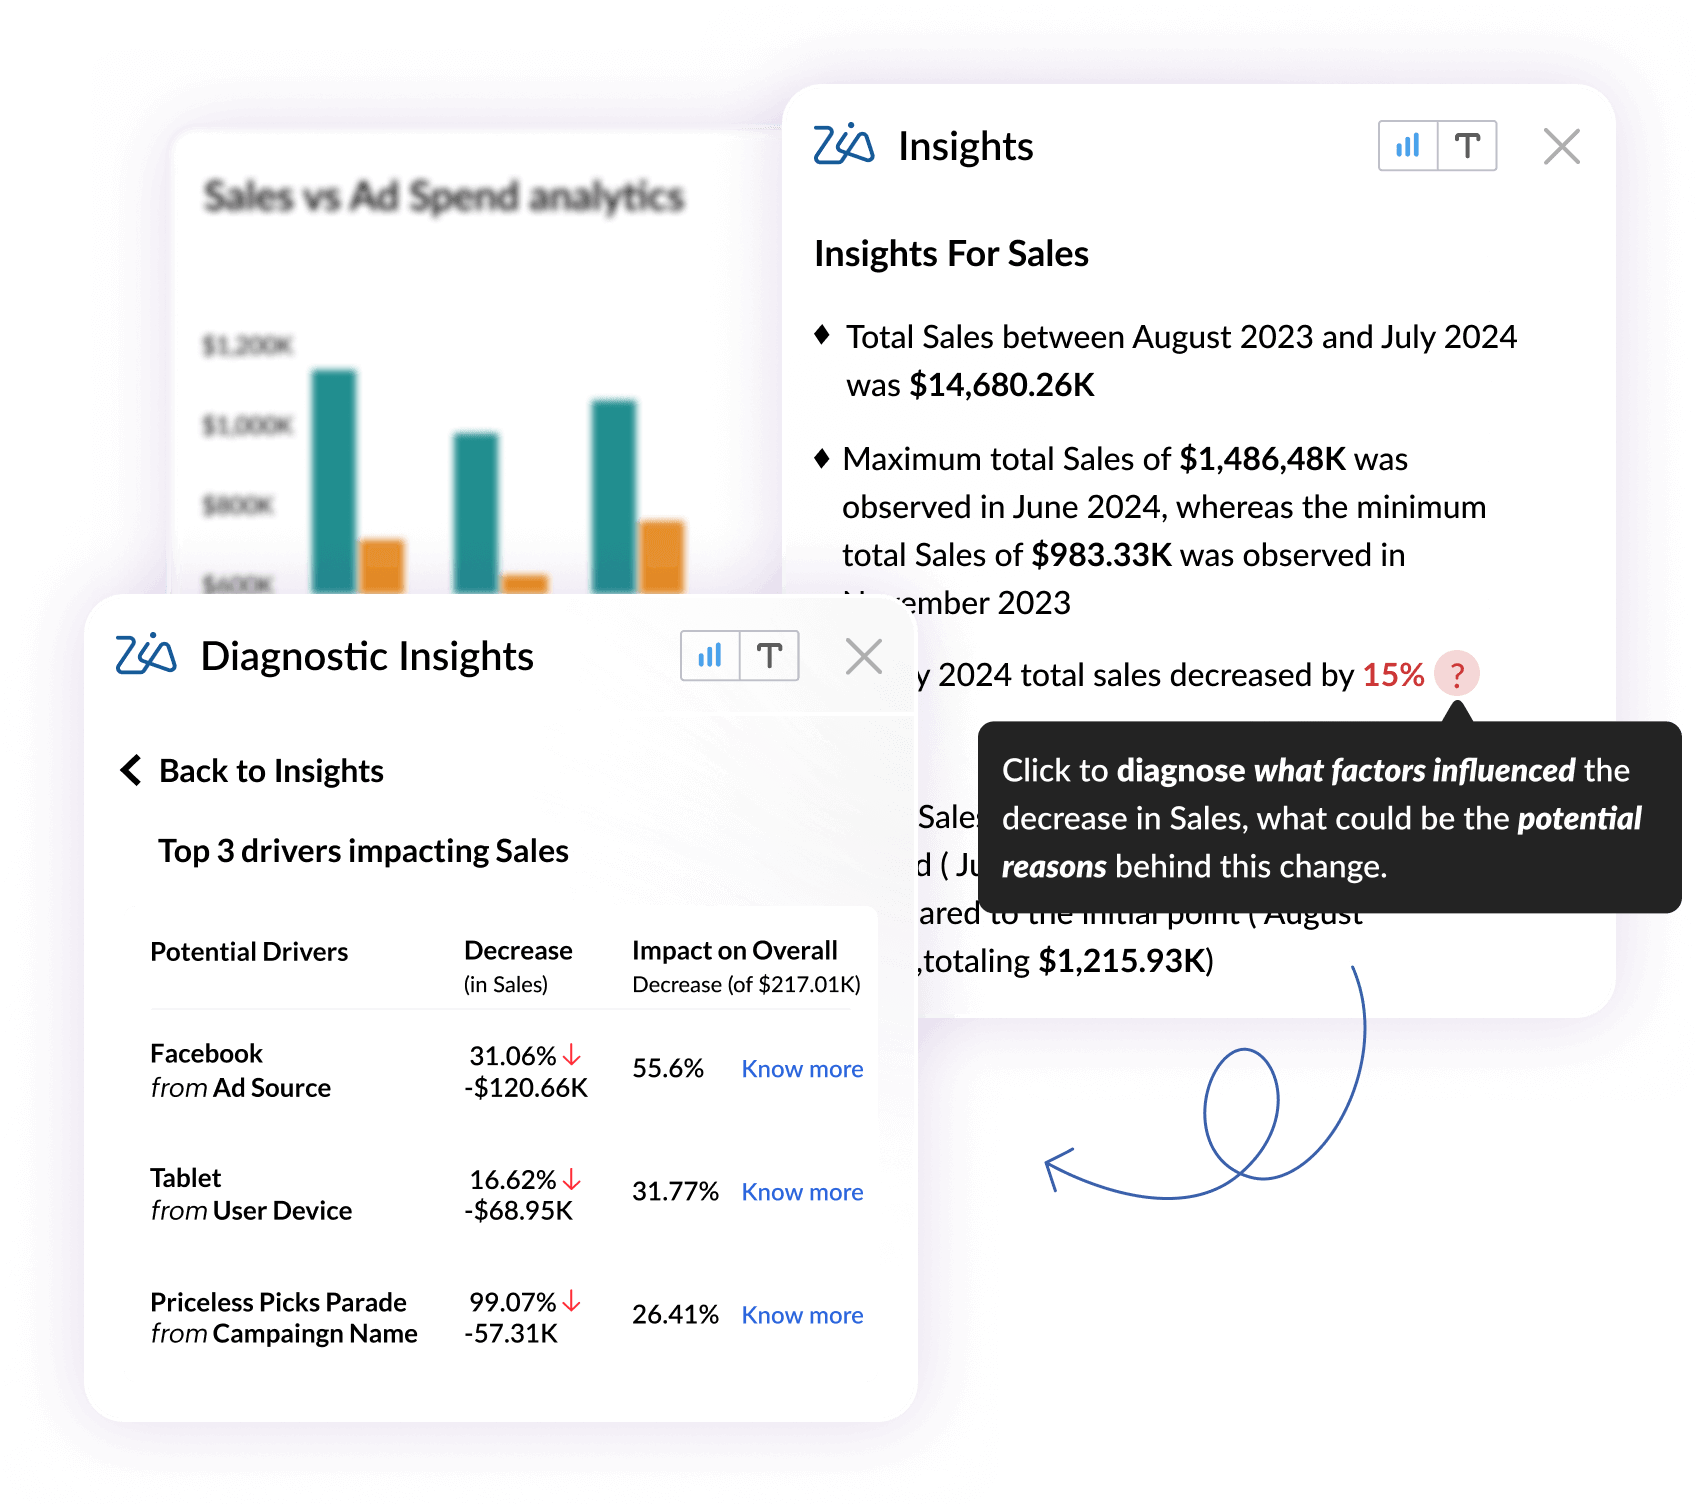
Zoho Analytics combines powerful data visualization software by leveraging AI-powered analysis to simplify insight interpretation. Users can ask questions in plain English and generate reports and dashboards automatically. Zia, the assistant, highlights trends, anomalies, and contributors to performance changes, all without requiring SQL, or modeling skills.
This delivers an intuitive and accessible data visualization experience that helps users understand not just what's happening, but why.
Deliver insights proactively through automation
Zoho Analytics ensures insights are delivered proactively through BI reporting workflows, enabling users get insights exactly when they're needed. With email-based scheduled reports, threshold-based alerts for key metrics, and mobile access for real-time visibility. Business intelligence shifts from static dashboards to dynamic decision support.
This enables faster, more timely actions driven by automated reporting.
Embed analytics into everyday business tools
Zoho Analytics allows enterprises to embed interactive dashboards into their internal system of customer-facing applications. These dashboards can be white-labeled and secured, while expanding analytical capabilities beyond the BI team.
This integration enables businesses to integrate analytics directly into workflows using enterprise-grade business intelligence software.

Built for enterprise governance and security
Zoho Analytics is built to fulfill enterprise security and compliance needed, featuring role-based access controls, row-level security, data masking, and comprehensive audit logs. These controls supports broad analytics options while maintaining strong compliance safegaurds.
This allows organizations to scale analytics confidently across departments.

Transparent, scalable pricing
Zoho Analytics offers pricing based on the number of users and data volume, making it ideal for businesses of all sizes. There are no hidden fees for reporting or dashboards, seamless scalability across teams, and a free 15-day trial available for evaluation.
This results in a lower overall cost compared to traditional BI platform, without compromising functionality.
Conclusion
Most enterprises don't struggle because they lack data or BI tools. They fall because insights are scattered, metrics aren't consistent, and difficult to access at the moment decisions are needed to be made.
A BI Portal solves this gap by bringing analytics into a single, governed experience, enforcing consistency, and delivering insights directly into business workflows. It replaces ad-hoc reporting with clarity, consistency, and speed.
Zoho Analytics makes this shift practical by combining unified BI reporting, governed self-service, AI-assisted insights, and flexible deployments in a single platform, making decision-making easy across leadership, finance, operations, and teams on the ground.
What to do next
- Start a 15-day free trial to connect your data and build your business dashboard
- Request a demo to see how Zoho Analytics fits into your current BI environment
- Speak with our team about enterprise deployments, governance, and pricing plans.
Zoho Analytics - A BI Portal made easier to access, easier to trust, and easier to act on.
Frequently asked questions
What is a BI portal?
- A BI Portal is a unified analytics platform that brings together business dashboards, reports, and data visualizations in one single tool. It eliminated confusion caused by scattered tools and ensures everyone works from the same data.
How do BI portals help with reporting?
- A BI portal simplifies BI reporting by organizing reports, standardizing KPIs, and enabling self-service access, so teams spend less time searching and more time acting on data. This helps organizations maintain consistent reporting across finance, operations and leadership teams.
How does a BI portal save analysts' time?
- A BI portal eliminates duplicate report creation and manual data checks and frees analysts from maintenance tasks and allows them to focus on analysis and strategic insights. It also reduces ad-hoc report requests by enabling users to explore data independently.
Why should you invest in a BI portal?
- A BI portal increases analytics adoption, improves data confidence, and maximizes the value of reporting software across the organization. Over time, it becomes the foundational layer for data-driven decision-making across the organization