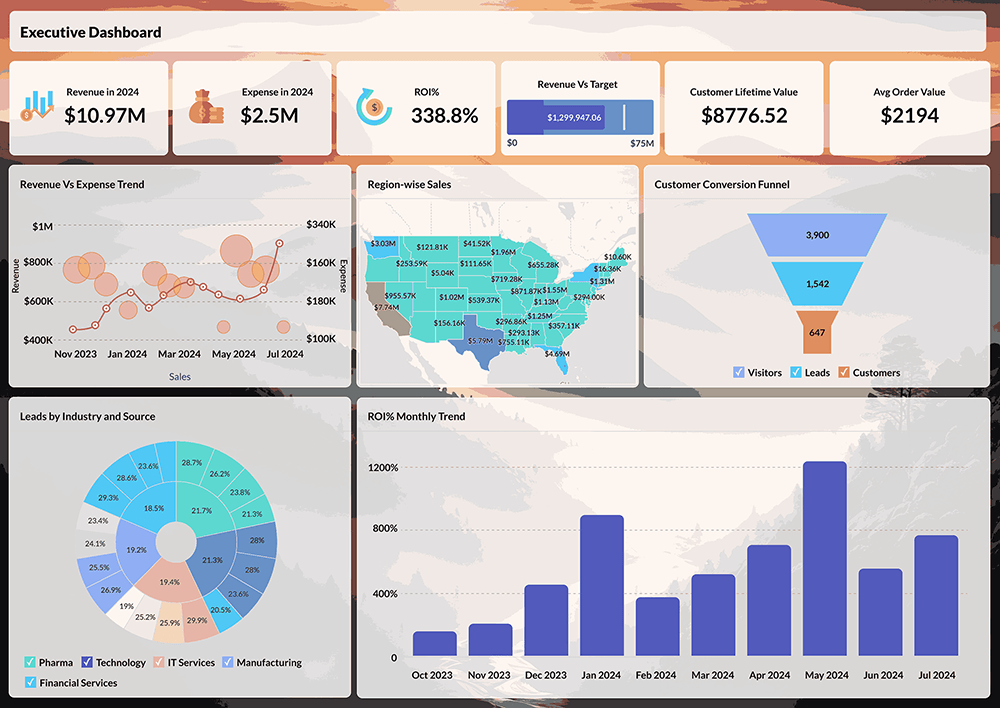
In-depth CRM analytics to help you make smarter business decisions
From lead analytics to deal insights, activity stats, and email analytics, Zoho CRM's advanced analytics help you monitor every aspect of your sales cycle. Create customized dashboards with analytical widgets for sales, such as charts, target meters, KPIs, and funnels. Make data-driven decisions with customizable reports, and boost your sales success with actionable data intelligence.
Sign Up For Free- SALES ANALYTICS
- Why Analytics?
- Customizable Reports
- Charts
- Anomaly Detector
- Cohorts
- Quadrants
- KPIs
- Comparator
- Funnels
- Target Meter
- Zone maps
- Capabilities
Get visual answers from your data
Zoho CRM Analytics empowers everyone in your organization to make data-driven decisions. This includes your C-level employees, management, and sales representatives.
Blend your CRM data in multiple ways to understand the underlying trends. Bring together CRM data from leads, contacts, campaigns, tasks, vendors, quotes, and much more.
Powerful filtering options help you sift through your data. Filter your data using criteria based on modules, for example - if you are analyzing deals module, you can drill down based on deal type, deal stage, sales cycle duration and so on.
Export your reports as Excel, CSV, or pdf files. Share your Dashboards with people who need access to them. Embed them into your website or share them on your Slack Channel.
Choose which chart type works best for visualizing your data from a list of predefined templates.
Drill deep into your sales data with customizable reports
Real-time reporting gives you insight into a variety of metrics such as sales trends, marketing campaigns, activity reports, and team performance.
Learn more- Standard Reports
- Custom Reports
Standard Reports
Choose from a wide variety of pre-built reports to get a quick look at your sales health. This includes lead reports filtered by source, status, and ownership—deal reports filtered by stage and status—as well as activity reports, forecasts reports, and much more.
Custom Reports
Create multiple reports, such as matrix, summary, and tabular reports across multiple modules. Apply advanced filters to drill down into your data and get the information you need.
Tell persuasive stories with powerful charts
From pie charts to heat maps, start seeing your everyday sales metrics in the most visually engaging way. Bypass the hassle of analyzing huge volumes of data with a simple, visual representation of your CRM data. With a range of chart styles to choose from, you can create a chart from an existing report, or create one instantly without the need to select a report.
Learn moreKnow where your business stands
You shouldn't have to manually track individual sales parameters, such as the number of leads created per month and the number of deals closed daily. Our AI-powered Anomaly Detector widget compares your actual sales performance with the predicted trend, and lets you know where there were any deviations from the projected sales pattern.
Learn moreAnalyze your time-based sales metrics with cohorts
Break down different aspects of your business into cohorts and analyze their behavior over a set duration of time. Does the lead source of a customer affect their retention period? Who are your best performing sales reps based on the lifetime value of their customers? Cohort analysis groups your sales data and gives answers to all these questions and more.
Learn moreDetermine correlations between different metrics with quadrant analysis
Effortlessly compare and correlate your different metrics, like the number of deals closed vs the revenue of each deal, and identify your best sales reps with quadrant analysis. Compare the sales of different products with the costs they incur to identify which ones bring you the most profit. You can compare and connect different variables in your sales data to identify which areas of your business are doing great and which ones need more focus.
Learn moreDon't ignore your KPIs
From a scorecard that follows top deals to a dashboard that monitors current growth indices, Zoho CRM's KPIs give you a complete picture of the essential sales figures so that your team can identify and concentrate on the areas that need improvement.
Learn moreStart selling smarter,
better and faster
Sign Up For FreePLANS AND PRICINGCompare and contrast
Compare a variety of metrics across multiple modules, such as users, teams, roles, and territories. Create a comparison table, weigh in on a range of parameters, and track how your metrics fare against each other.
Learn moreIdentify bottlenecks in your sales process with funnels
From capturing a lead to conversion and beyond, Zoho CRM's sales funnels let you visualize your entire sales process and measure its efficiency by checking the overall conversion rate. See the drop in conversion rates from one stage to another to identify where your potentials churn the most, and assign resources to fix leaks.
Learn moreBreak sales records without breaking a sweat
Turn your organization's objectives into achievable targets. Assign and monitor targets to know where you stand. Customize your target meter the way you want it to be: a dial gauge, a bar chart, a watch list, and much more.
Learn moreZones help you focus on what matters.
Plot your sales data across various Zones and get a complete picture of where your business stands. Zones help you identify where you excel and where you need to pay more attention.
Learn moreWhat can you do with CRM Analytics?
You need to identify sales growth in different regions. Or see the impact of a marketing campaign on your sales. Maybe you just want to optimize your sales funnel. Whatever the challenge, Zoho CRM Analytics can do it and more. See the different ways how Zoho CRM Analytics provides you with insights that can improve your bottom line.
Learn moreIntegrate with your favourite products
View all IntegrationsZoho has played an important role in standardizing our program. We now have more than 15,000 sellers using our services.
Looking for an all-in-one
CRM solution?
Unify your sales, marketing, and service teams and analyze business performance across functions.
LEARN MORE- Why Analytics?
- Customizable Reports
- Charts
- Anomaly Detector
- Cohorts
- Quadrants
- KPIs
- Comparator
- Funnels
- Target Meter
- Zone maps
- Capabilities