Tag : data visualization
 Zoho Sheet3 Mins Read
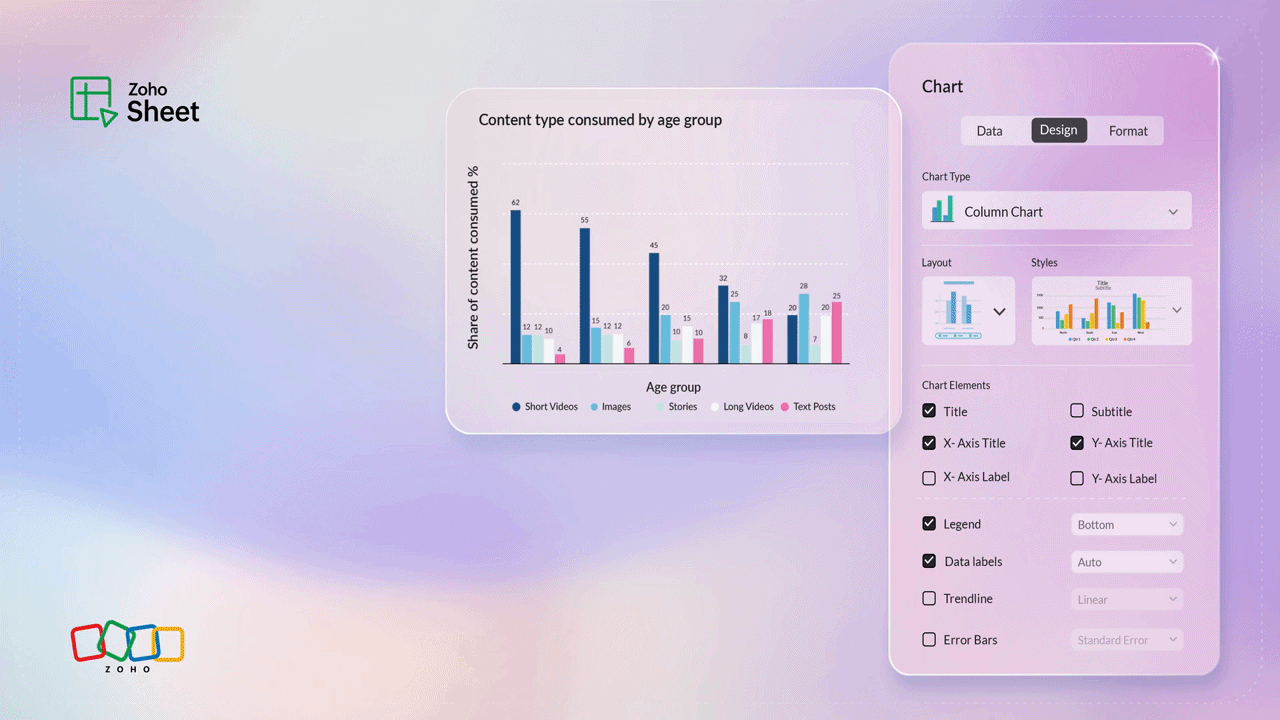
Reimagining charts in Zoho Sheet: Smarter, faster, and more flexible
By Subashree RamamurthyMar 3, 2026 Zoho Analytics7 Mins Read
Zoho Analytics adds 7 new data visualization types for enhanced analysis
By Pradeep VAug 30, 2024
 Zoho CRM10 Mins Read
Cheatsheet: How to build a high-impact sales KPI dashboard
By Sage CrawfordAug 17, 2022 Zoho Analytics4 Mins Read
What makes Zoho Analytics a true unified data analytics platform
By EzraFeb 22, 2022
 Zoho Marketplace3 Mins Read
3 ways to optimize sales interactions to give leads the best service
By judith.fJun 30, 2020 Zoho Marketplace4 Mins Read
ProTips: 5 simple steps to create a data-friendly culture in your office
By judith.fMar 23, 2020 Zoho Sheet3 Mins Read
Visualizing data taken to new heights: Say hello to Zoho Sheet's Race Charts!
By Selva MJan 28, 2020