How to get started with product analytics: Core metrics to understand user behavior
- Last Updated : May 18, 2026
- 166 Views
- 8 Min Read
If you're implementing product analytics, it’s easy to feel overwhelmed by dashboards, metrics, and tracking options.
But here’s the uncomfortable truth: Many teams implement analytics, but only a few use it to influence real product and revenue decisions. Tracking everything doesn’t mean you’re learning. Data only matters when it leads to meaningful insights, and the fastest path to those insights is when your instrumented data can be queried directly by AI agents and LLMs.
So instead of jumping into the pitfall of tracking all the data you can, you need to ask, “What do we need to understand to improve adoption, retention, and revenue?” Every data point you instrument and track should serve a purpose.
Previously, we explored what product analytics is and why it matters. Now, let’s move from theory to practice.
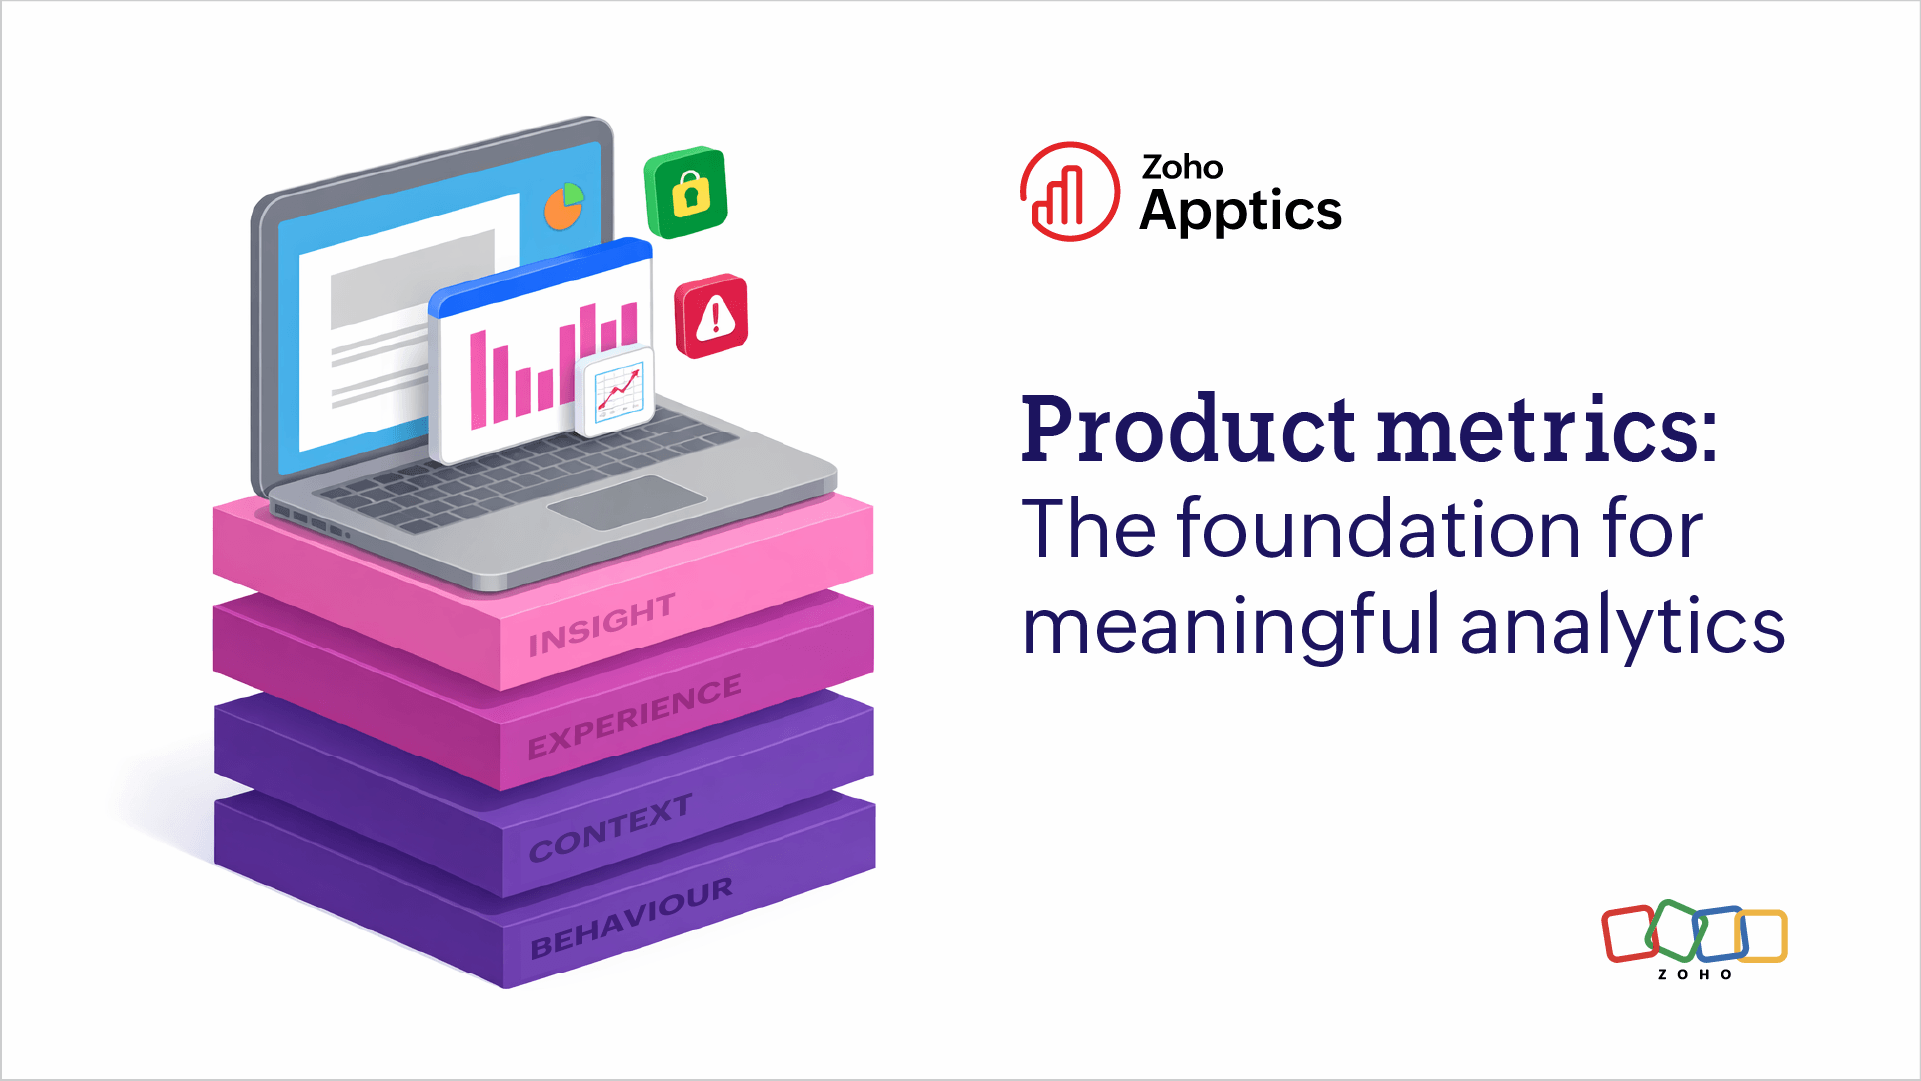
This blog gives you a strategic four-layer framework to help you get started with product analytics and track the metrics that actually matter:
- Behavior layer: What are users doing inside the product? If you don't know what they're doing, nothing else matters.
- Context layer: Who are the users and how are they using the product? This allows you to see if behavior changes based on who or where they are.
- Experience layer: Is the product experience smooth and reliable? This tells you if the behavior was forced by a bug or crash.
- Insight layer: Why are users behaving this way, and what business decisions should we make? The synthesis of the first three layers drives the insights and decisions in the fourth layer.
Let’s break this down.
1. Behavior: Start building the foundation
Product analytics is fundamentally about understanding user behavior through data. Core usage and engagement metrics form the foundation of user behavior analytics, helping teams understand how users interact with their application. This is where most teams begin, but many move on to the next layer too early.
You need to track metrics like:
- Devices: The number of new and active devices
- Users: The DAU (daily active users), WAU (weekly active users), and MAU (monthly active users)
- Sessions: The duration of time users actively spend within the application
- Screens: The pages or views users navigate within the app
- Events: User actions such as clicks, taps, swipes, and gestures
- Retention: The number of users who come back regularly
- App stickiness: The ratio of active devices that regularly engage with the app compared to the total number of unique active devices over a 30-day period
Instrumentation tip
The key here is restraint. Don’t instrument 50 events capturing every button click, swipe, and tap. Look for quality over quantity: start with events that define your major flows like onboarding completed, core feature used, and upgrade initiated.
If an event doesn’t help you understand activation, retention, or conversion, you probably don’t need it yet.
Apptics advantage
With Zoho Apptics, getting started doesn’t require complex setup. Once the SDK is integrated, you can begin tracking core engagement, usage, diagnostic data, and feedback, all within a unified product intelligence layer.
Once the Apptics SDK is integrated, sessions are tracked by default. Screens can be selectively auto-captured or manually instrumented. You also get a set of predefined and custom events for key user actions like onboarding steps, feature usage, and conversions.
By using core analytics metrics like sessions, events, and screens, you can analyze user flows, funnels, and feature adoption across different user groups.
As your instrumentation matures, run periodic audits to keep your data clean. Use the Apptics MCP to conduct periodic instrumentation audits by checking all events and screens tracked across platforms and flagging ghost events, stale screen views, or test instrumentation that never got cleaned up, and fine-tune your SDK setup with a simple prompt.
2. Context: The filter of who and where
Now that you know what happened, the next question is: Who experienced it, and under what conditions?
Without context, a metric is just a number. Context helps explain why and how behavior changes based on environment and user characteristics.
For example, a 20% drop in conversion rate can mean very different things depending on the context. The drop may appear only for Android 13 users or only for users in a specific region—or there could have been a friction point for free plan users that resulted in drop-offs.
Context turns behavior into a diagnosable story about user experience.
This layer focuses on contextual product analytics data such as:
- Technographics: Device model, device type, OS version, app version, device orientation, network strength, and platform
- Geographics: Country, region, and languages
- User attributes: User IDs, account identifiers, and custom properties relevant to your business logic
- Device-user mapping: Tracking how multiple devices such as smartphones, laptops, tablets, wearables, and connected TVs are associated with a single user profile, helping you understand cross-device user behavior.
Instrumentation tip
Only track contextual attributes that help you make decisions. Start simple and expand with purpose.
Apptics advantage
In Apptics, contextual data is captured automatically when the SDK is initialized. This allows you to instantly segment behavioral data without writing additional code.
Session analysis actually sits right at the intersection of both behavior and experience, and it's best categorized as the bridge between them.
What is a session in product analytics?
In Apptics, a session captures everything a user does inside the app from the moment they open it until they close it. This includes screens visited, events triggered, APIs called, and device metadata associated with that session.
Because Apptics captures the session trail by default, you avoid the knowledge gap that happens when you see a crash but have no data on what the user did just before. This is where behavioral context saves your engineering team hours of debugging.
3. Experience: Quality gate
Once you know what users did (behavior) and who they were or where they did it (context), the next question is: How did that experience feel to them?
Behavioral data alone doesn’t reveal frustration; drop-offs don’t always mean disinterest, and low engagement doesn’t always mean low value.
This is where feedback and diagnostic information become critical. Experience data bridges the gap between product metrics and human perception.
- Crashes and ANRs: Fatal errors that cause the app to become unresponsive or hang and forcefully quit
- Non-fatal errors: Handled exceptions and bugs that interfere with the user experience
- APIs: Success and failure rates, along with average response times, used to monitor API latency
- Remote logs: Application logs fetched from user devices remotely for debugging
- In-app feedback: Detailed feedback reports that users can share internally
- In-app ratings: Ask ratings through in-app prompts triggered after users complete specific actions or meet defined conditions
- App Store and Play Store reviews and ratings: Public user reviews and ratings shared on app marketplaces.
This moves beyond first-party behavioral data into zero-party data: information users intentionally share with you. This is often where the most actionable insights live.
But understanding experience isn’t just about what users say — it’s also about how quickly you can detect and fix issues that affect them.
Metrics like MTTD (mean time to detect) and MTTR (mean time to repair, recover, resolve, or respond) help teams measure how quickly they identify and fix problems in the product. The faster issues are detected and resolved, the lower the impact on user experience.
Early detection of issues and quicker resolution times help support teams meet service-level agreements (SLAs) while maintaining user trust.
Instrumentation tip
Don’t ask for feedback or ratings randomly. Experience data is most powerful when it’s contextual and timely. Trigger feedback prompts based on user behavior using conditions such as:
- After a user completes a key action (e.g., onboarding, purchase, or export report)
- After a user spends a certain amount of time on a screen
- When users exit a high drop-off step in a flow
- After repeated actions or errors within a session
Trigger them intentionally, like after a value moment, after a user completes a critical flow, or when users exit a high drop-off screen.
Apptics advantage
Zoho Apptics allows you to collect both internal feedback (in-app feedback) and external feedback (store reviews and ratings). Apptics also provides the data you need to investigate, debug, and respond to experiences and feedback faster.
Trigger contextual feedback prompts at key moments (like after a successful report export or onboarding completion); collect text responses, attachments, screenshots, and screen recordings; and then tie feedback directly to session data, device metadata, and app version.
This means when a user says a screen is confusing, you don’t just see the comment. You see:
- What screen they were on
- What actions they took before
- What device and OS they used
- Which app version they were on
That’s experience, context, and behavior, connected together.
Apptics also aggregates ratings and reviews from the App Store and Play Store in a single dashboard. You can monitor rating trends over time, sentiment shifts after new releases, recurring complaints and feature requests, and much more.
Instead of manually scanning store reviews, you can correlate them with in-app behavior and release versions.
4. Insight: Actions and outcomes
By combining behavioral, contextual, and experiential data, product teams can uncover deeper insights and make more informed product decisions.
- User flows and journeys: Get visibility into how users navigate through your application.
- Funnel analysis: Understand where users drop off at each step before completing an action or goal within the application.
- User segmentation: Segment the user base based on defined conditions and criteria.
- Custom properties: Define and track attributes beyond the default metrics that fit your business logic
Instrumentation tip
When tracking additional attributes, avoid sending PII (personally identifiable information) or sensitive data to prevent privacy violations.
Apptics advantage
In Apptics, you can take it a step further and start acting on the insights. Some practical use cases include:
- Exporting segmented user lists and using that to send targeted campaigns
- Sending in-app update alerts to affected app versions due to a unique bug
- Sending targeted push notifications to selected user segments
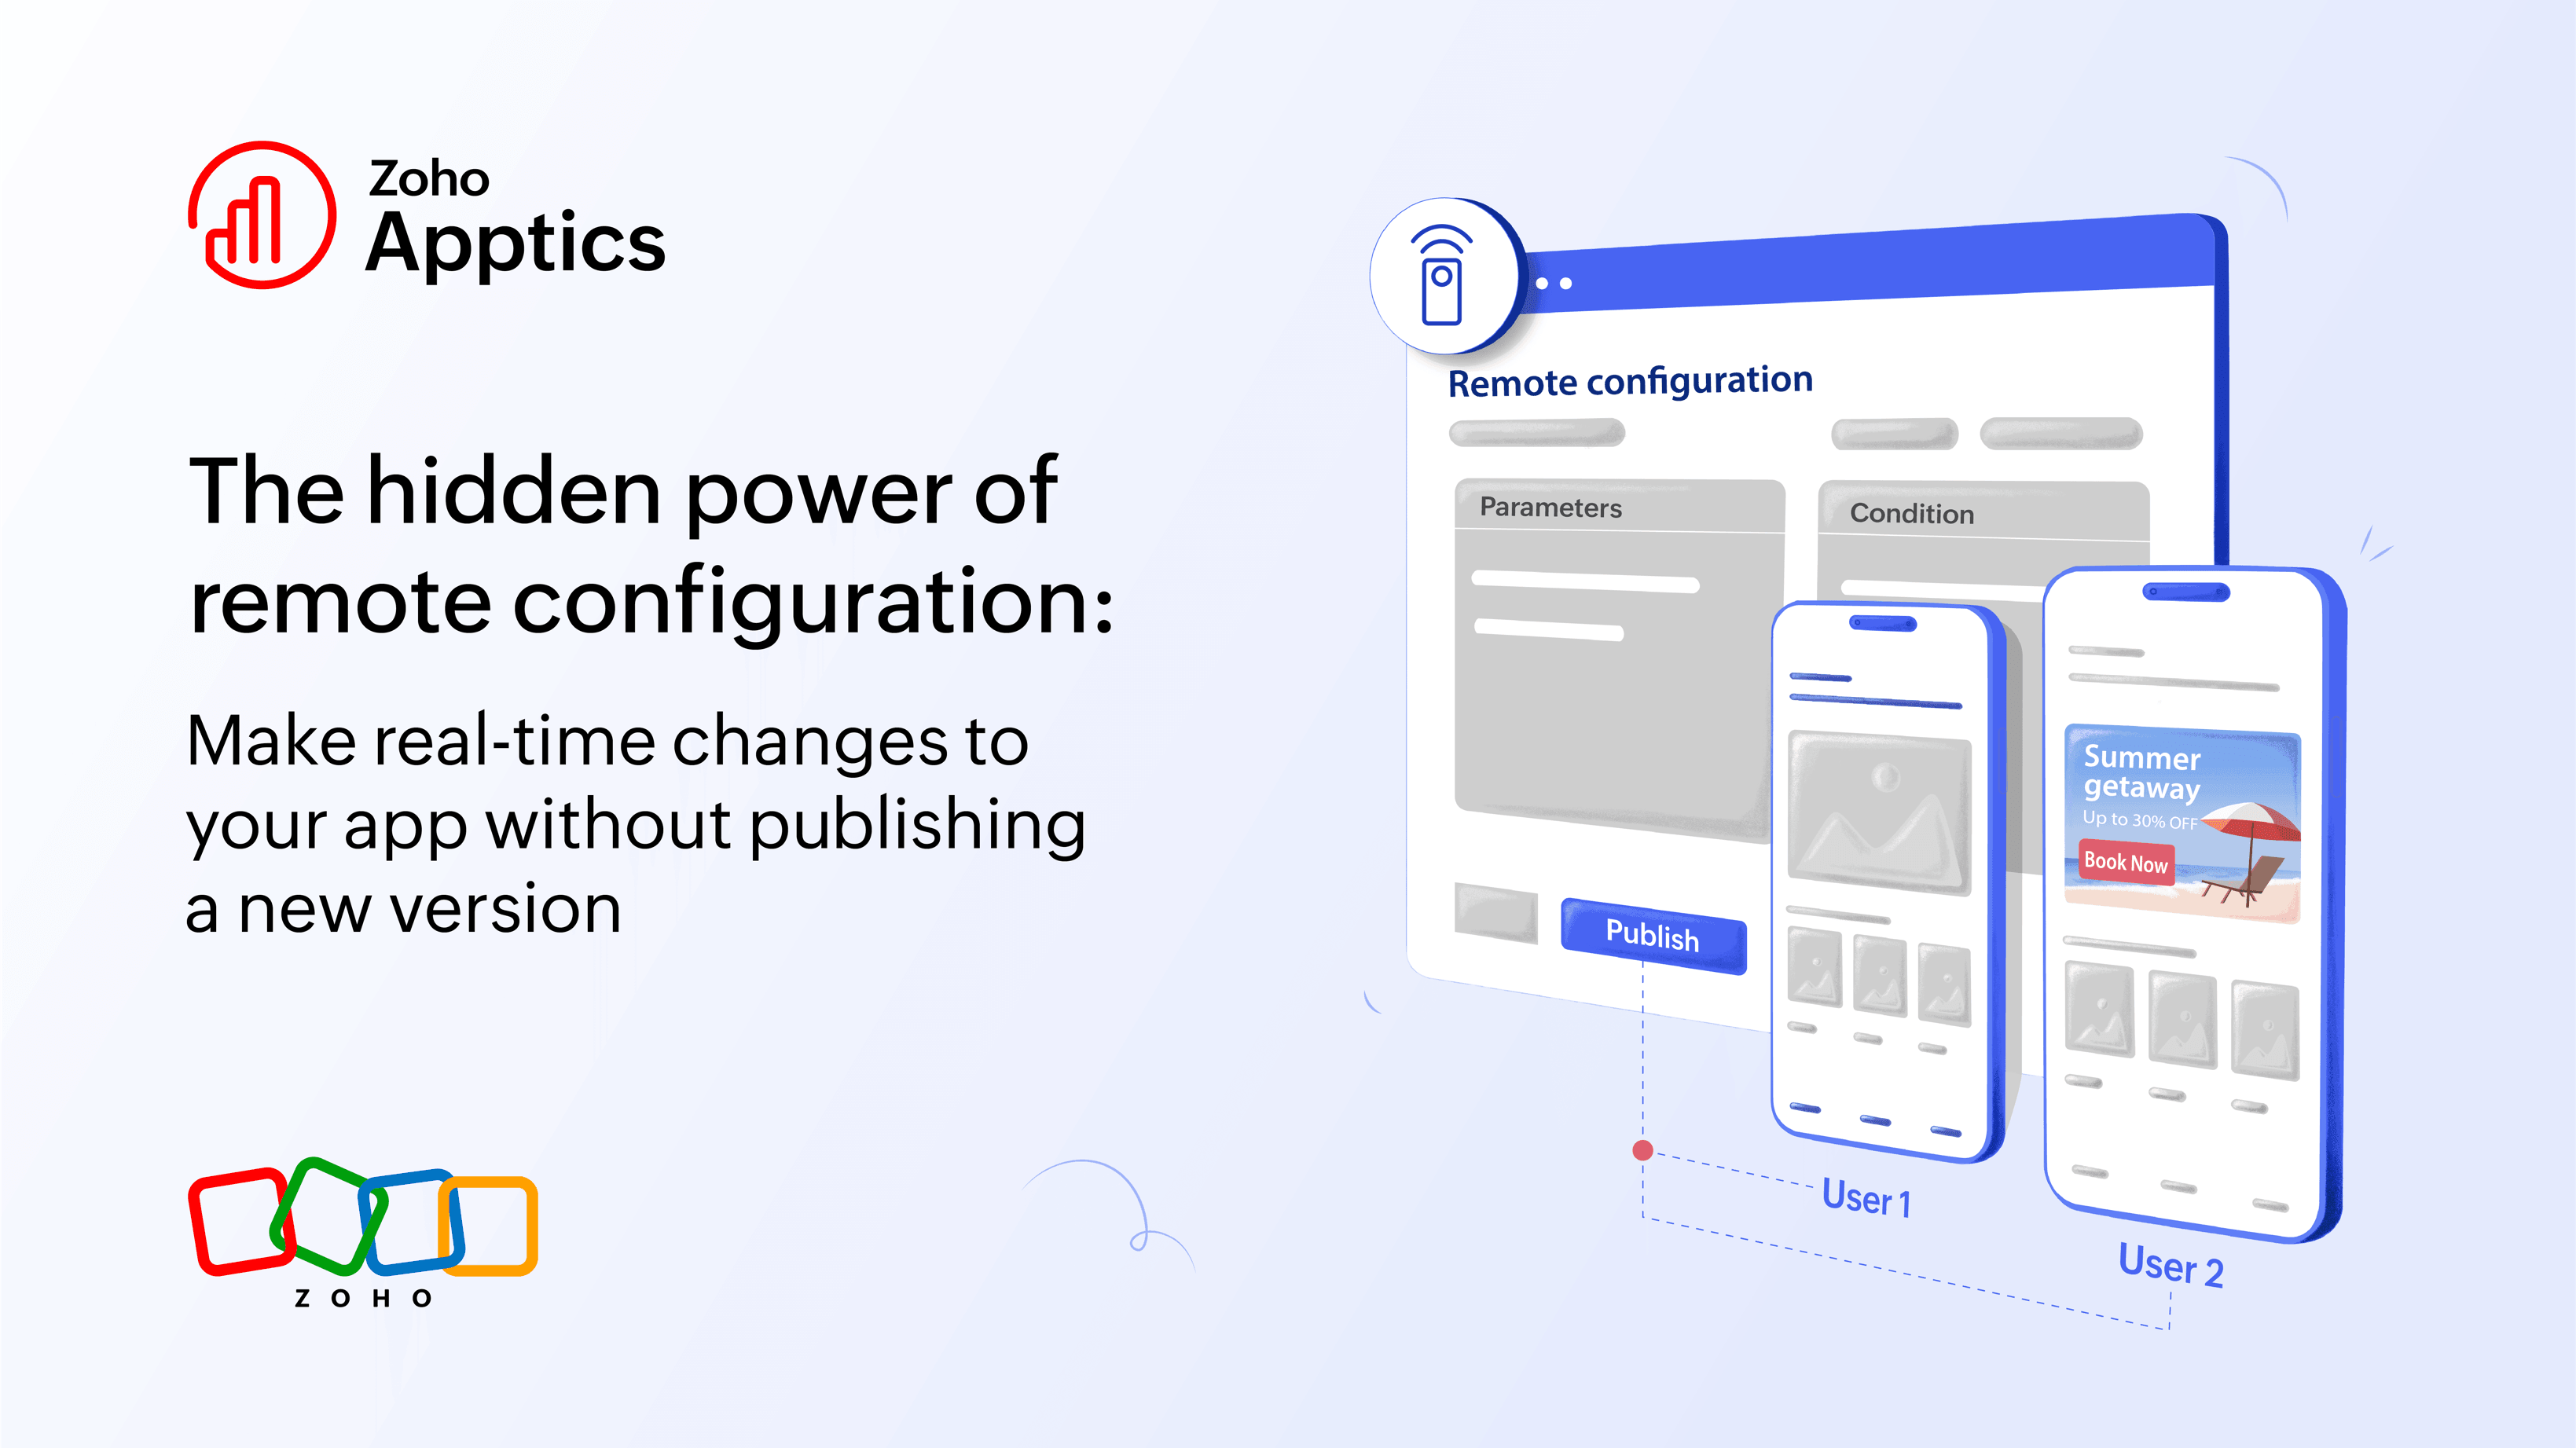
- Making remote configurations and personalizations using a set of parameters and conditions
With the Apptics MCP server, you can go further and query your instrumented data in natural language directly in Claude, Cursor, or VS Code instead of navigating dashboards. Ask things like "which platform has the highest drop-off between onboarding_started and first_purchase?" and get answers instantly. See the Apptics MCP use cases playbook for tested prompts across product, UX, and engineering workflows.
The 4-layer product analytics framework
| Layer | Question it answers | Example of relevant data |
| Behavior | What happened inside the product? | Events, sessions, and screens |
| Context | Who experienced it and where? | Device type, OS version, and region |
| Experience | How was the product experience? | Crashes, errors, and feedback |
| Insight | What action should we take? | User segments and custom properties |
This layered approach helps product teams build a strong foundation for product analytics while avoiding common instrumentation mistakes.
The AIR model
To avoid the common analytics bottleneck and overly complex setups, use this simple framework.
A: Align
Before instrumenting every event or screen, write down the three questions that matter most. If an event doesn’t help answer those questions, don’t track it yet.
I: Instrument
Start with your vital signs and identify the 5–10 core events that define the core workflows for your app. Clean data beats big data. Track the fundamental data points and validate if they are captured accurately.
R: Review
Schedule a regular review of your analytics insights. If you can't identify at least one improvement based on your data, refine your implementation. Analytics should move the product forward, not just fill dashboards.
In practice, product teams monitor a small set of operational vital signs, metrics that indicate the health of the product on a daily or weekly basis. As your analytics practice matures, you can later define a specific metric to track long-term product success alongside these daily metrics.
That’s how you get started with product analytics the right way, layer by layer: Choose purpose before volume, and focus on insights instead of noise.
If you're implementing Zoho Apptics and have questions about instrumentation or setup, you can always reach out to us at support@zohoapptics.com, and our team will be ready to help you!
 Supraja Gayathri S
Supraja is a Product Marketer at Zoho Apptics with 5+ years of experience in breaking down complex concepts into easy-to-digest, detailed blogs. She loves blending technical content and data with creative storytelling.