How to investigate mobile app crashes faster with AI: Apptics MCP walkthrough
- Last Updated : July 9, 2026
- 83 Views
- 6 Min Read

A crash report tells a team that something went wrong in the app, but by the time it reaches the developer, the user has already faced the issue. The app may have frozen, closed suddenly, or failed during an important action such as sign-in, checkout, or form submission.
What the developer receives is the evidence left behind: the stack trace, app version, device model, operating system, occurrence count, affected users, and the time the crash happened. This information is useful, but it does not always answer the most important question: why did the crash happen?
A stack trace can show where the app failed, but developers still need to understand what caused that failure. Was the app using data that was not available? Did the API return an unexpected response? Did the issue happen only on a specific device, operating system, or app version? Finding those answers is where debugging usually starts to take time.
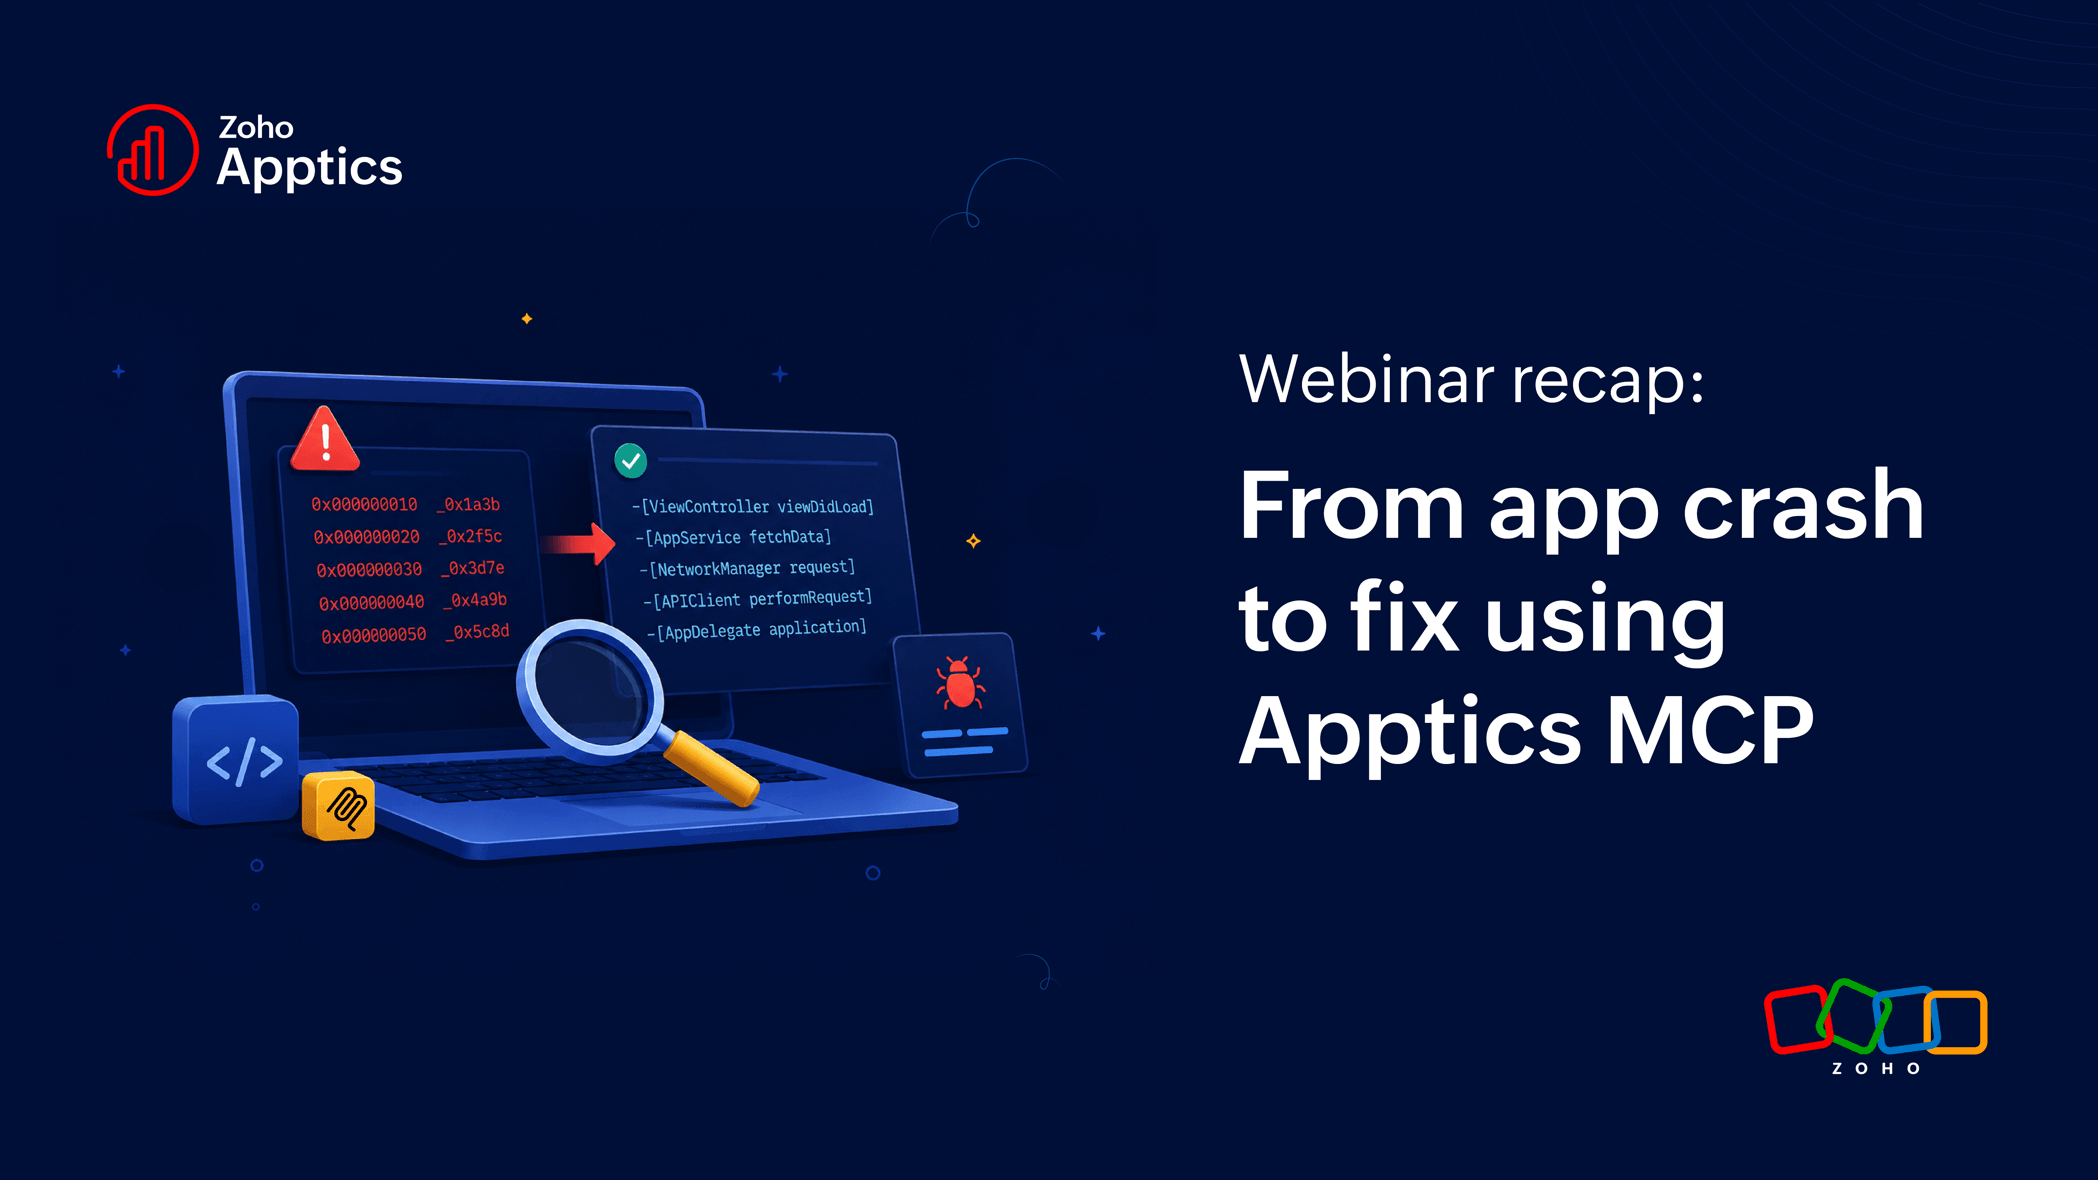
We recently conducted a live webinar on how developers can use Apptics MCP to investigate crashes faster with AI-assisted workflows. If you missed the session, this blog gives you a quick recap of the key ideas we covered, along with the complete webinar recording.
In this blog, we’ll look at why crash debugging often takes longer than expected, how Apptics MCP brings crash context into AI-assisted development workflows, the kind of prompts developers can use, and a few best practices for investigating production crashes.
Why crash debugging becomes slow
One of the key takeaways from the webinar was that debugging does not always slow down because teams lack crash data. More often, it slows down because developers have to connect that data across multiple tools before they can understand the full picture.
A developer may begin in the crash dashboard, check the affected users, read the stack trace, review the app version, and then move to the codebase. From there, they may search for the failing method, compare recent changes, check logs, ask teammates for context, and try to reproduce the issue. Each step is necessary, but the process becomes slower when all the information lives in different places.
The problem is not the developer’s ability to debug. It is the distance between the crash report and the actual code investigation. Crash data lives in one place, code lives in another, and team context often lives somewhere else. Before developers can move toward a fix, they first have to bring all of that information together.
That is the gap Apptics MCP helps reduce.
What Apptics MCP changes
Apptics MCP brings Zoho Apptics crash data closer to the developer’s working environment. Instead of manually moving through crash reports in a dashboard, developers can pull crash context into AI-assisted development tools using natural-language prompts.
During the webinar, we demonstrated how a developer can retrieve recent Android crashes with a prompt such as:
“Get me the recent Android crashes.”
Apptics MCP can fetch the crash list from Apptics and show useful details such as the exception type, affected version, occurrence count, affected users, and latest occurrence. With this context available upfront, developers can decide where to begin instead of investigating crashes at random.
They may choose to start with the crash affecting the most users, the one appearing in the latest release, or the one tied to a critical flow such as onboarding, payment, or checkout. Once they choose a crash, they can continue the investigation with a prompt such as:
“Analyze this crash.”
Apptics MCP can then help summarize what the stack trace indicates, highlight the failing method or code path, and point the developer toward the area that needs attention. It does not fix the crash automatically, but it gives the developer a clearer starting point.
From crash details to possible cause
A crash report contains several clues. The stack trace shows where the failure appeared, the app version shows when it may have started, device and OS details show where it happened, and occurrence count and affected users show how serious it is. When these details are connected properly, they help developers understand what may have happened inside the app.
For example, a crash may point to a user profile screen. The stack trace may show that the app failed while trying to display user details, which at first may look like a simple null value issue. But the real question is why that value was missing in the first place.
Maybe the API returned an empty response. Maybe the screen opened before the data finished loading. Maybe the user session expired, but the app still tried to show the profile page. Without enough context, the developer has to test each possibility manually.
With Apptics MCP, the crash details from Apptics can help narrow the investigation faster. Instead of stopping at “what went wrong,” the developer can start asking, “where should I inspect first?” That direction matters because it helps teams move from raw crash data to a more focused investigation.
Why quick fixes are not enough
When a crash is caused by a null value, the quickest fix may be to add a null check. That may stop the crash from happening, but it may not solve the actual issue.
If the app received no data from the server, the fix may need better response handling. If the screen loaded too early, the fix may need better state management. If the crash started after a recent release, the changed code path needs to be reviewed carefully.
A fast patch can sometimes hide the symptom without addressing the cause. A proper fix needs context, and Apptics MCP helps bring that context into the debugging flow. Developers can work with production crash data while they investigate, which helps them understand what happened to real users and choose a better fix direction.
From cause to fix direction
Once the likely cause becomes clearer, the developer can ask Apptics MCP for a possible fix direction.
If the AI-assisted environment has access to the codebase, it can connect the crash context with the relevant implementation and suggest areas to review. This may include better validation, safer API response handling, fallback logic, lifecycle checks, or a closer look at a recently changed code path.
The suggestion is not the final answer. The developer still needs to review the code, test the fix, check for side effects, and decide what is safe to ship. The value of Apptics MCP is that it reduces the manual effort needed to move from a crash report to a meaningful fix direction.
Why this matters for mobile teams
Mobile crashes need quick attention because fixes are not always instant. A web issue can often be fixed and deployed quickly, but a mobile fix may need release planning, app store review, and user adoption before it reaches everyone.
That makes crash investigation even more important. When a production crash happens, teams need to understand how many users are affected, whether it happens in the latest version, whether it is tied to a critical flow, and where the investigation should begin.
Zoho Apptics already gives teams the crash data they need. Apptics MCP makes that data easier to use during development by reducing tool switching, bringing crash context closer to the code, and helping developers move from crash report to investigation faster.
A better debugging flow
Good debugging usually follows a clear path: identify the issue, understand the context, find the likely cause, inspect the code, test the fix, and ship the right change. The flow often breaks when tools are disconnected, because developers spend too much time collecting information before they can start solving the issue.
Apptics MCP helps keep that flow connected. Developers can ask questions in plain language, understand crashes faster, and focus on the part of the code that needs attention.
It does not make debugging effortless. Developers still need judgment, testing, and review. What it does is remove some of the friction that slows the investigation down.
Conclusion
A crash is more than an error message. It is a signal from a real user experience.
Apptics MCP helps teams respond to that signal faster by bringing Zoho Apptics crash data into AI-assisted development workflows. It helps developers move from crash report to context, from context to likely cause, and from likely cause to fix direction with less manual effort.
The developer still owns the final decision, but they do not have to begin with scattered clues. With Apptics MCP, they can begin with context.
If you would like to explore Apptics MCP for your team's use cases or see the workflow demonstrated on your own application, reach out to us to schedule a walkthrough.