Apptics Insights: An Android Studio crash reporting plugin
- Last Updated : May 6, 2026
- 145 Views
- 3 Min Read
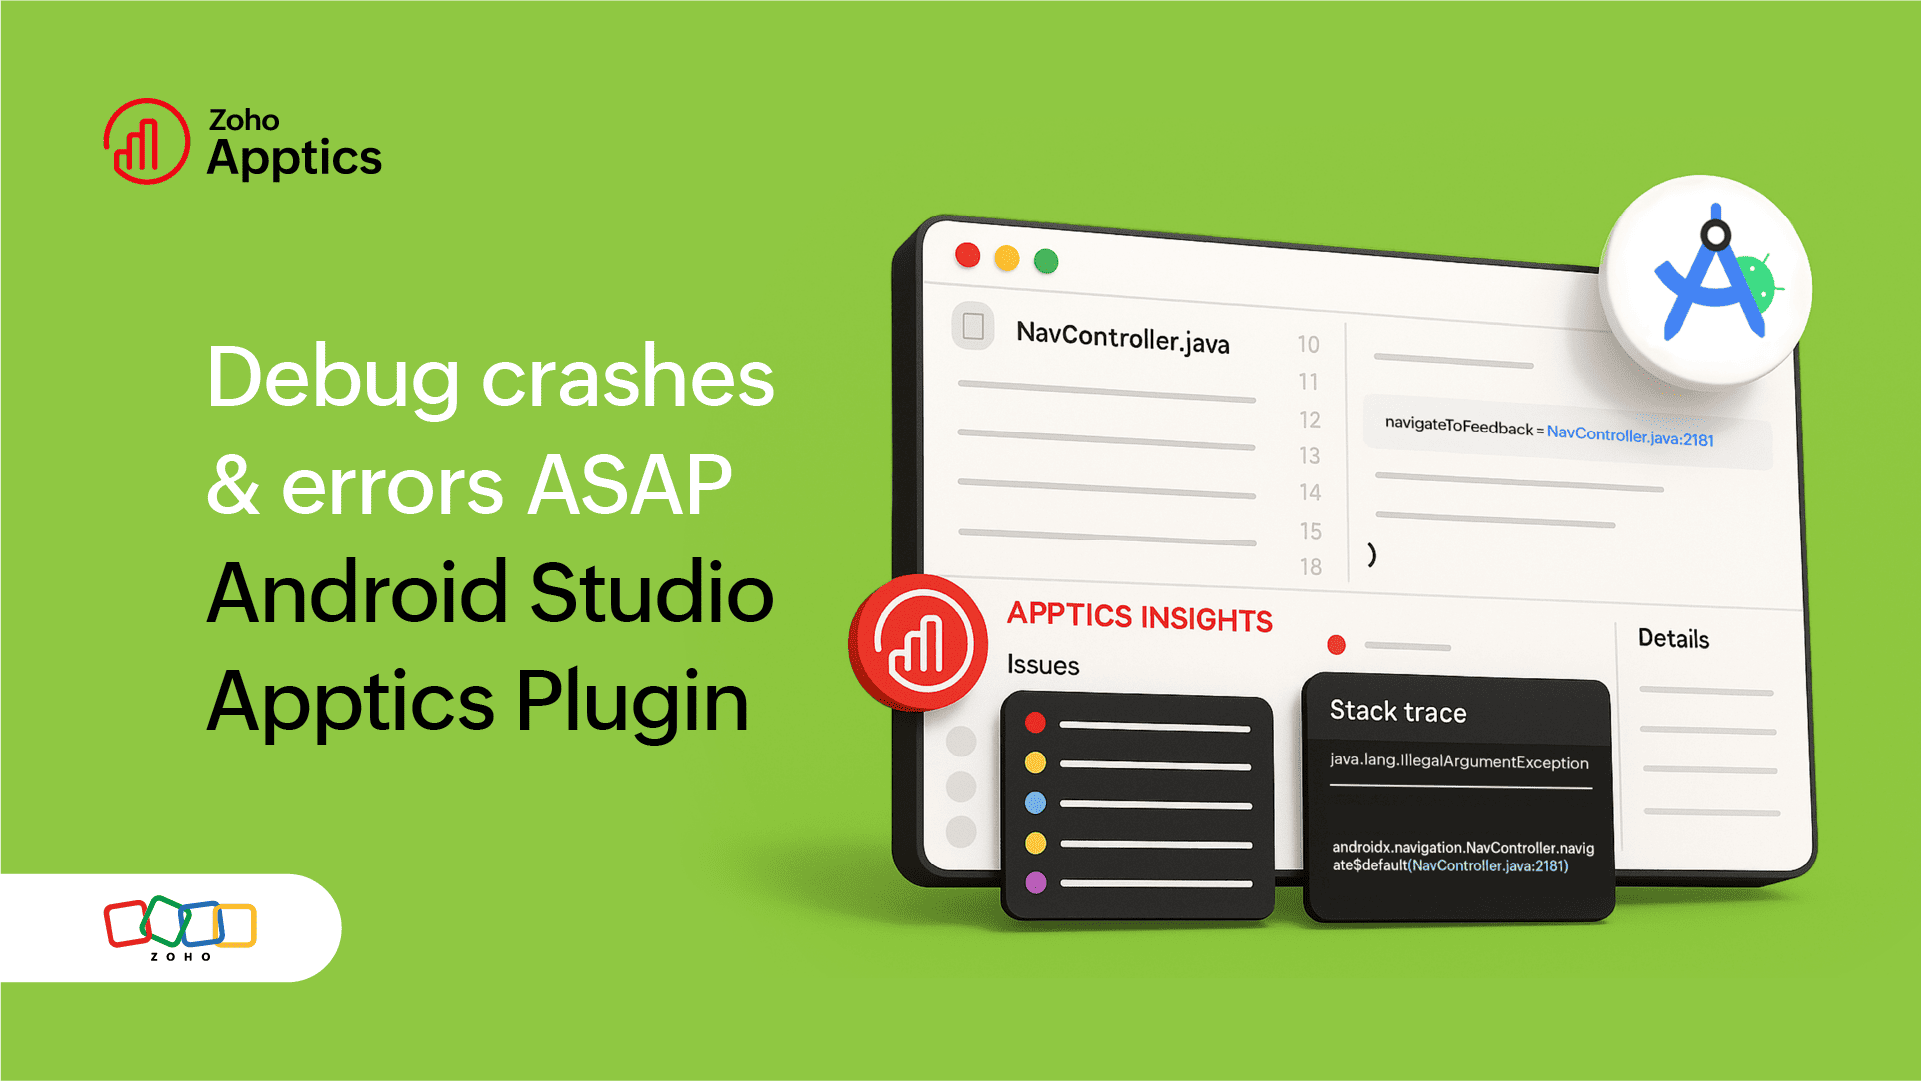
Introducing Apptics Insights, an Android Studio plugin integration that brings crash and error reports to your IDE so you can debug faster without switching tabs.
Stack traces don't tell the whole story, but your IDE does
A crash report may blame MainActivity.kt:42, but the real issue could be a silent API failure in a co-routine or a third-party SDK melting down on Android 14. Developers can waste hours reconstructing problems from stale logs, half-baked stack traces, and user screenshots.
That's where our Android Studio crash reporting plugin comes in.
Apptics Insights in action
This plugin provides a three-fold solution to your problem.
A time machine for debugging
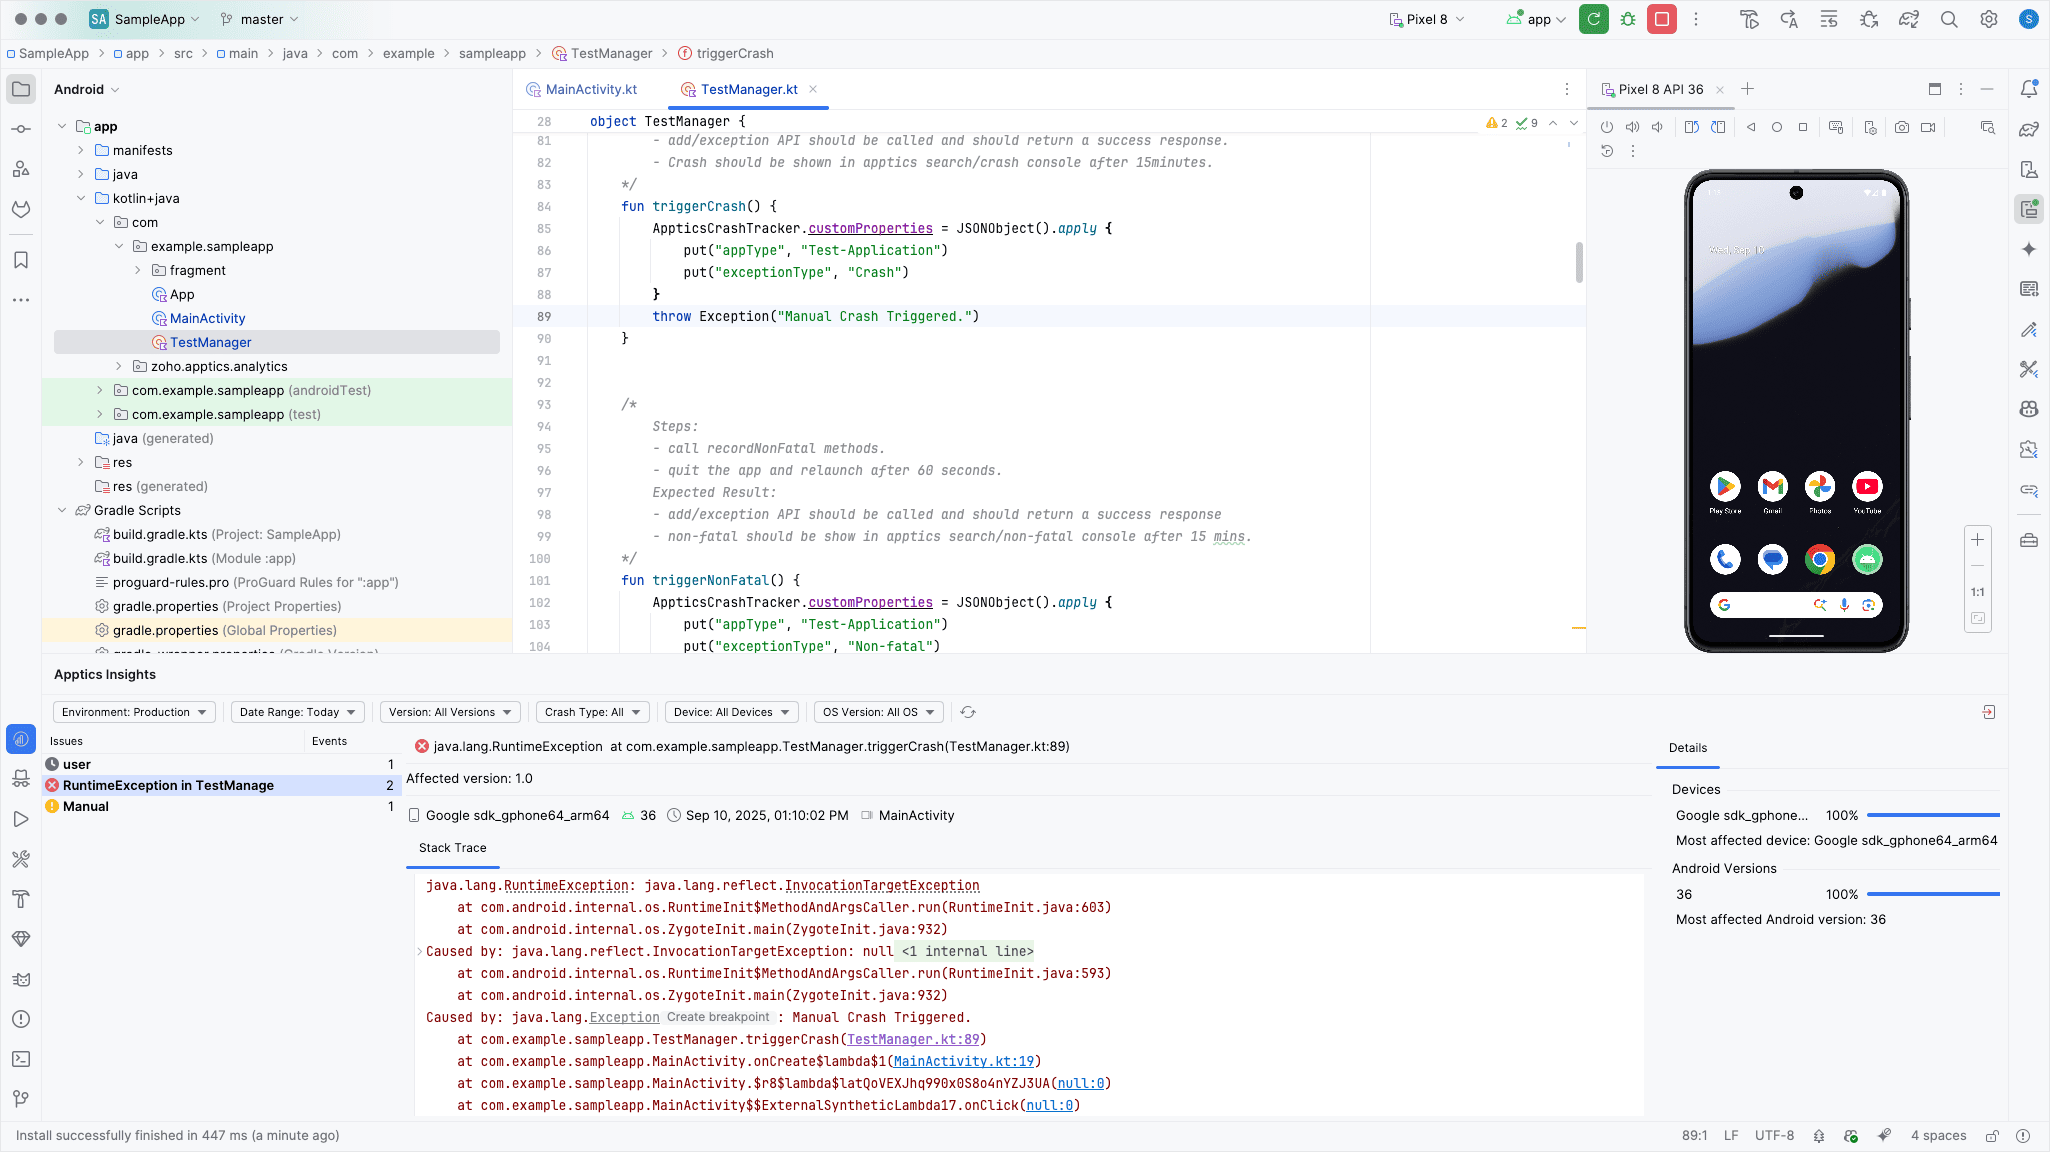
View every crash, ANR, and non-fatal error from the past 90 days directly inside Android Studio. The issues are sorted by frequency, user impact, app version, and device type.
Contextual stack traces
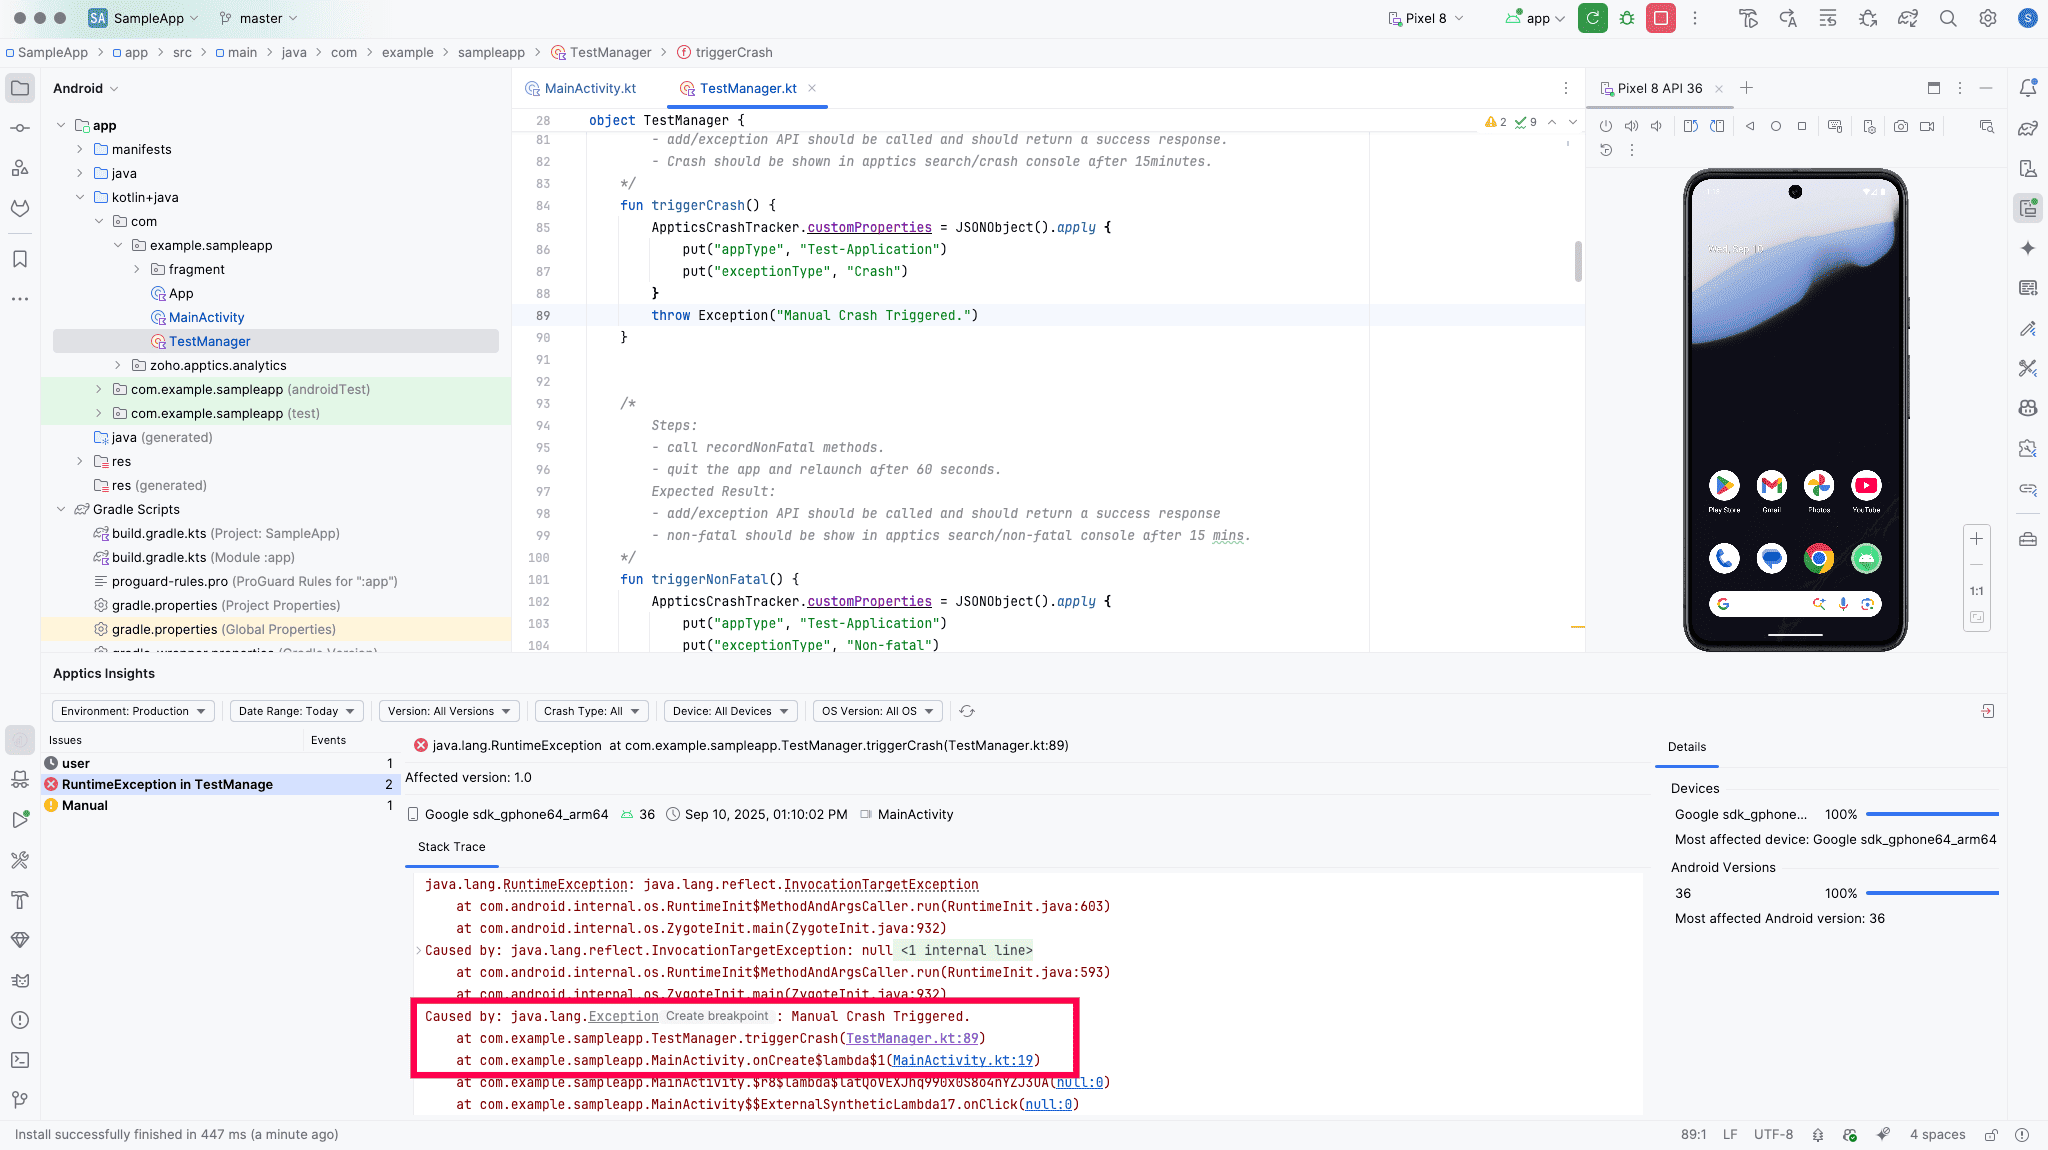
See full, Logcat-style stack traces with critical context baked in.
- Thread dumps at the millisecond of collapse
- Network calls that timed out silently
Hyperlinked code lines
Click on any hyperlinked class or method in the stack trace, jump straight to the line in your code where the crash happened, and hover to see why it crashed.
No more switching tabs. No more chasing stack traces in the browser. Your stack traces, logs, and code live in the same window, where they can finally communicate with each other.
With Apptics' Android Studio plugin, you can debug faster in Android Studio.
Switch modes to match your debugging context
One of the most powerful features of Apptics Insights is the ability to toggle between Development and Production modes with ease. This flexibility helps developers get a clear picture of what’s happening in both environments.
- Development mode: Displays crashes that occur while testing the app in a local environment
- Production mode: Shows crashes reported by real users using the live app from the Play Store
Filter issues to debug faster
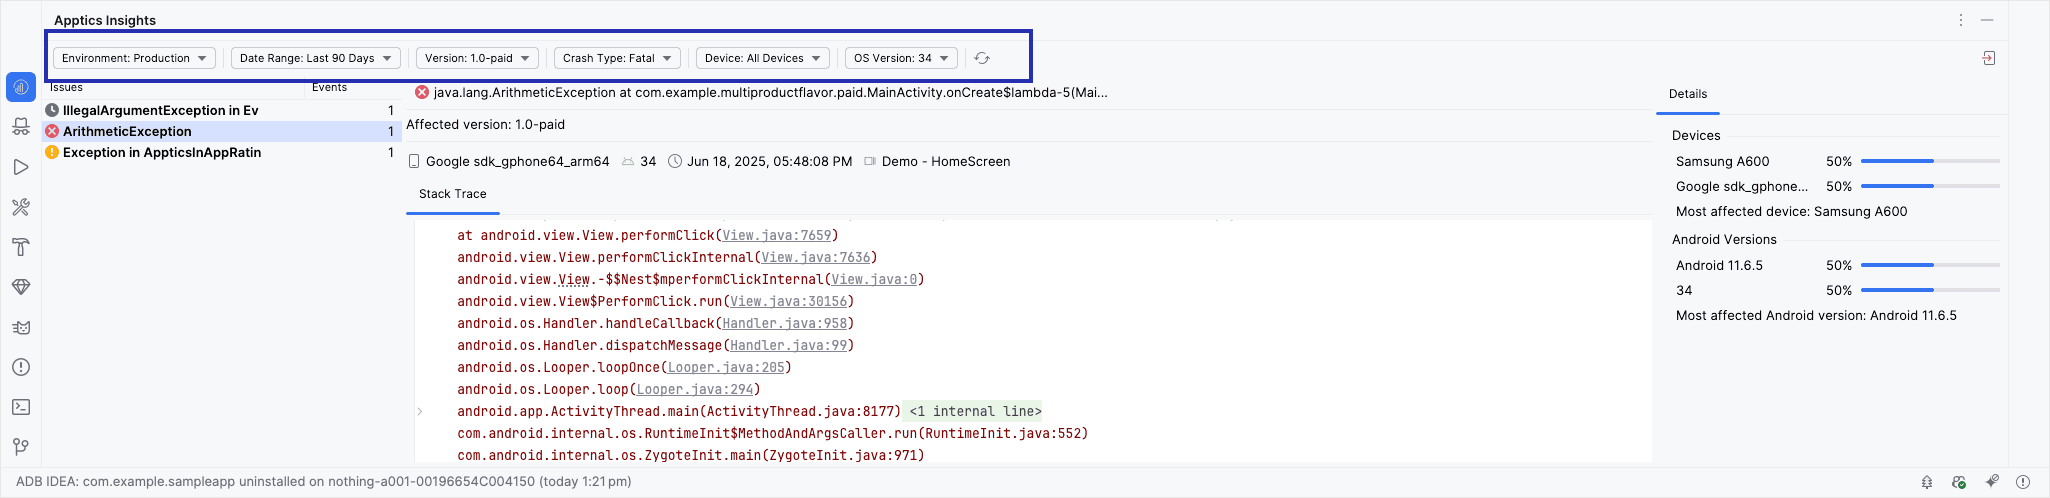
Apptics Insights doesn’t just show crash and error logs; it gives you smart filters to make debugging faster and more focused. You can filter issues by:
- Date: Easily explore crash reports from the last two months, including today’s issues. Whether you're looking for fresh bugs or long-standing crashes, everything is neatly organized.
- Crash type: Filter through issues based on crash type and severity, like crashes, ANRs, and non-fatal errors.
- App version: Want to know which version introduced a bug? Just filter crash logs by specific app versions to spot regressions or version-specific issues.
- Device and OS version: Crashes can vary across devices and Android versions. With built-in filters, you can quickly isolate issues affecting only certain models or OS builds (such as issues only on a Pixel 6 running Android 13).
These filters are designed to help you pinpoint the root cause without drowning in irrelevant data.
Get to root cause analysis directly
For every issue listed, the Apptics plugin provides a complete, structured stack trace similar to Logcat.
But here’s the best part: You can click on a hyperlinked line in the stack trace, and Android Studio will instantly navigate you to the exact file and line of code.
This eliminates the need to search for classes manually or guess where the issue is. Whether it's a NullPointerException, a threading issue, or an out-of-bounds crash, you get direct access to the source code in a single click.
Now that you’ve seen how our plugin transforms crash debugging, here’s how to get started in just a few minutes.
Steps to get started with Apptics Insights
To start seeing crashes, ANRs, and non-fatal errors reported in Apptics inside Android Studio, install Apptics Insights from the Plugin Marketplace. You can refer to our Apptics Android Studio plugin guide for step-by-step guidance.
After installing Apptics Insights, you’ll see a new Apptics tab right inside the IDE, alongside other tools like Logcat, Terminal, and Build. The Apptics Insights tab is now your crash debugging dashboard, where all crash logs from your Apptics-integrated app will be displayed directly within Android Studio.
Whether you're fixing crashes and errors during development or reviewing issues after a production release, Apptics Insights helps you monitor, investigate, and resolve problems faster and more efficiently without ever leaving Android Studio.
This makes it easier than ever to keep your app stable, reliable, and user friendly. Install Apptics Insights in JetBrains marketplace today and debug from right inside Android Studio!
 Lubna Mariyam
Android Developer at Zoho Apptics