- HOME
- Data Management
- How to track social media metrics in Zoho Tables
How to track social media metrics in Zoho Tables
- Last Updated : April 29, 2026
- 155 Views
- 5 Min Read
Posting on social media is easy.
Tracking what actually works? Not so much.
Today, most teams run a mix of organic and paid campaigns across multiple platforms and tools. While execution is distributed, the real challenge is that metrics end up scattered across apps, dashboards, and spreadsheets (see why teams move beyond Excel here), making it hard to get a clear picture of performance.
Many teams start with a monthly content plan and end up tracking likes, comments, shares, and saves in disconnected sheets. More often than not, the focus shifts to what was posted rather than what actually moved the needle.
To truly understand performance, teams need a central system that connects campaign planning, execution, published posts, and metrics in one place. This is where a relational system like Zoho Tables comes in—helping you not just plan campaigns but also centralize and structure the data that matters.
In this blog, we’ll walk you through how to track social media progress using Zoho Tables. But before we dive into that, let’s first talk a bit about social media metrics.
Social media metrics and why they're important
Social media is a core part of most marketing strategies. Social media metrics help you understand whether a campaign only looked good or actually delivered results. They help you to understand what format works, who engaged with your campaign, whether you're targeting the right audience, and more.
Before setting up a tracking system in Zoho Tables, it's important to understand which social media metrics matter most.
Social media metrics you should be tracking in 2026
Awareness metrics
Impressions
Impressions show how many times your post appears in users’ feeds, regardless of whether they engage with it.
Follower growth
A growing follower count often signals a healthy social presence, but quality matters more than quantity. It’s important to ensure your followers align with your target audience and business goals.
Mentions
Brand mentions are references to your business across posts, tags, reviews, and articles, offering valuable insight into how your audience perceives you.
Engagement metrics
Likes
Likes and reactions show how often someone paused to engage with your content. Though sometimes called vanity metrics, they still contribute to engagement rate and give a quick sense of what’s resonating.
Comments
Comments are one of the clearest signals that your posts are working. While hitting “like” takes a second, writing a comment requires thought and effort.
Saves
Saves are a strong indicator of long-term value. When someone saves your post, it means the content was useful enough to revisit later, not just scroll past.
Shares
Shares measure whether your audience finds your content valuable enough to pass along to others and most comments indicate that your message resonated strongly.
Conversion metrics
CTR
Click-through rate (CTR) measures how often people click your call to action compared to how many times the post was seen. It’s calculated by dividing total clicks by total impressions and multiplying by 100.
CPM
CPM (cost per thousand impressions) measures how much you spend to generate 1,000 views, making it a key metric for brand awareness campaigns. It’s calculated by dividing total ad spend by total impressions and multiplying by 1,000.
CPC
Cost per conversion (CPC) shows how much you spend to generate a single conversion, calculated by dividing total campaign cost by total conversions.
Conversion rate
Conversion rate measures how often your social media content turns clicks into meaningful actions like sign-ups, downloads, or purchases.
Most teams track these metrics across:
Native platform analytics
Spreadsheets
Screenshots for reports
This makes it difficult to:
Compare campaigns
Track progress over time
Connect engagement with conversions
This is where a structured tracking system like Zoho Tables becomes useful.
How Zoho Tables helps
Centralized workspace
Zoho Tables brings all your social media data into one place, so you’re no longer jumping between platforms, spreadsheets, and tools. Whether you're tracking Instagram, LinkedIn, or X campaigns, everything lives in one place and can even connect directly with execution tools like Zoho Social. With everything in a single, organized workspace, it's easier to get a complete view of performance.
Customizable tables for campaigns/posts
You can structure your tables exactly the way your team works. Track data at the campaign level or drill down to individual posts by adding fields like platform, campaign name, post link, publish date, and key metrics (likes, reach, clicks). This flexibility ensures your tracking system fits your workflow and not the other way around.
Easy collaboration
Teams can work together seamlessly within Zoho Tables. Assign owners to campaigns, add record comments, and keep updates in one place so everyone stays aligned. This reduces back-and-forth across emails or chat tools and ensures nothing falls through the cracks.
Real-time tracking
As metrics are updated, your data stays current and accessible to the entire team using reports. This makes it easier to monitor performance regularly, spot trends early, and make faster decisions without waiting for end-of-week or end-of-month reports.
Steps for tracking social media metrics in Zoho Tables
1. Create a centralized social media tracking base
Set up a dedicated table to log all your social posts and performance metrics in one place. Include fields like platform, post date, impressions, engagement, clicks, conversions, and ad spend.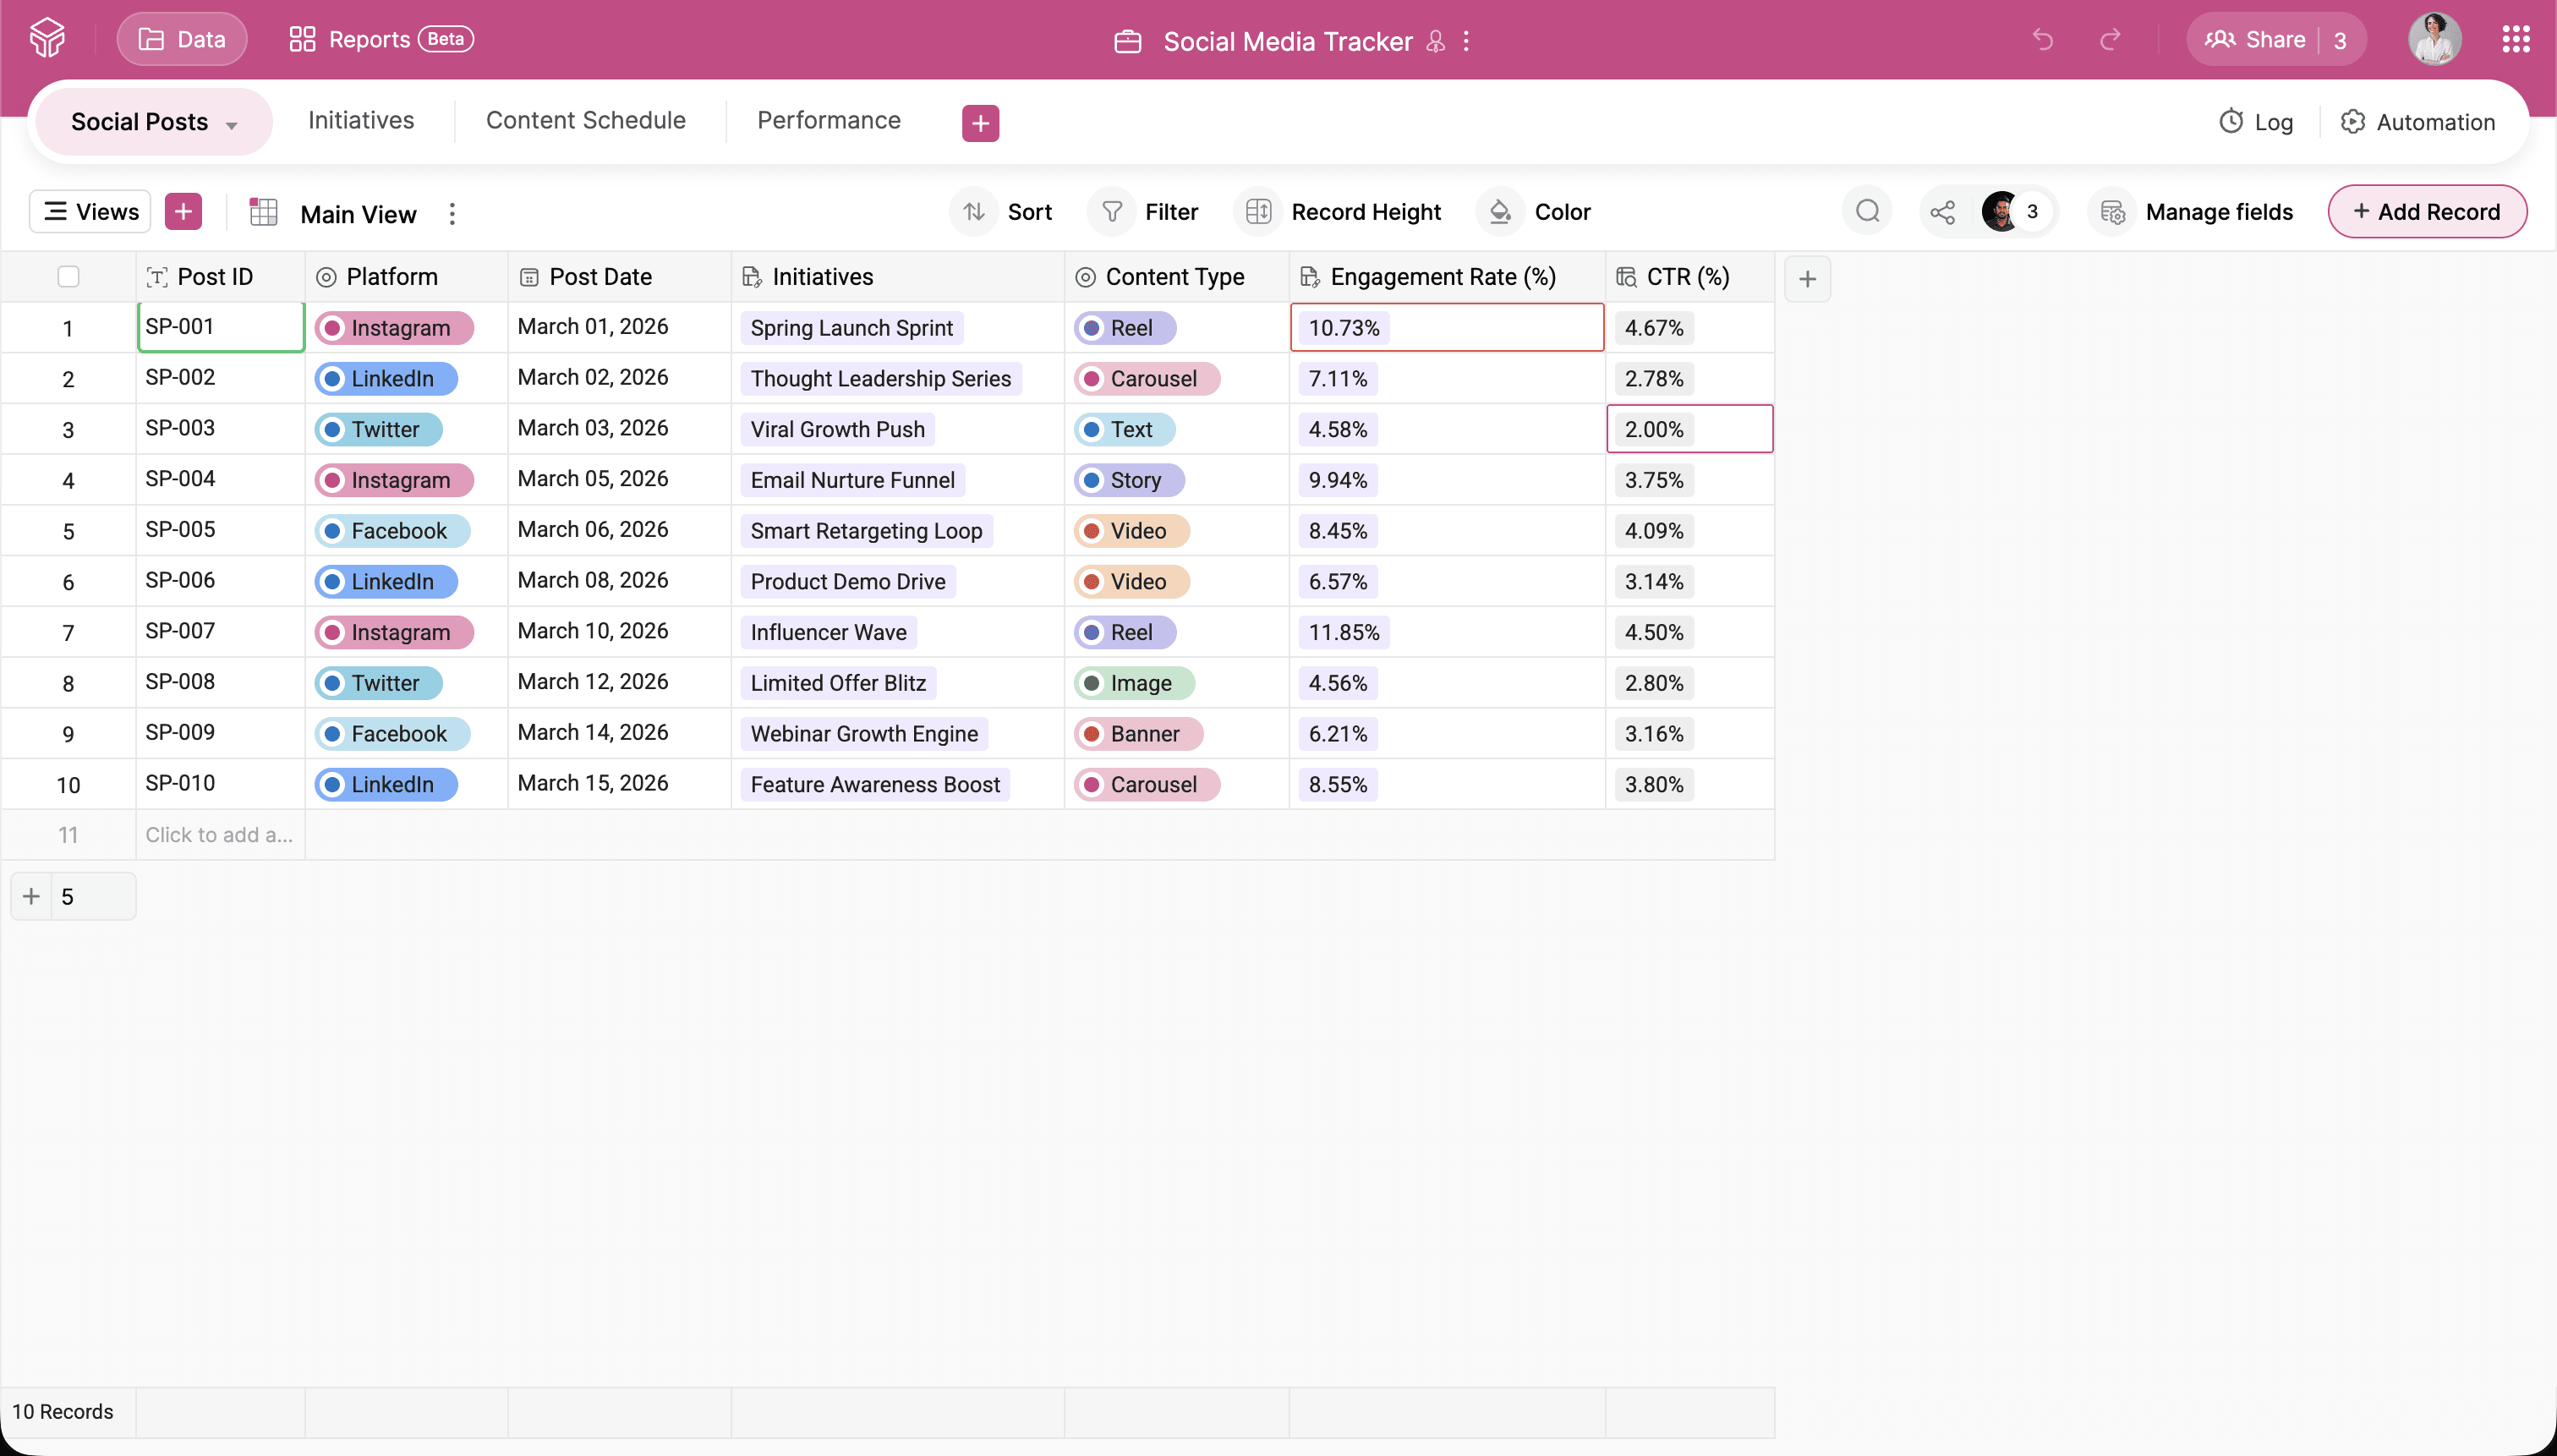
2. Use field types to structure your data properly
Choose the right field types like number, single-select, formula, and linked records to keep your data clean and consistent. This ensures your tracking stays accurate and scalable as your content volume grows.
Here's an example of what the structure could look like:
Table: Social Posts
Fields:
Platform
Post date
Content type
Impressions
Likes
Comments
Shares
Saves
Clicks
Conversions
3. Link your data across tables
You can also use linked records to connect related tables—for example linking a social post to its campaign or connecting campaign performance to overall marketing goals. This relational structure keeps your data organized while allowing you to analyze performance from multiple perspectives.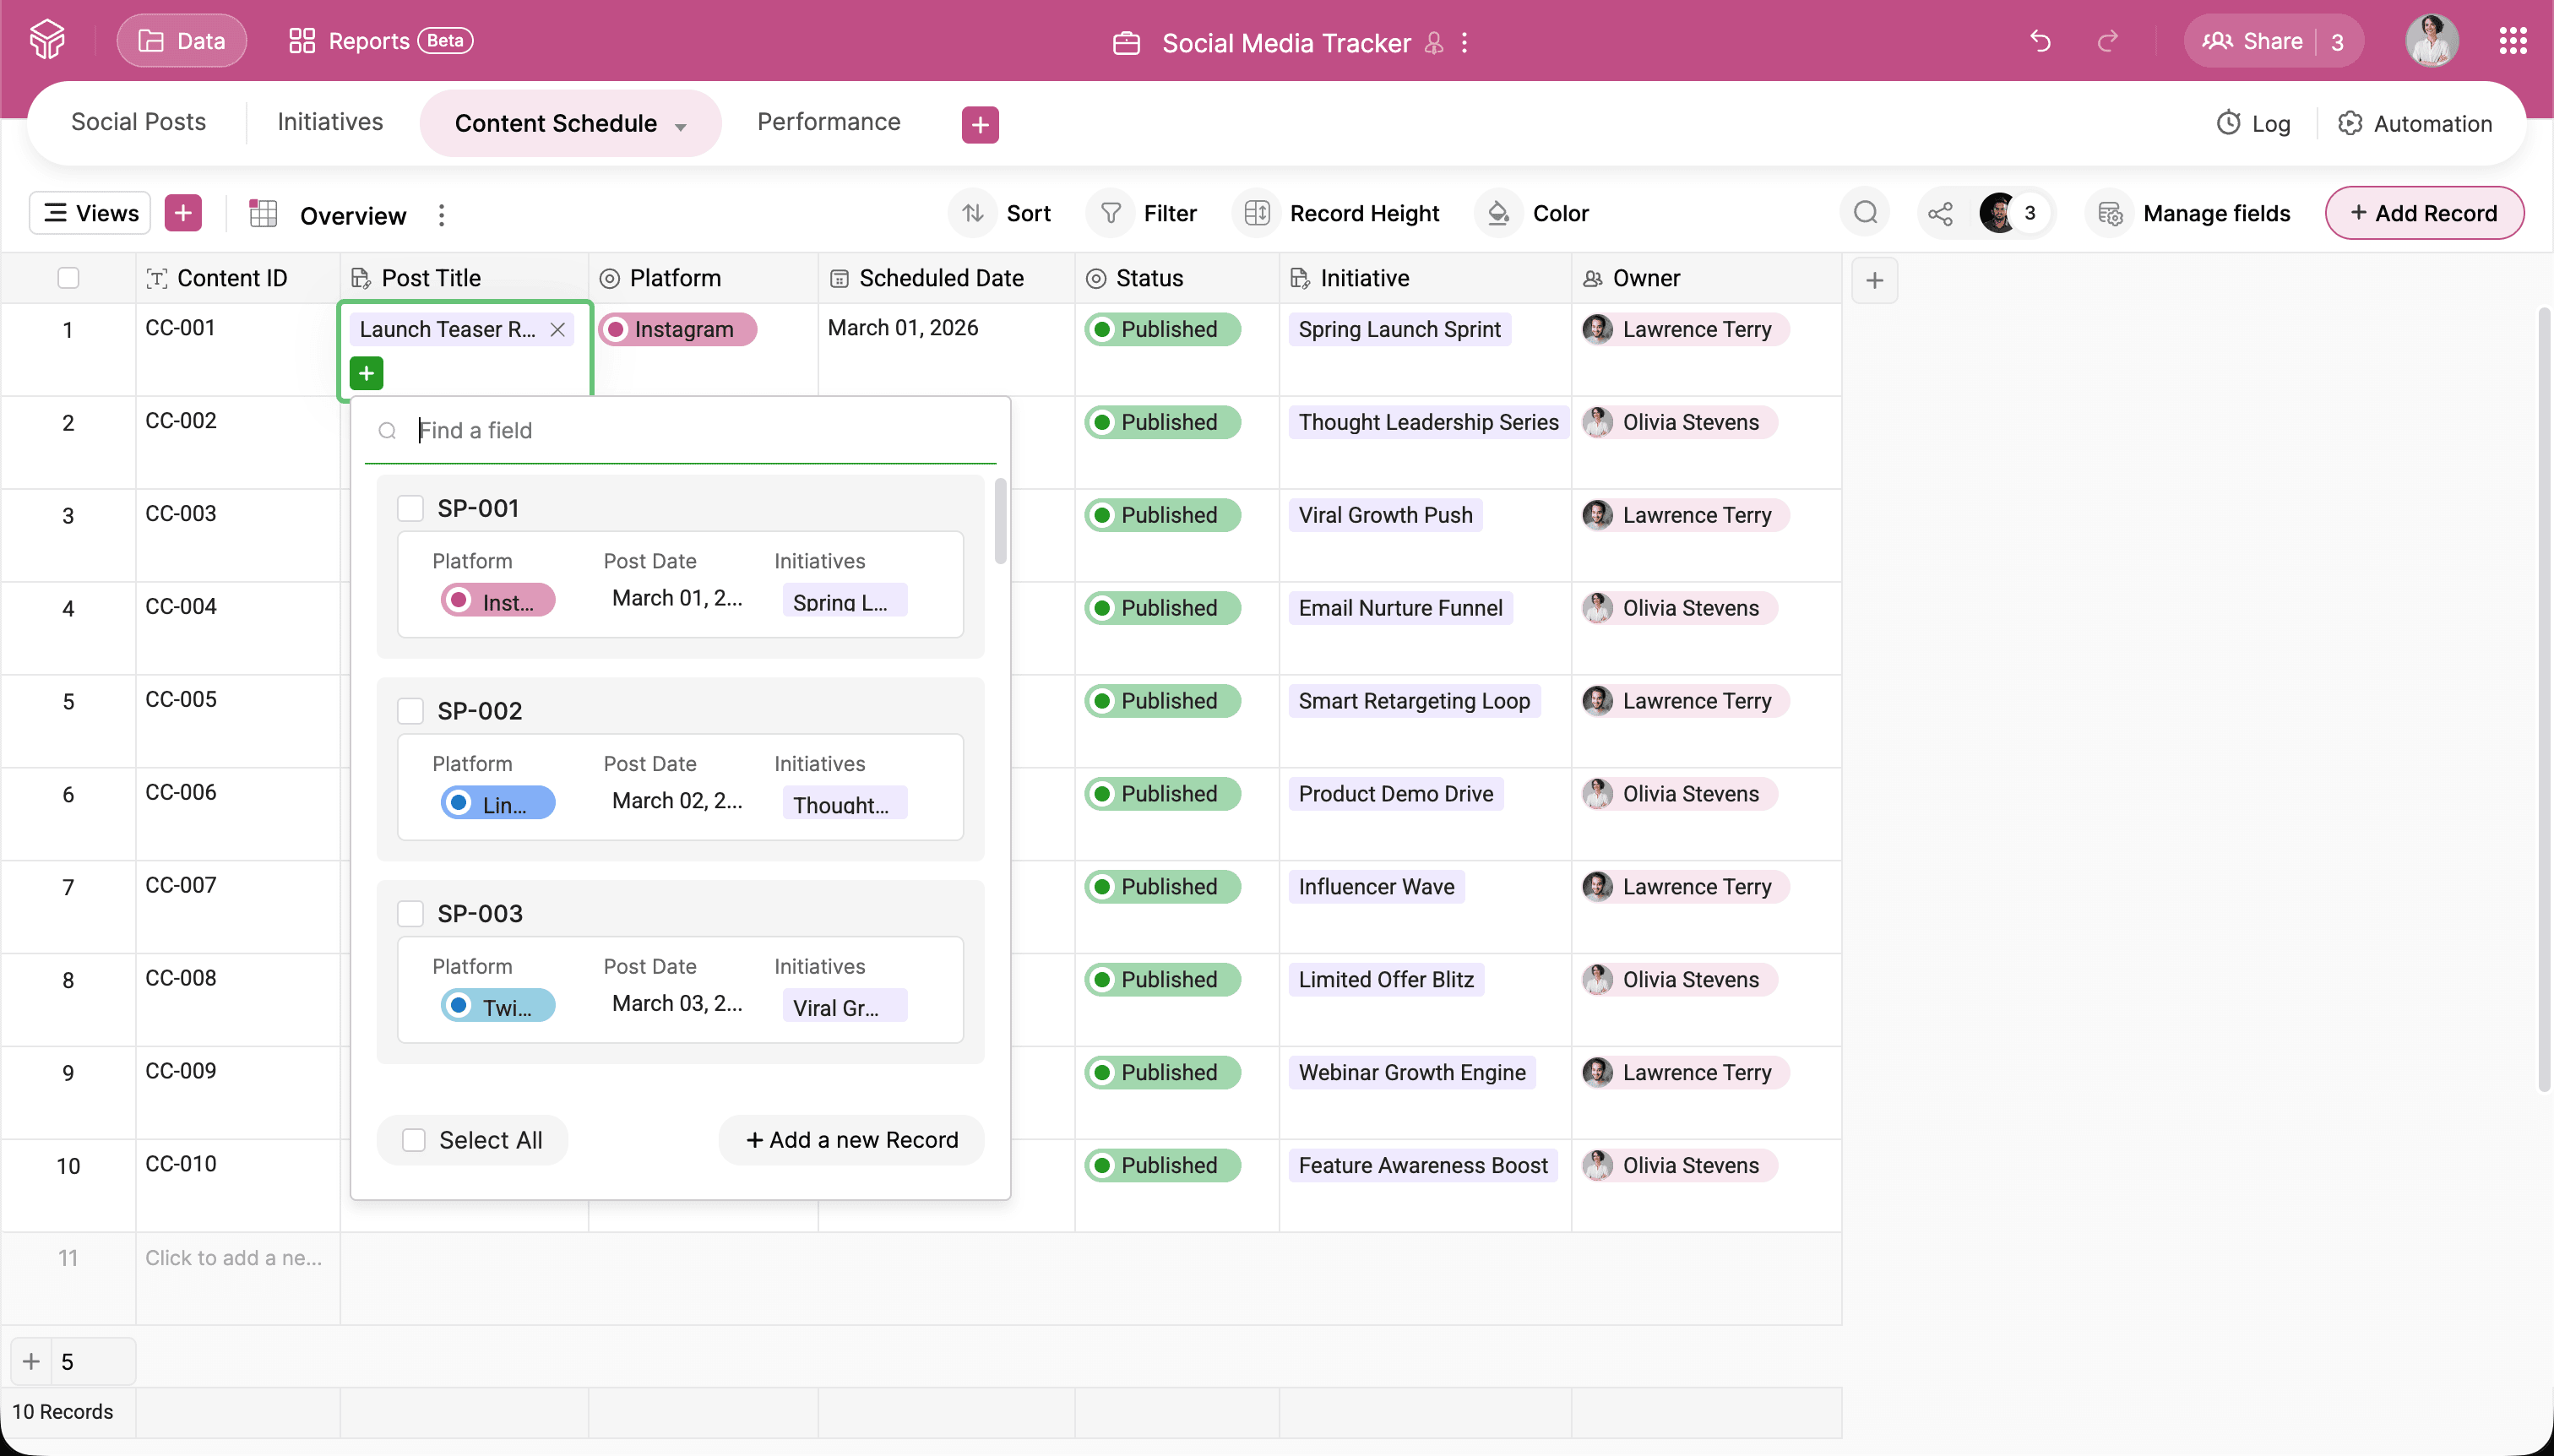
4. Calculate key performance metrics automatically
Use formula fields to automatically calculate engagement rate, CTR, and cost per conversion. This eliminates manual calculations and keeps your performance metrics updated in real time.
For example, you could add the below formula field:
Engagement rate = (Likes + Comments + Shares + Saves) / Impressions * 100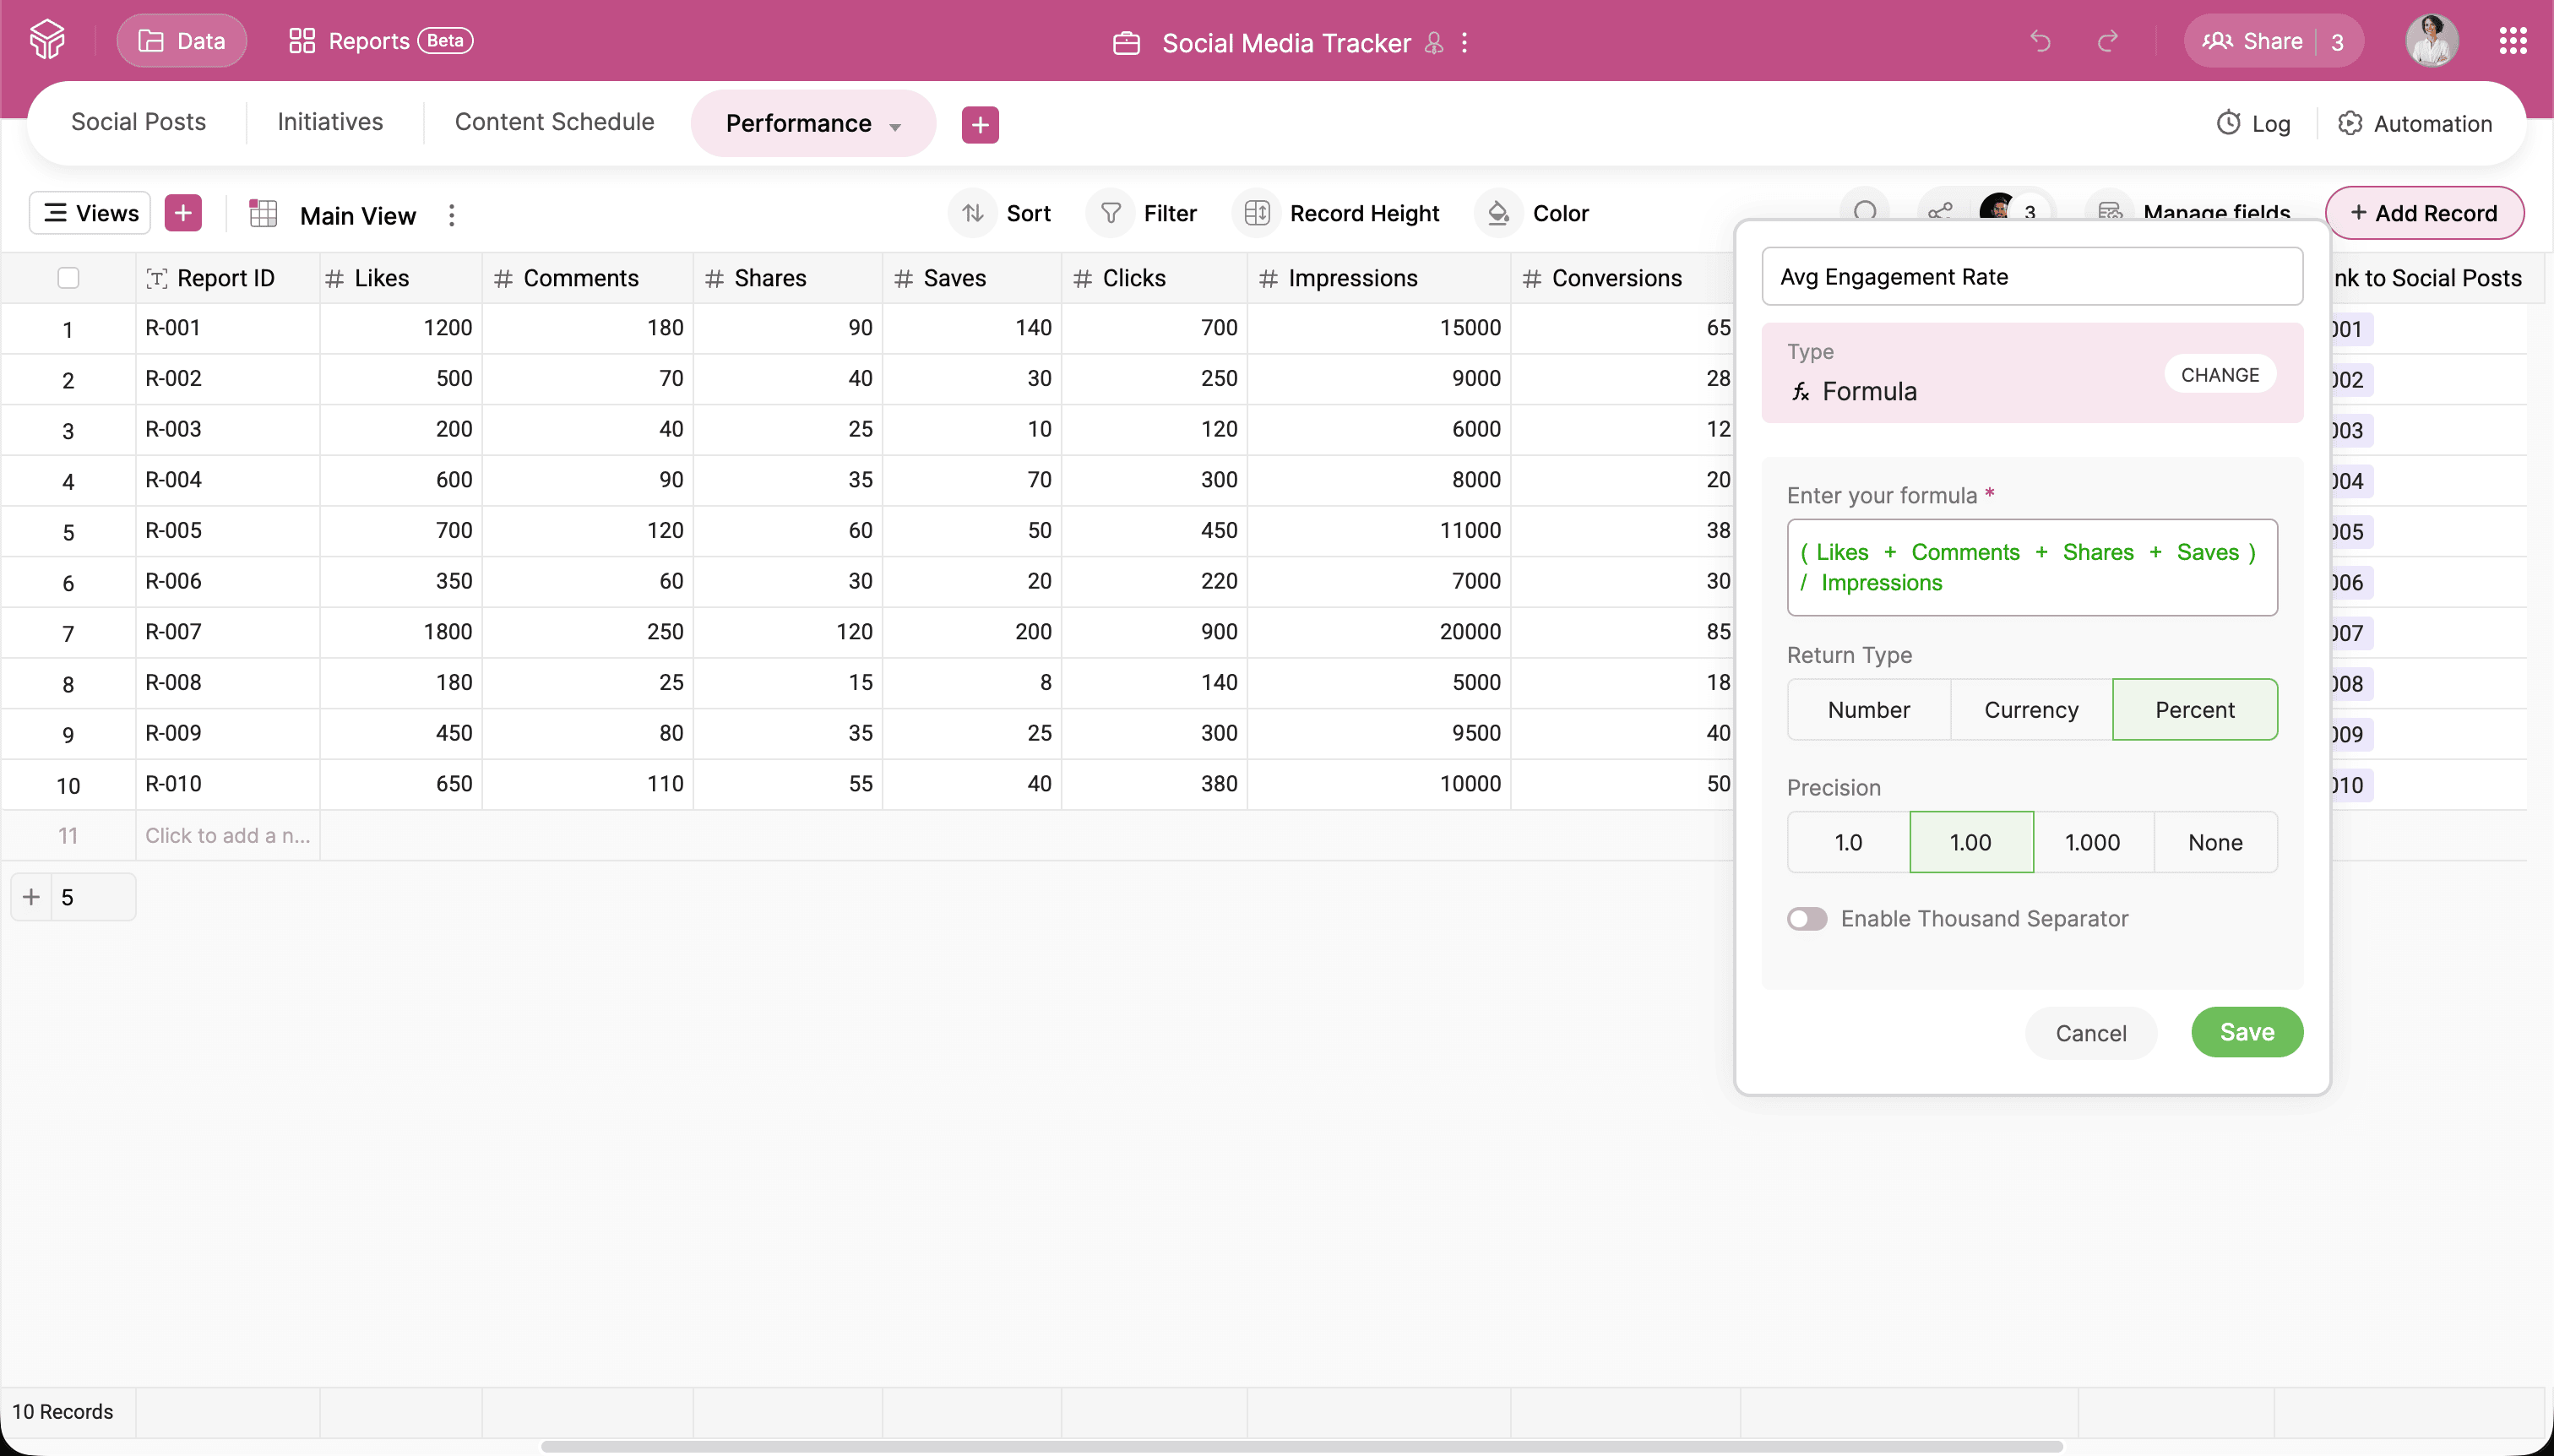
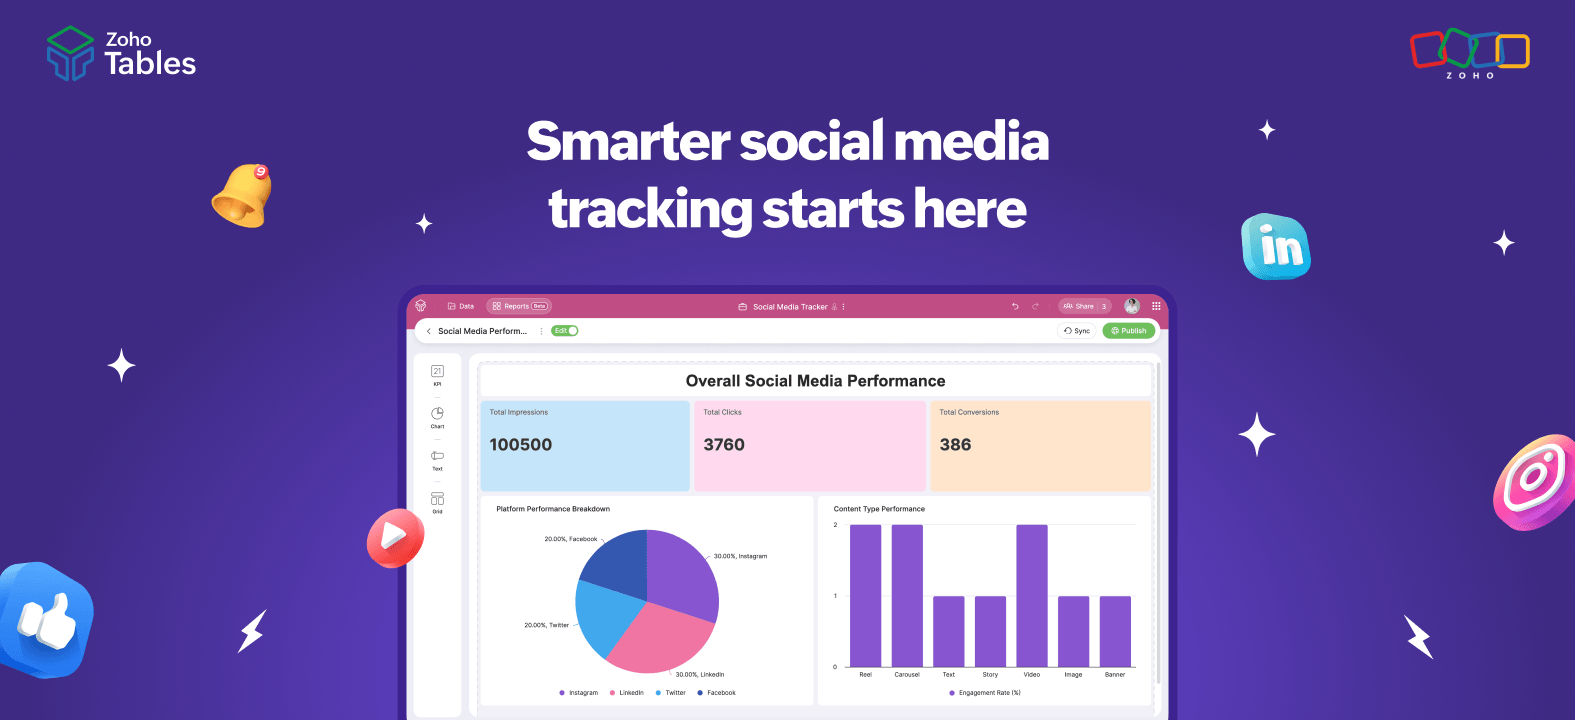
5. Build reports to visualize trends
Turn raw numbers into charts to track engagement trends and growth over time. Reports help you quickly identify what’s improving and what needs attention.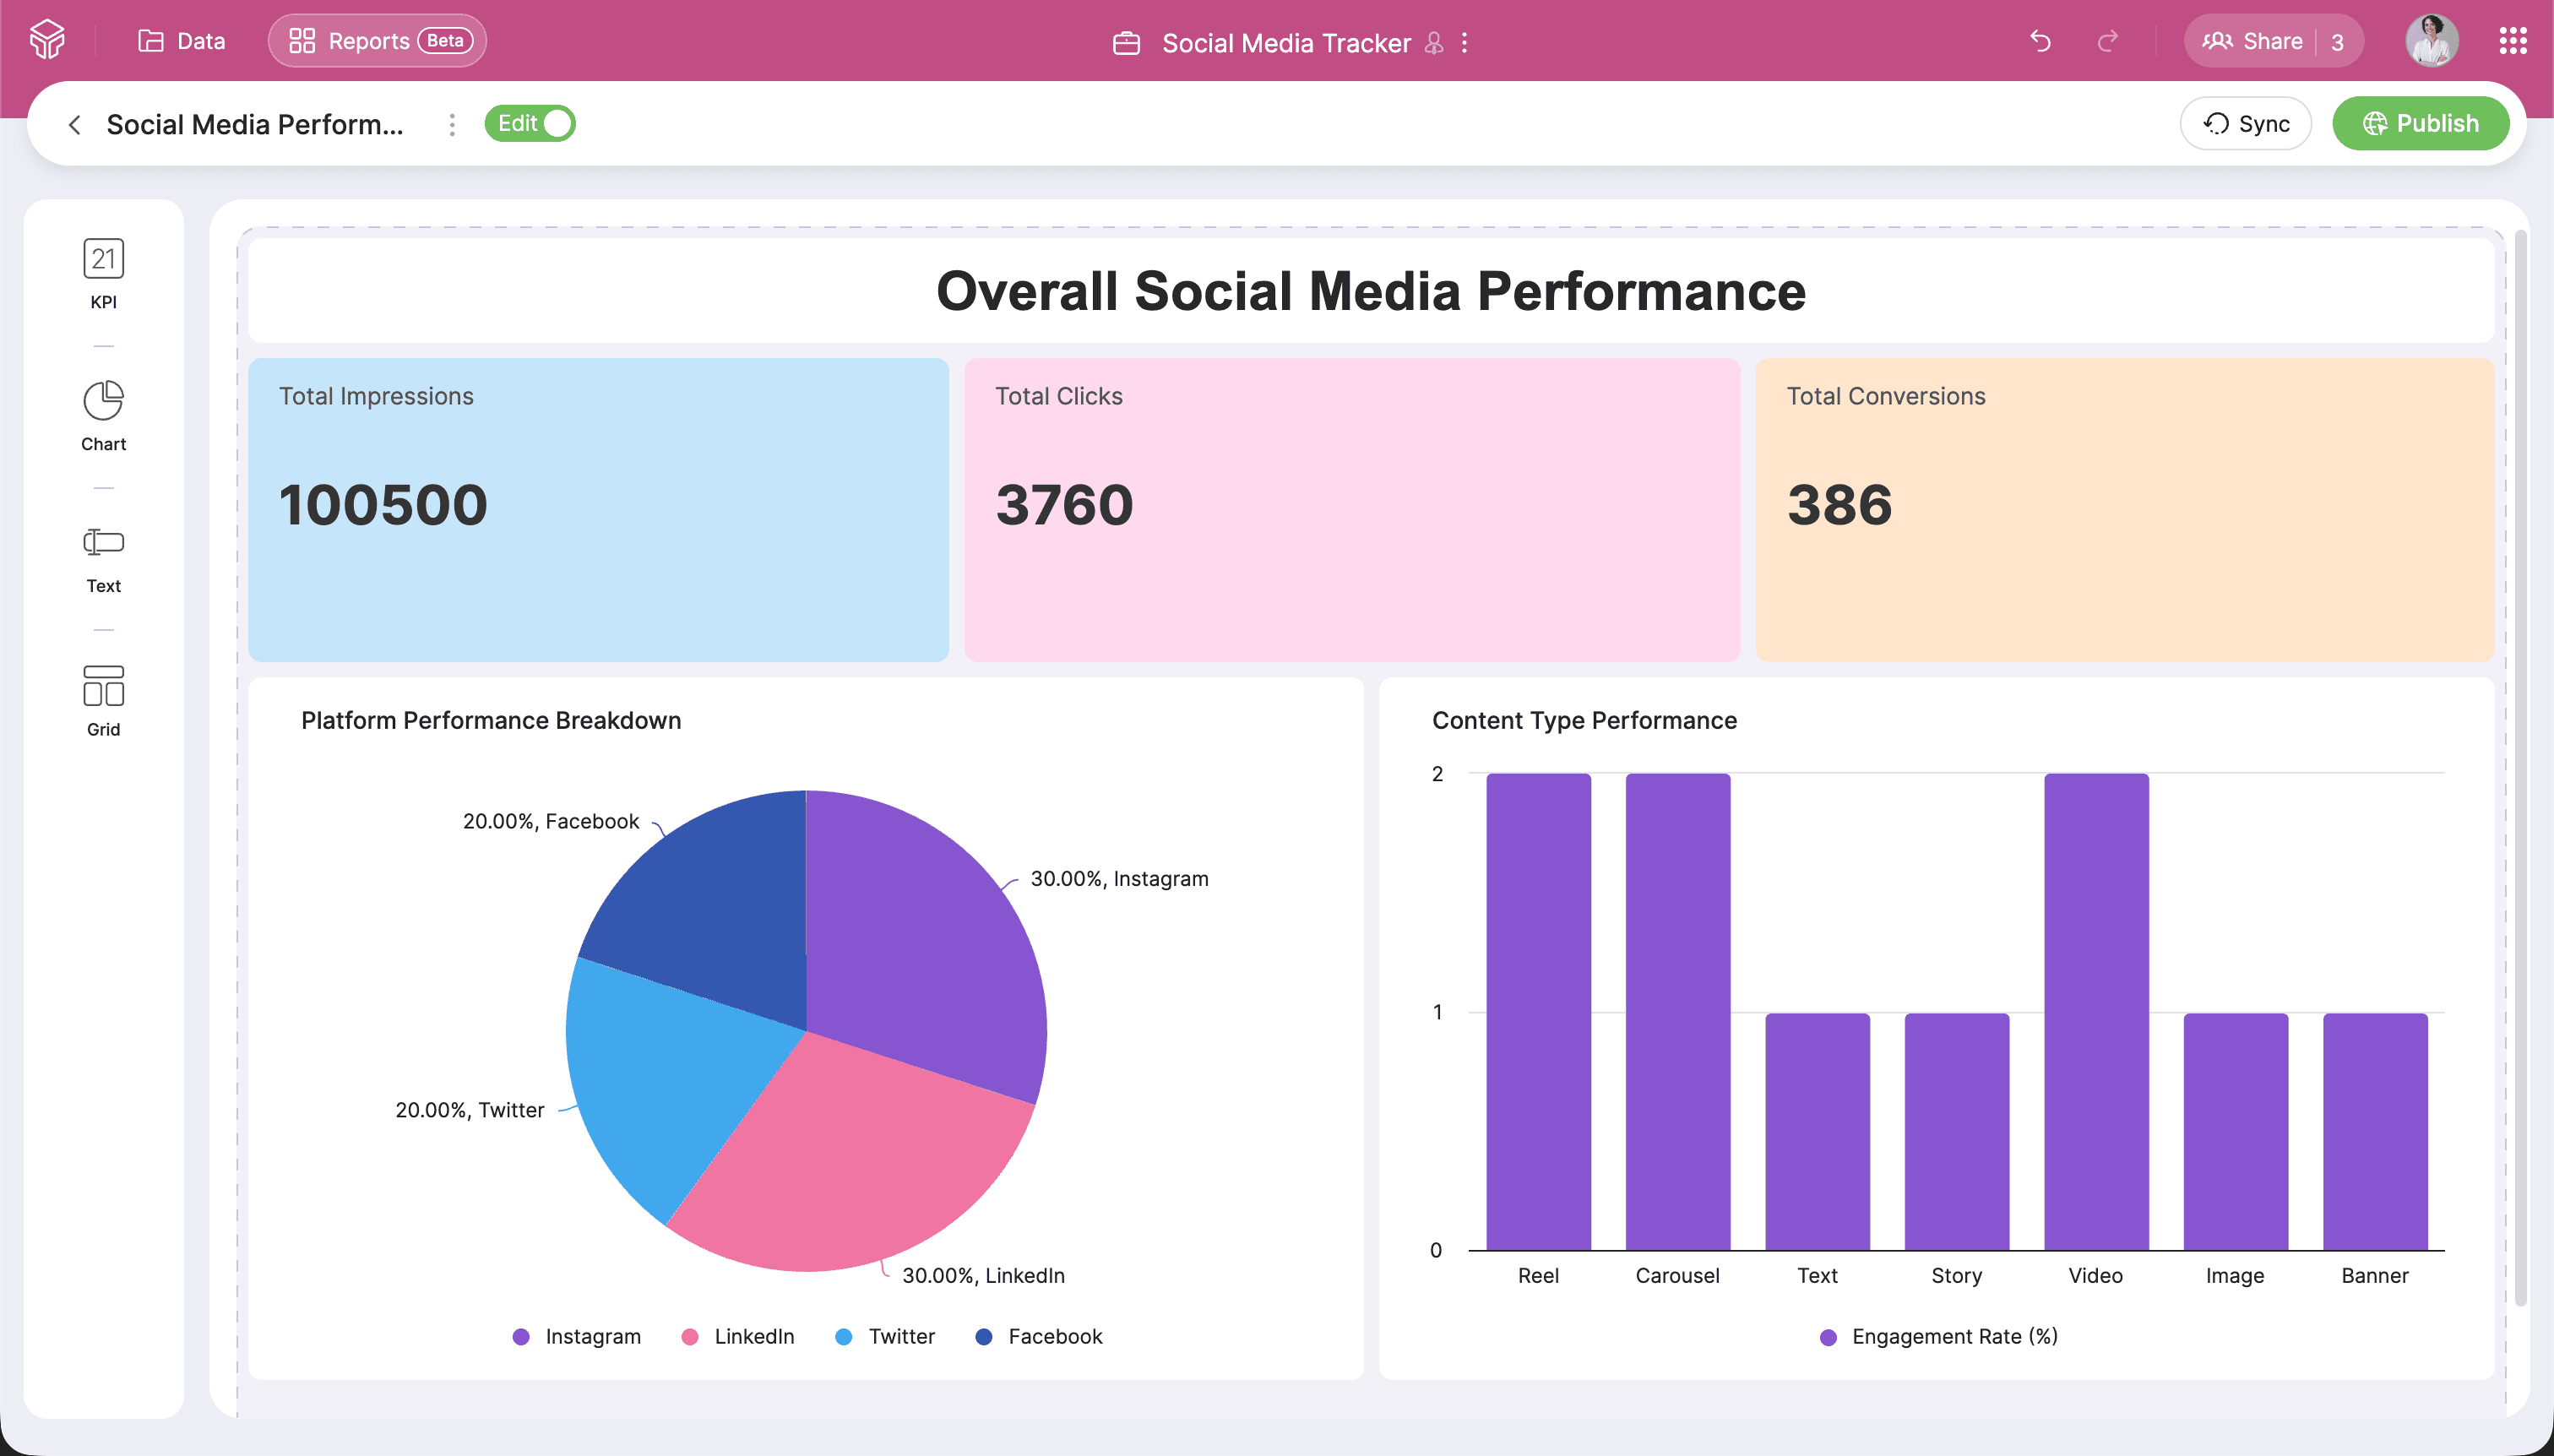
With Zoho Tables, you can bring everything into one connected system, where posts, performance data, and reports all live in one place.
By structuring your data properly, linking related records, and automating key metrics, you not only save time but also gain clearer insights into what’s actually working. Instead of just tracking numbers, you start understanding trends, identifying opportunities, and making better decisions.
Whether you’re managing a few channels or running multiple campaigns at scale, a well-built tracking system helps you stay organized, focused, and data-driven.
Start simple, refine as you go, and let your data guide your strategy.
Try now.
 Merin Mary Jacob
Curious designer turned marketer who loves building products and hoarding cute art stuff.