- HOME
- Best practices
- ZSurvey Announcements
- Zoho Survey in 2025: A year-end recap and reflection
Zoho Survey in 2025: A year-end recap and reflection
- Last Updated : December 26, 2025
- 582 Views
- 6 Min Read
As the year comes to an end, we take a moment to pause and reflect on what 2025 taught us. From feature advancements that equipped teams across industries to move faster and spend less time wrestling with data, to benchmark market research reports that became reference points in discussions on customer behaviour, the year was anything but quiet. This is our reflection on that journey. Let’s take a look back.
Key feature updates that changed how teams managed insights
Survey creation with AI
With AI-assisted survey creation, teams can move from intent to structure faster by using suggested questions and flows as a starting point. This becomes especially valuable when time is limited or teams are exploring unfamiliar topics and don’t yet have the expertise to frame the right questions. By easing the effort required to get started, AI suggestions help users focus less on setup and more on execution and thinking through what they actually want to learn, which ultimately sets up stronger analysis downstream.
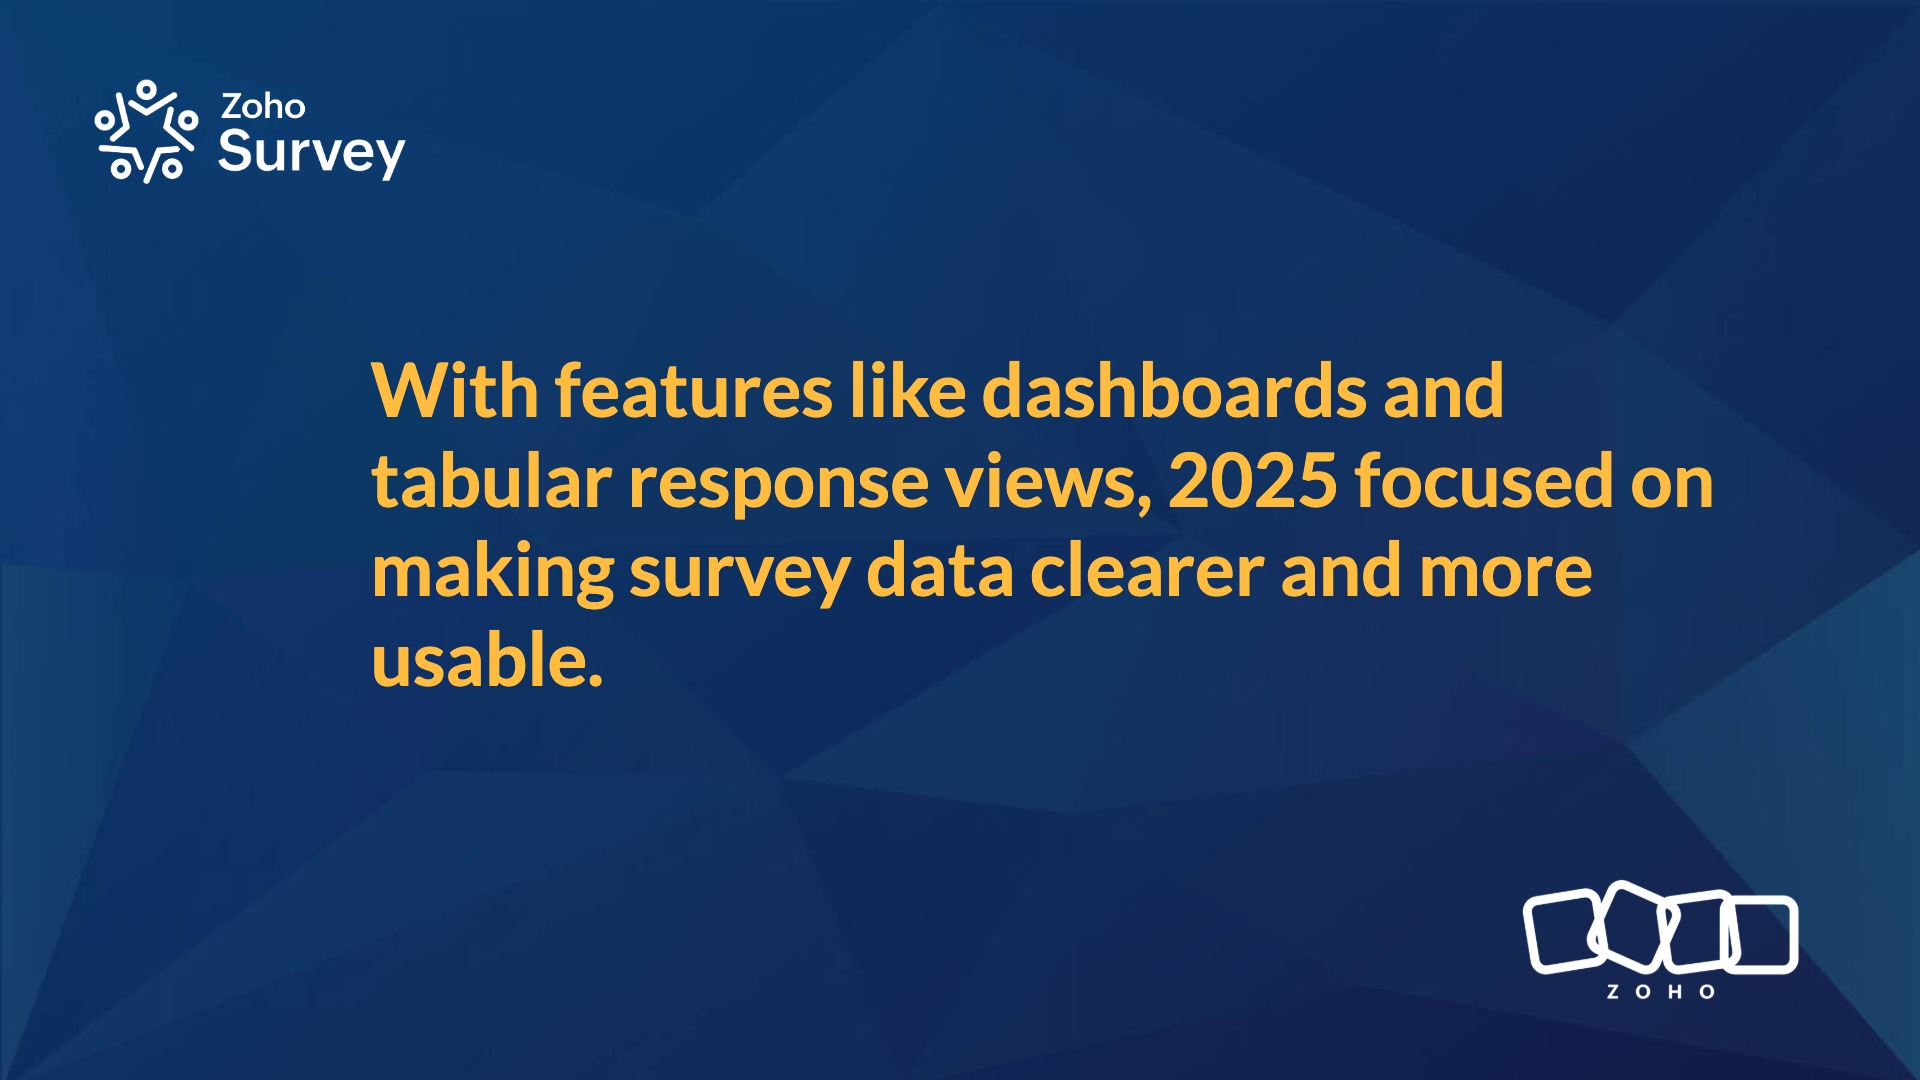
Survey analytics dashboard
Designed with researchers firmly in mind, survey dashboards make it significantly easier to visualize survey data and and work toward meaningful insights. With flexible filters and an intuitive interface, teams can slice and dice data across multiple dimensions to surface patterns and relationships that often stay hidden in static reports. Just as importantly, dashboards simplify how insights are shared. Difficult data exports, screenshots, or back-and-forth explanations can now be communicated clearly and easily with stakeholders and collaborators.
Individual responses in a tabular view
By presenting survey responses in a familiar, spreadsheet-like format directly within the product, tabular view makes it easier for users to review, validate, and work closely with raw data without switching tools. Scanning responses, flagging low-quality entries, and identifying usable data becomes a more natural part of the workflow. For teams handling large volumes of survey responses, a tabular view ensures that what moves into analysis is data they can actually trust.
Translating multilingual feedback
Translating responses is often a critical feature for teams that need to work with open-ended feedback. Having translation built directly into the platform ensures users can read, review, and analyze responses without relying on external tools. This is especially valuable in studies that span regions or languages, where open-ended answers often carry nuance in phrasing and tone. It ensures that rich insights weren’t diluted, delayed, or overlooked, simply because they are expressed in a different language.
HubSpot integration
Survey insights are most useful when they don’t live in isolation and the HubSpot integration helps close that gap. By connecting survey responses directly with customer and lead data in HubSpot, teams can see feedback in context rather than looking at standalone results. This becomes particularly useful when marketing or CX teams are trying to understand how feedback ties back to specific campaigns, lifecycle stages, or customer journeys.
Zoho Desk integration
Customer feedback is most useful when it’s closely tied to service interactions, and the Zoho Desk integration works in both directions. Teams can trigger surveys from Desk to capture feedback immediately after support interactions, which helps them close the loop while the experience is still fresh. At the same time, low survey ratings can automatically surface as tickets in Zoho Desk, ensuring that critical feedback doesn’t sit in reports but reaches support teams when attention is needed.
SMS triggers for better workflows
The introduction of Trigger SMS makes it possible to notify teams the moment a new survey response is received. For scenarios where delays reduce the value of the response, such as customer support, field feedback, or time-sensitive studies, SMS ensures important notifications don't sit unnoticed in inboxes or reports.
SMS distribution without third-party dependencies
By connecting directly with Zoho SMS, teams can now send survey links via text without relying on third-party SMS providers. This reduces setup complexity, avoids external handoffs, and keeps survey distribution within the same ecosystem as survey creation and analysis.
Viewing response percentage at a glance
With the introduction of percentage bars in response summaries, teams can now see how answers are distributed without having to scan numbers line by line. Representing response percentages visually and aligning bar colors is particularly useful when reviewing results at a glance or delivering an executive summary to other stakeholders. (in the table)
Scheduling reports: File Transfer Protocol (FTP) and Dropbox
With expanded delivery options for scheduled reports, teams can now push survey reports directly to external destinations like File Transfer Protocol servers or Dropbox, instead of relying only on email delivery. This matters most for teams that rely on shared drives, automated pipelines, or archival systems to manage data at scale. By placing reports directly where teams already store and process information, scheduled reporting fits more naturally into existing analytics and reporting workflows. (box.com)
Gauging question difficulty
Question difficulty ranking adds another layer by showing which questions were genuinely challenging and which ones were easier for respondents to answer. This is especially useful in assessments, training evaluations, or knowledge checks, where low scores may reflect unclear questions rather than lack of understanding. Viewing difficulty alongside scores helps teams refine question design and draw more accurate conclusions from results.
Filtering responses based on scores
With enhanced scoring capabilities, researchers can now filter responses based on scores, making it easier to focus on specific segments of interest. Whether it’s isolating high performers on tests, identifying low-scoring responses that need attention, or narrowing analysis to a defined score range, this added flexibility helped teams move beyond overall averages and work with survey data more deliberately.
Expanding audience reach within India
With additional target regions added to the audience panel, researchers now get access to a broader set of cities beyond the usual metros. This makes it easier to design studies that better reflect regional diversity, capture local nuances, and reach audiences that are often under-represented in national samples.
Making question restructuring easy
With drag-and-drop reordering of answer choices, researchers can now adjust the sequence of options as a survey takes shape without deleting and re-adding choices or relying on copy-paste workarounds. This is helpful when surveys evolve during review cycles or pilot runs, where small changes to option order can improve clarity or reduce bias.
Beyond product improvements, 2025 was also about generating insights that could serve as industry benchmarks or reference points.
A 2025 research highlight: NPS benchmarking across Indian industries
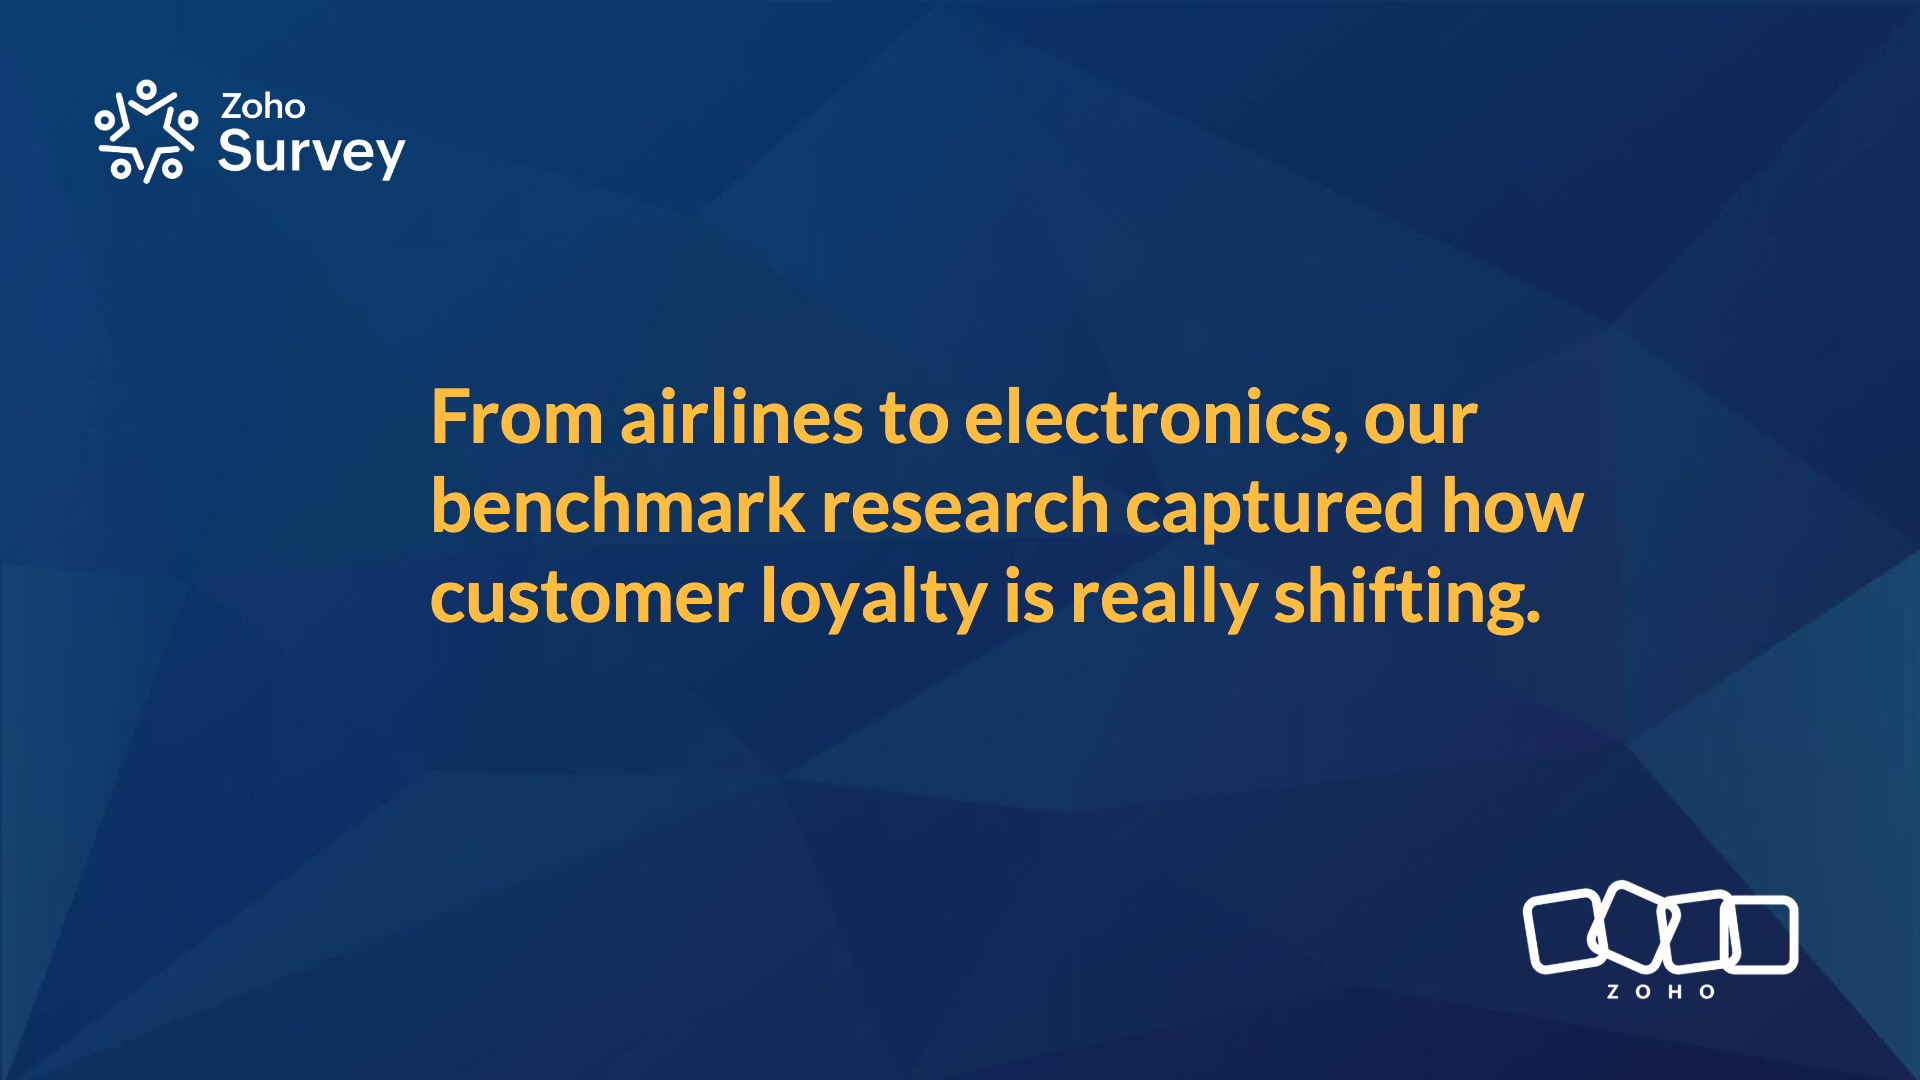
One of the most significant research efforts we published in 2025 focused on NPS benchmarking across key industries in India. This study looked at customer loyalty across three major sectors—airlines, electronics, and automobiles to provide a comparative view of how brands performed across different journeys and touchpoints. Rather than treating Net Promoter Score as a standalone metric, the report placed loyalty in context, helping teams understand what “good” looks like within their specific industry.
When market research guided decisions across Zoho
Teams working on products across very different domains (from contract management to security tools, browsers, and password vaults) turned to Zoho Survey to better understand the markets they operated in. Despite the diversity of industries, it was striking how much their questions focused on similar themes: where do we stand today, how aware are users of our brand, and what impact are our marketing and advertising efforts actually having? By grounding decisions in structured research, teams were able to move beyond assumptions and get clearer signals on market position, brand perception, and return on marketing investment.
If you’d like to explore these themes further, you can find all our 2025 research reports compiled here.
Beyond the product: The conversations we had
Some of the clearest signals in 2025 came from direct conversations with practitioners.
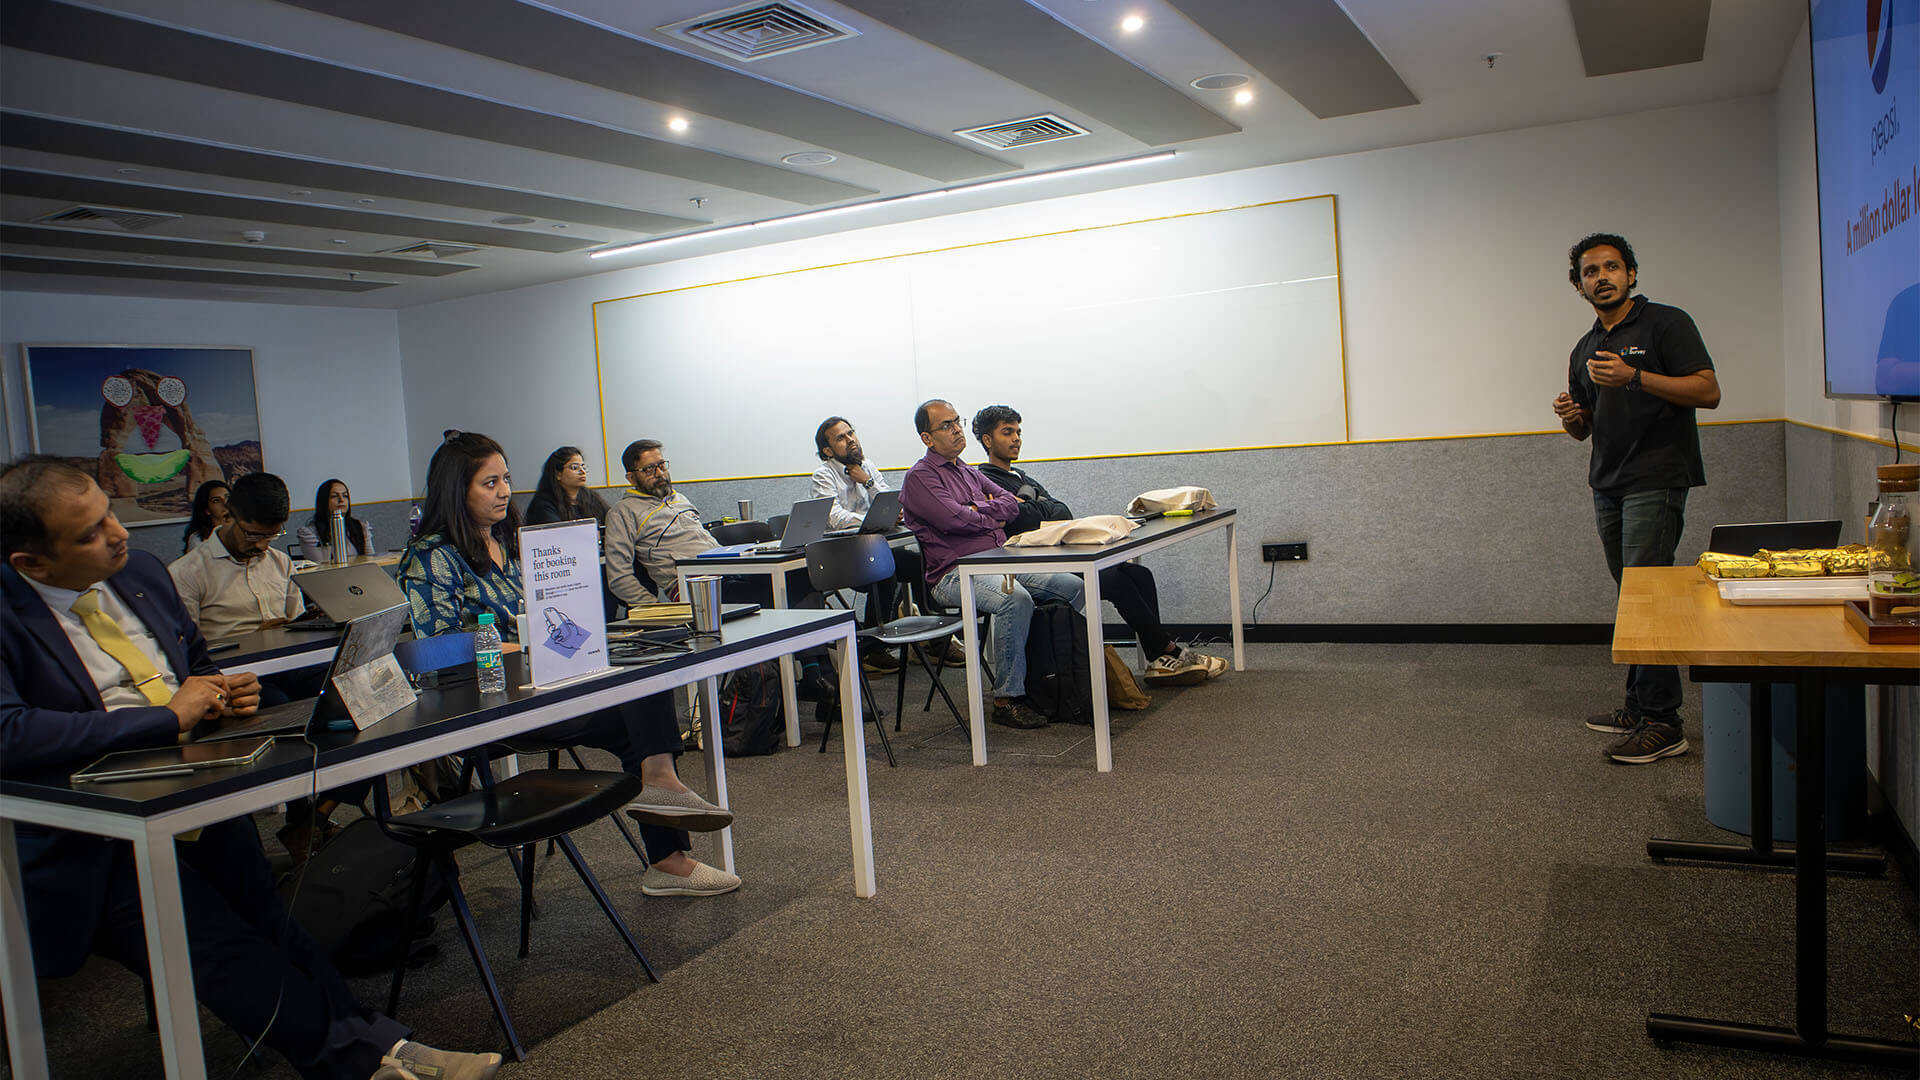
At the Zoho Marketing Bootcamp (Mumbai), we conducted a session for marketers (both new and experienced) on how surveys can support different stages of the customer journey, from discovery to retention.
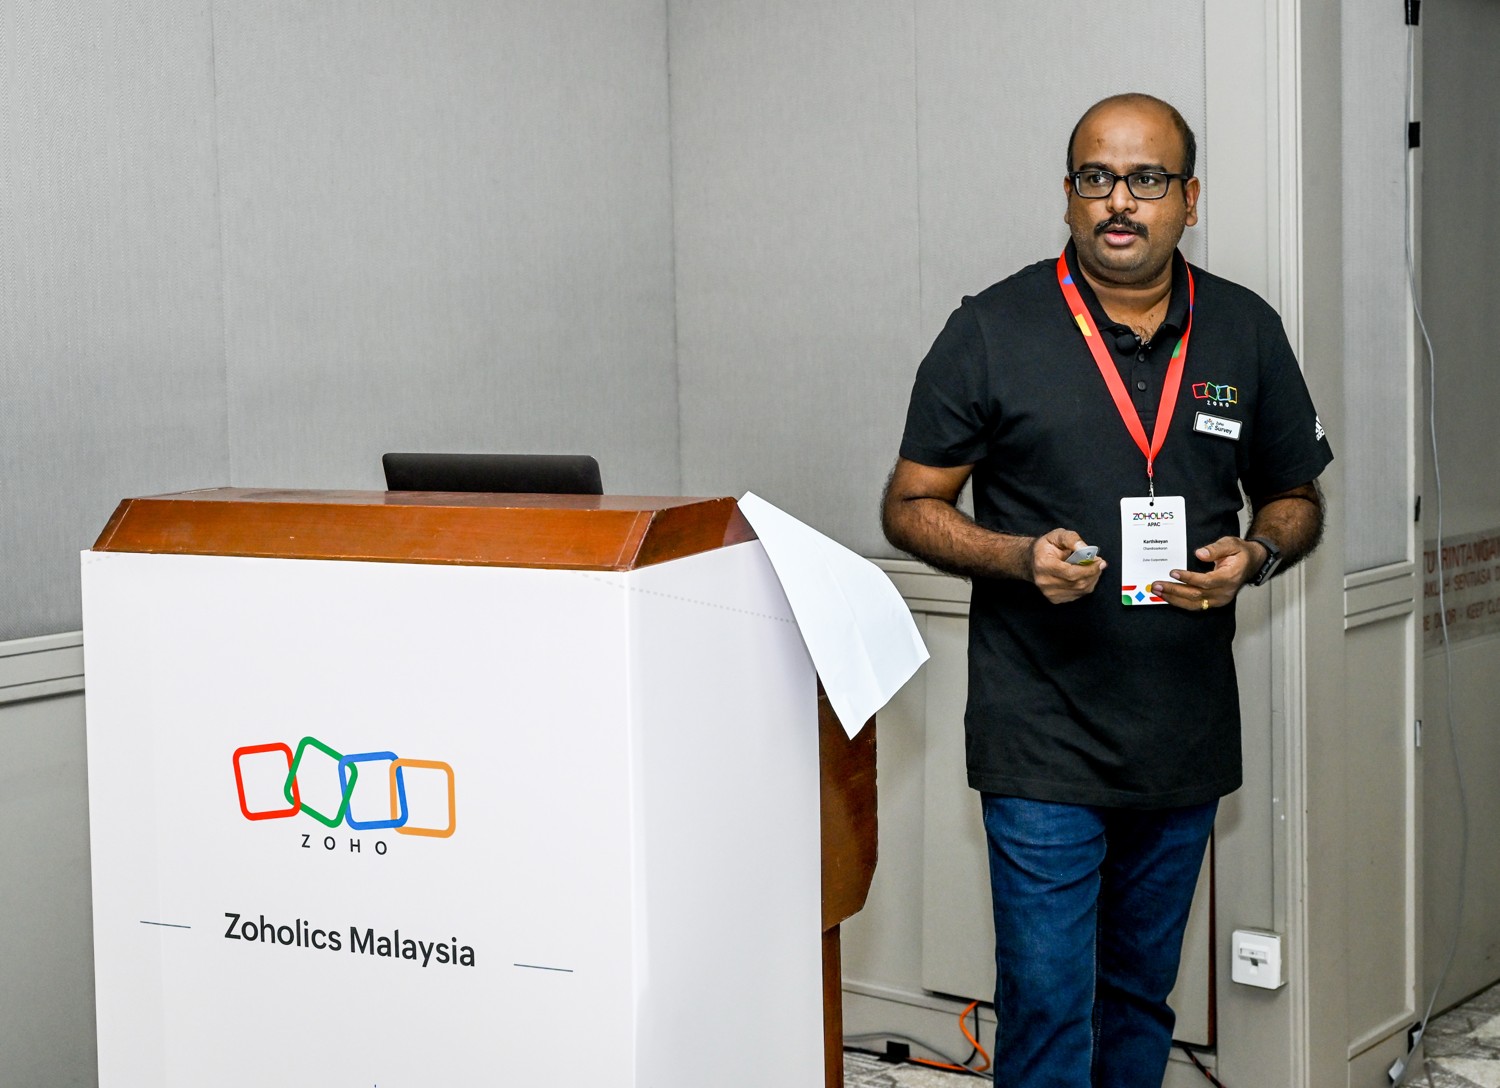
Later in August, at Zoho’s flagship event, Zoholics in Malaysia, we showcased how surveys can be utilized to measure customer happiness and sentiment in a way that goes beyond surface-level metrics.
Looking ahead
As professionals continue to rely on surveys to understand markets, measure experience, and make sense of feedback at scale, the need isn’t just for more data, but for better ways to work with it.
That’s where Zoho Survey continues to focus: helping teams design thoughtful research, connect insights across systems, and move from responses to understanding with confidence. That’s how we’re carrying forward the lessons we learned in 2025: by continuing to ask better questions and listening just a little more closely!
Ready to explore what your surveys can reveal?