We are excited to announce the all-new Zoho Analytics 3.0, with a sleek new interface and loads of new features.
New UI
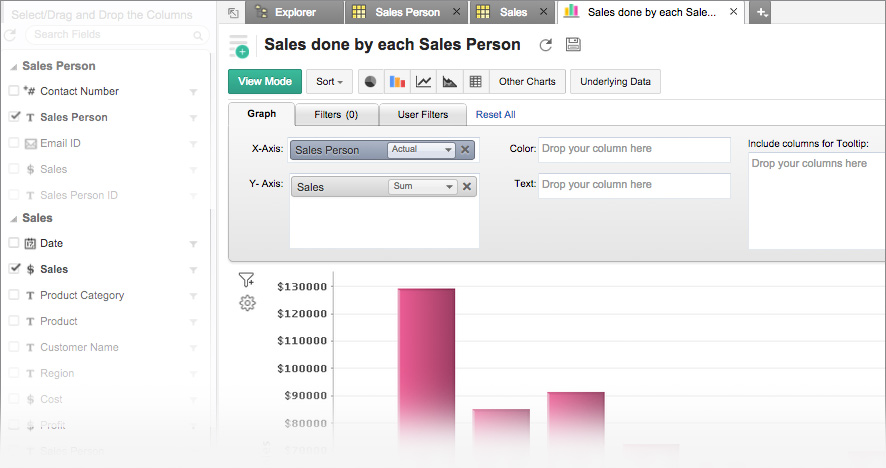
The user interface has been completely revamped. Zoho Analytics 3.0 offers an enhanced user experience, designed for power users and beginners alike, to quickly and easily create fabulous reports.
New connectors
We are also announcing the availability of new data connectors for the following popular business applications, including:
- Google Analytics
- Salesforce
- ManageEngine ServiceDesk Plus
This adds to an already robust set of data connectors that Zoho Analytics already supports, such as Zoho CRM, Projects, Creator, Recruit, Google Drive, Box, Dropbox and Microsoft OneDrive. If that’s not enough, we’ve got more data connectors coming down the pike, including Zendesk. Stay tuned!
Drill down
The ability to drill down on any data point in a chart, pivot table or summary view has always been a popular feature for Zoho Analytics users. Now, it just got even better.
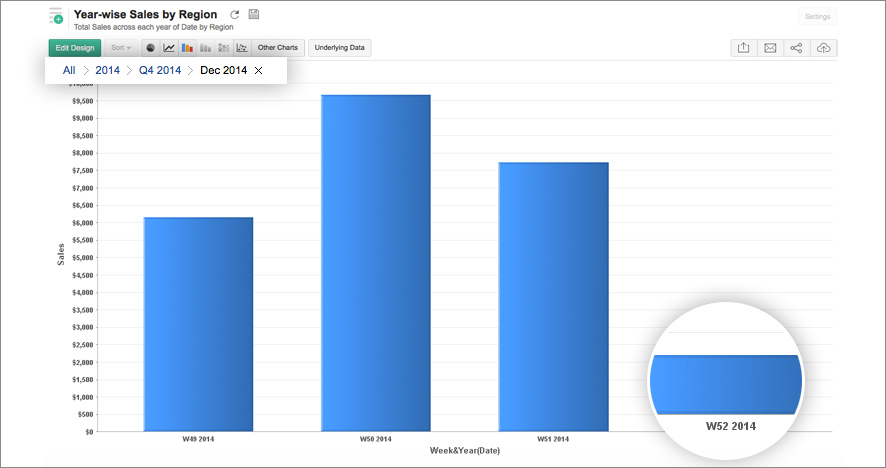
In this release, we are introducing an exploratory drill down feature within charts. This feature enables you to click on any data point in the chart and visualize the underlying data in a new chart.
For example, if you have plotted sales over several years, you can now drill down and easily view sales by quarter, month or week in a new chart, simply by clicking on the related data point.
KPI widgets in dashboards
Your love for dashboards is bound to go up hearing this. Yes, you can now have those large KPI numbers displayed at the top of your dashboards. These single number view components with up or down trend indicators, provide a quick & easy visualization of any data metric. You can add any number of KPI widgets in a dashboard.

Slide shows
Many of our customers use Zoho Analytics to display reports & dashboards on large TV screens, for a live view of important metrics and trends.
So far, we supported the large screen TV projection option with auto refresh interval for a single report or dashboard. We are now enhancing this with a new slide show feature. Reports & dashboards stacked as a slide deck can be played in a loop on your large TV screens or any device. This makes monitoring multiple metrics much easier.

Apart from projecting on large screens, you can embed slide shows in any web page too.
Model diagrams
With Zoho Analytics, you can design your reporting database by connecting different data tables. With the new model diagrams, Zoho Analytics now allows you to see the overall design of your database – how the tables are connected with each other, and which column looks up which other columns.
The model diagrams can be viewed for the overall reporting database, or at a specific data table level. The built-in zoom in/out and panning feature helps you to easily navigate and visualize your database model.

Other than the enhancements listed above, we have added many more improvements across the product. Try the new Zoho Analytics 3.0. Do share your experience in the comments section.
The Model Diagram Feature, sorry. The model Diagram feature doesn't work on any of my tables.
This feature doesnt work on any of my tables. just shows the current table and nothing else.