Analytics Integration
There are 2 types of integrations that are available for analytics:
Analytics
Advanced People Analytics
Analytics
To view all the reports under Analytics, click Reports at the bottom left corner of your screen and navigate to the Analytics tab.
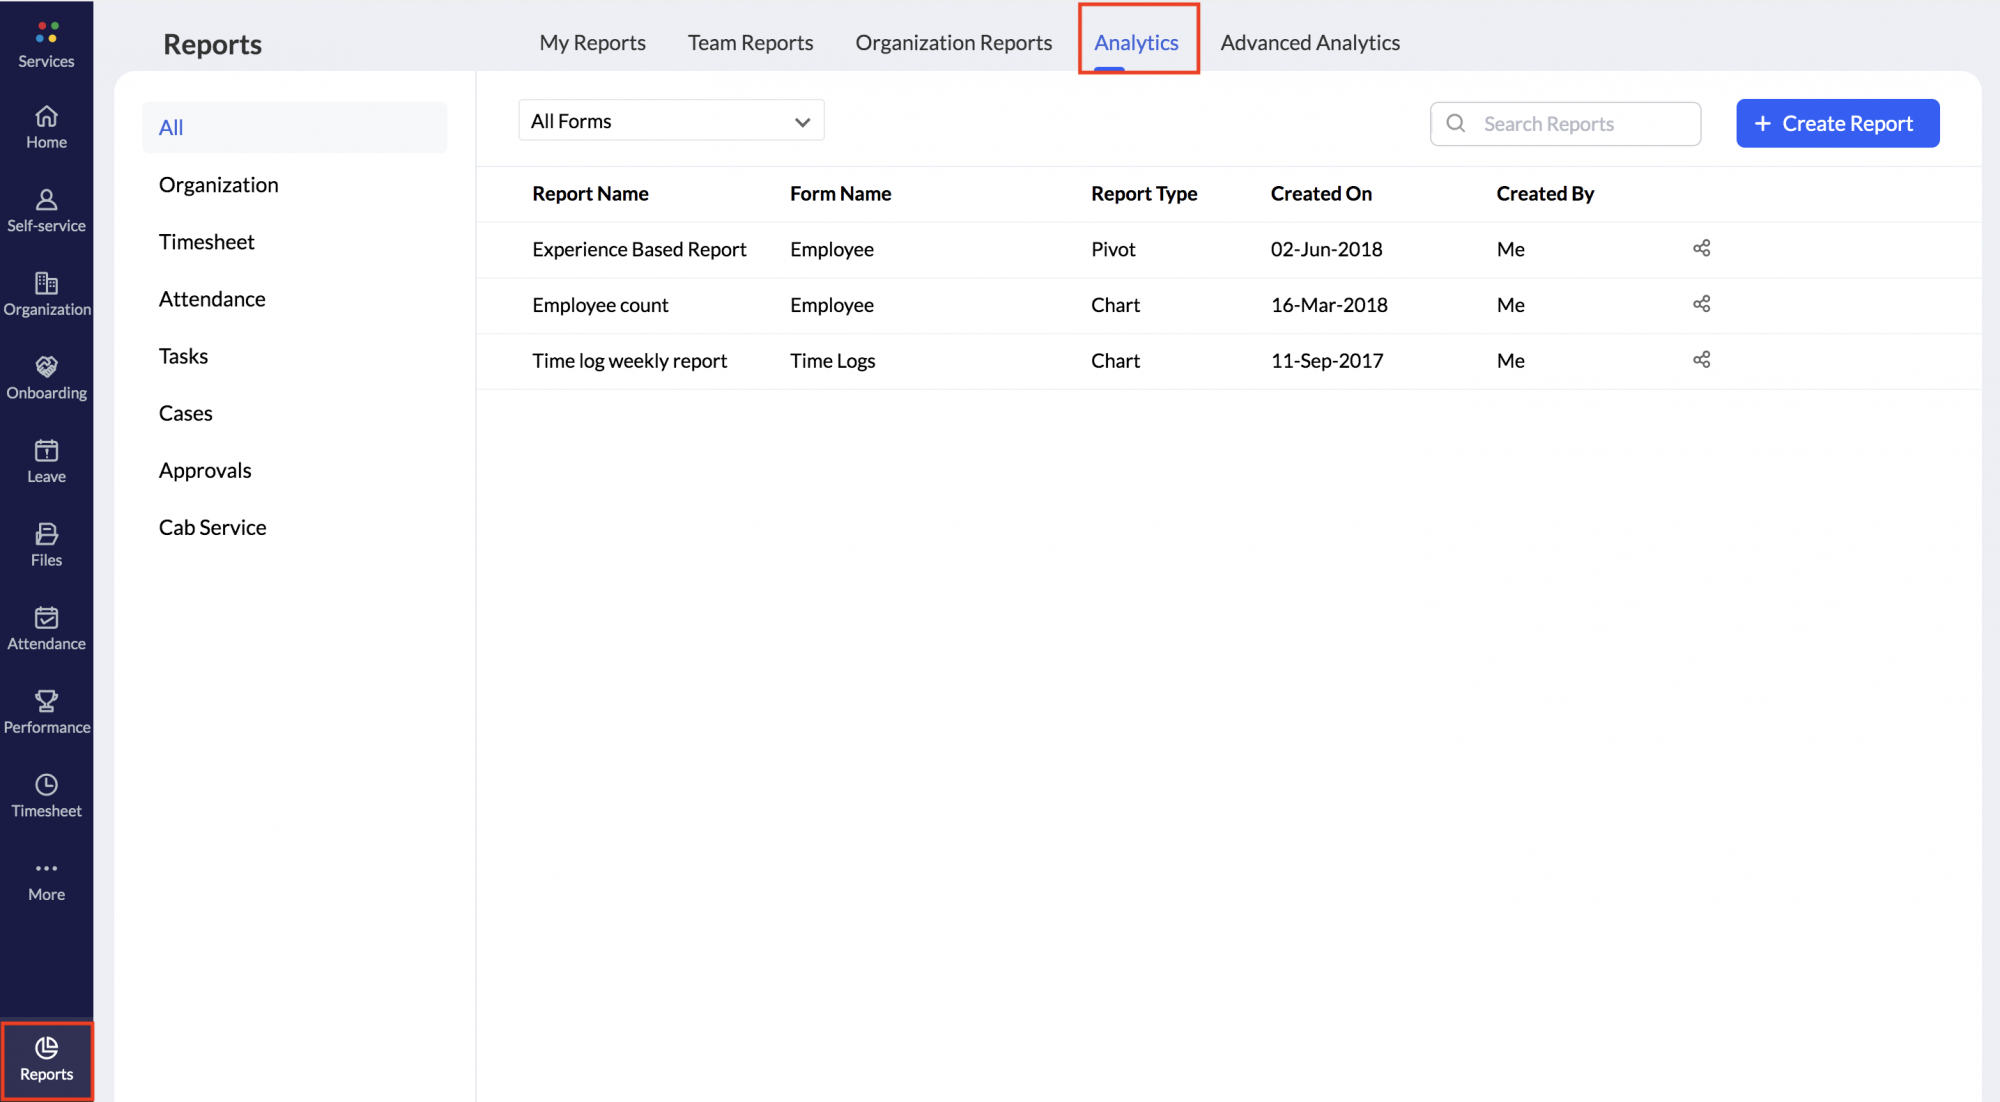
There are extensive reports available in each module like Attendance and Timesheet to suit your requirements. You can make use of the filter icon under reports of each of these modules and generate reports based on your need.
Zoho People's integration with Zoho Analytics lets you create custom reports. The Analytics module helps you generate reports based on your need.
- Generating a Report
- Editing a created Report
- Deleting a Report
- Sharing a Report to Users
- Report Scheduler
- Exporting a Report
- Analytics owner - changing ownership
Important points to note regarding Analytics in Zoho People:
- Daily data sync is not possible for the attendance service in Zoho People.
- Pay period configuration is mandatory to generate attendance reports.
- Attendance data sync will happen only after the end of the configured pay period and hence reports can be generated only at the end of the configured pay period.
- For employees with unmatched pay periods, attendance data sync takes place at the end of each month.
Generating a Report
Follow the steps given below to generate a report
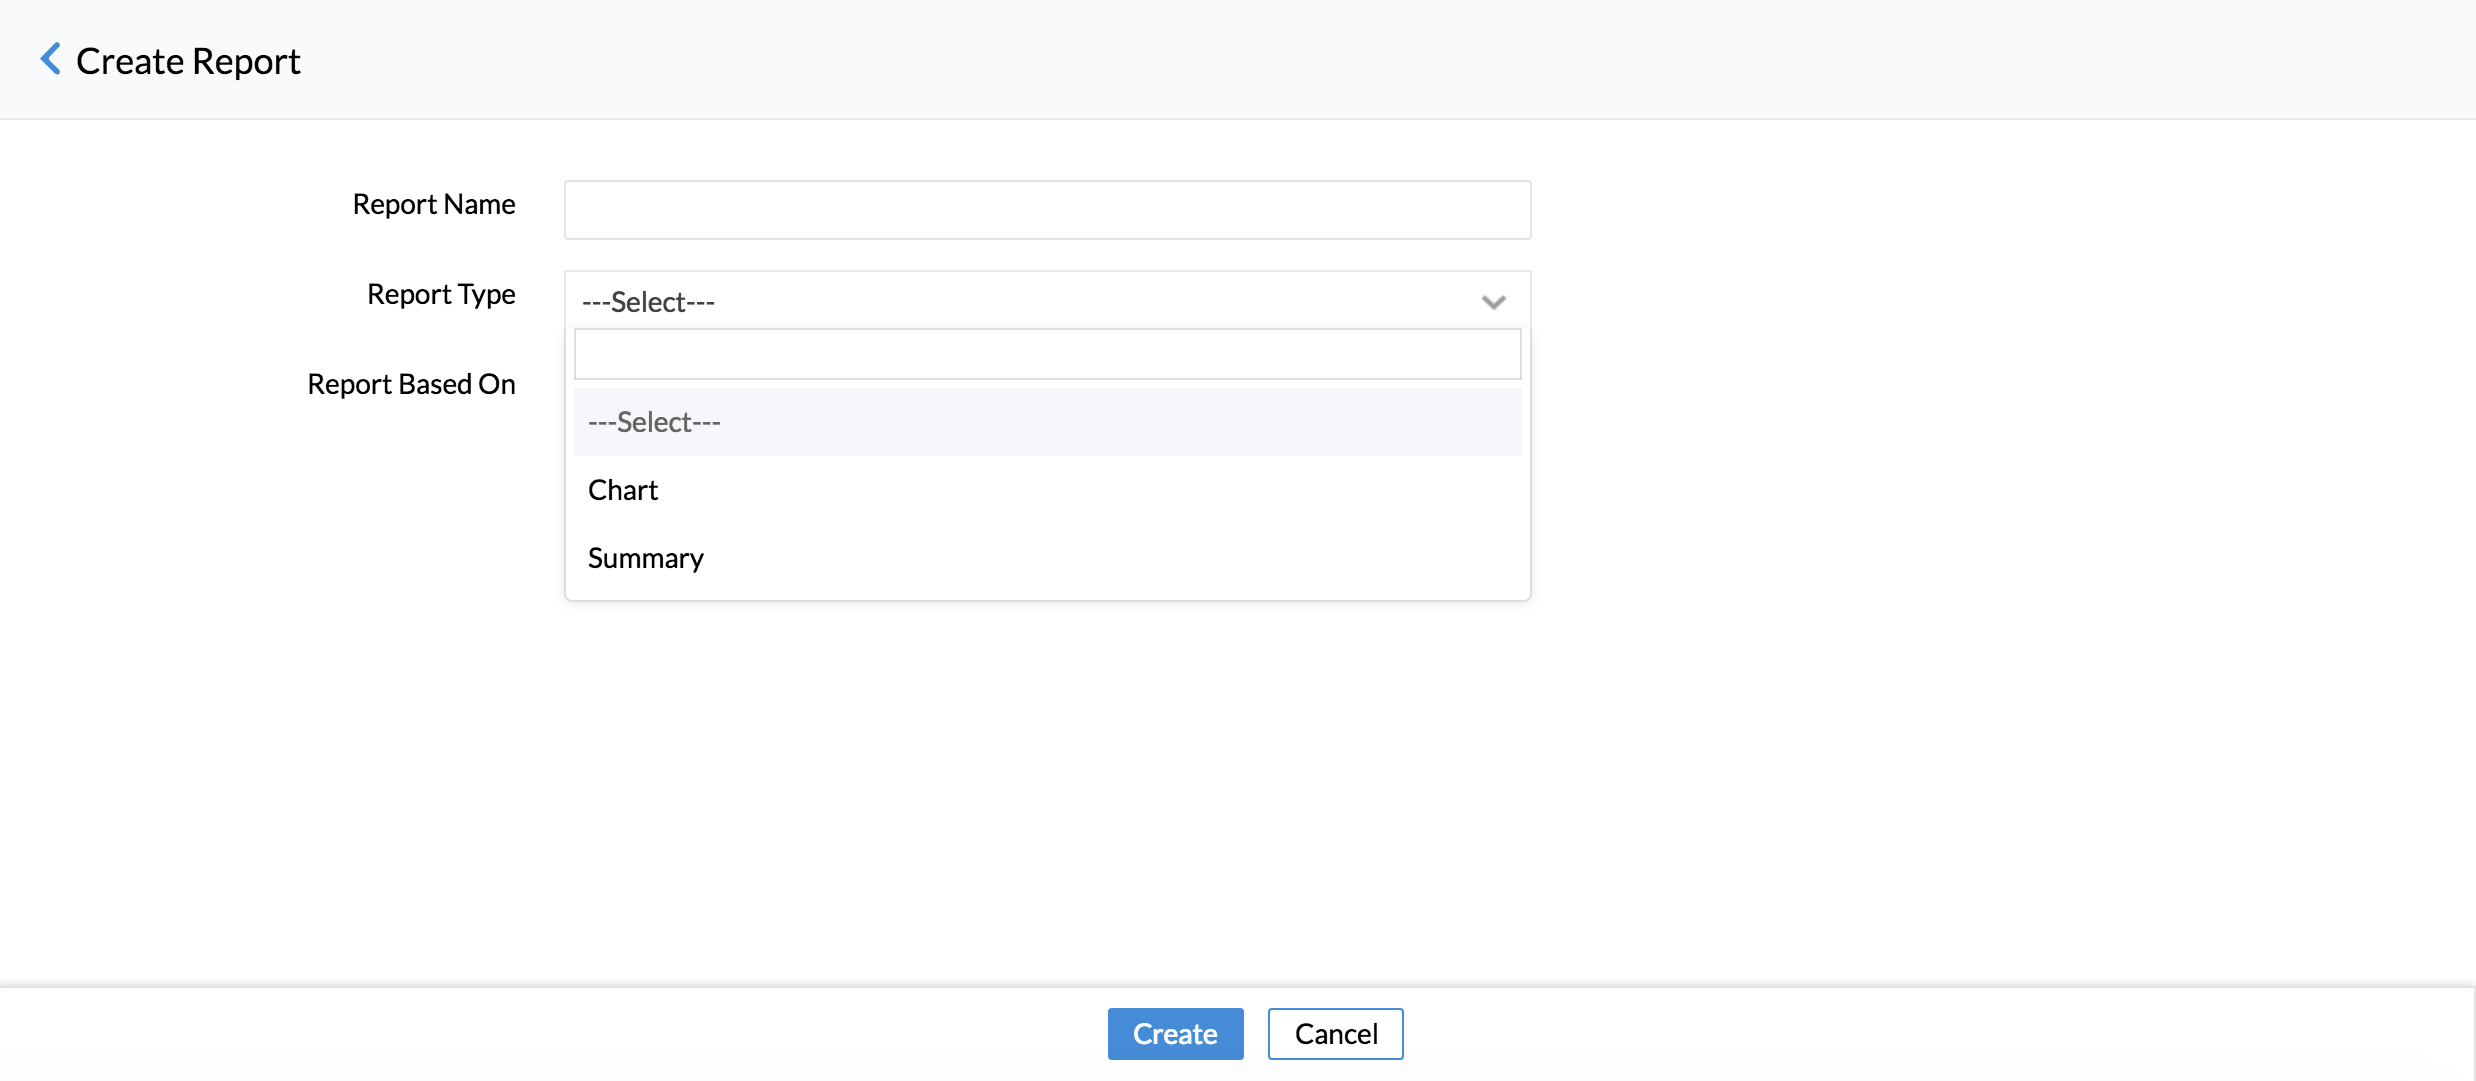
- From your home page, go to Analytics > Create Report.
- Enter the Report name.
- Under Report Type, select Chart or Summary.
- Under Report Based on, select the form.
- Click Create.
- Using the fields listed on the left side, drag and drop columns that should be displayed as X axis and Y axis.
- Under Color, drag and drop the column based on which, the chart will be further categorized showing each data pointing to different colors (different data series).
- Under Text, drag and drop the column which should be used as data label in the chart, according to the function applied on the column.
Filters can be used to filter the data that is made available for the viewer. Once a column is dropped, a list of all possible options for filtering will be displayed in the (second) box right to Filter Shelf. The filtering options provided varies based on the data type of the column dropped. You can also include dynamic filtering capability in the reports view mode called User Filters. User filters enables you to apply filters on the report data displayed using the filter columns exposed as part of User Filters. The filter columns included in User Filters can be displayed using a variety of display components like Drop Down boxes, Slider, Date range chooser etc., to suit your needs.
Go to this link to know in detail about creating reports.
Editing a created Report
Follow the steps given below to edit your report.
- From your home page, go to Reports > Analytics
- Go to the report that needs to be edited
- Click the Edit icon at the right corner of the row
- Edit the report as required
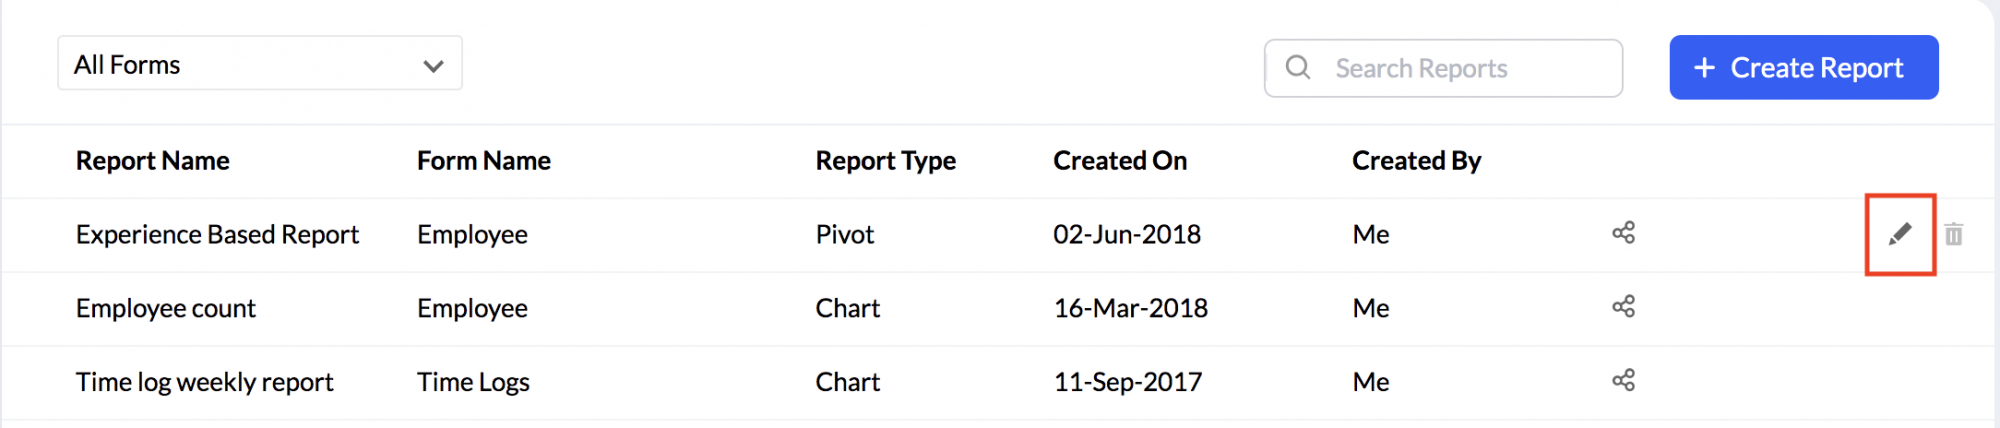
- Click Save.
Deleting a Report
- From your home page, go to Reports > Analytics
- Go to the Report that you would like to delete
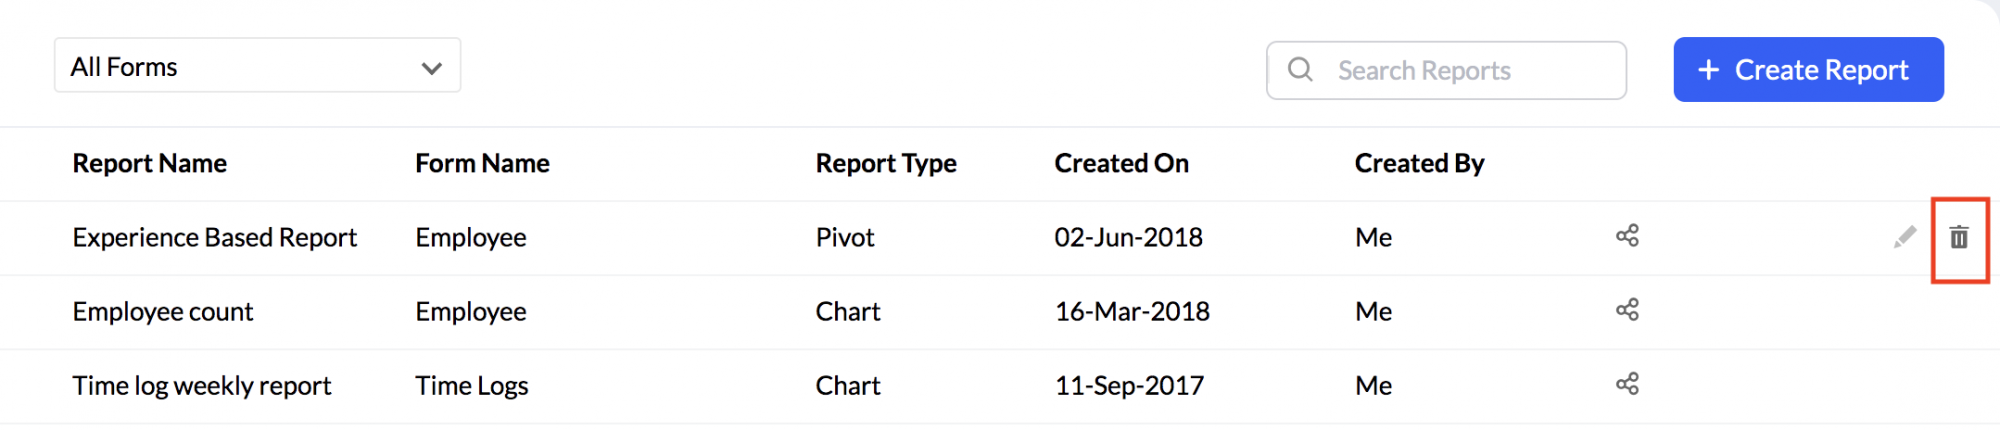
- Click on the Delete icon at the right corner of the row.
Sharing a Report to Users
Once you have created a report, it is possible for you to share it only to specific users of your choice. Follow the steps given below to do this.
- From your home page, go to Reports > Analytics
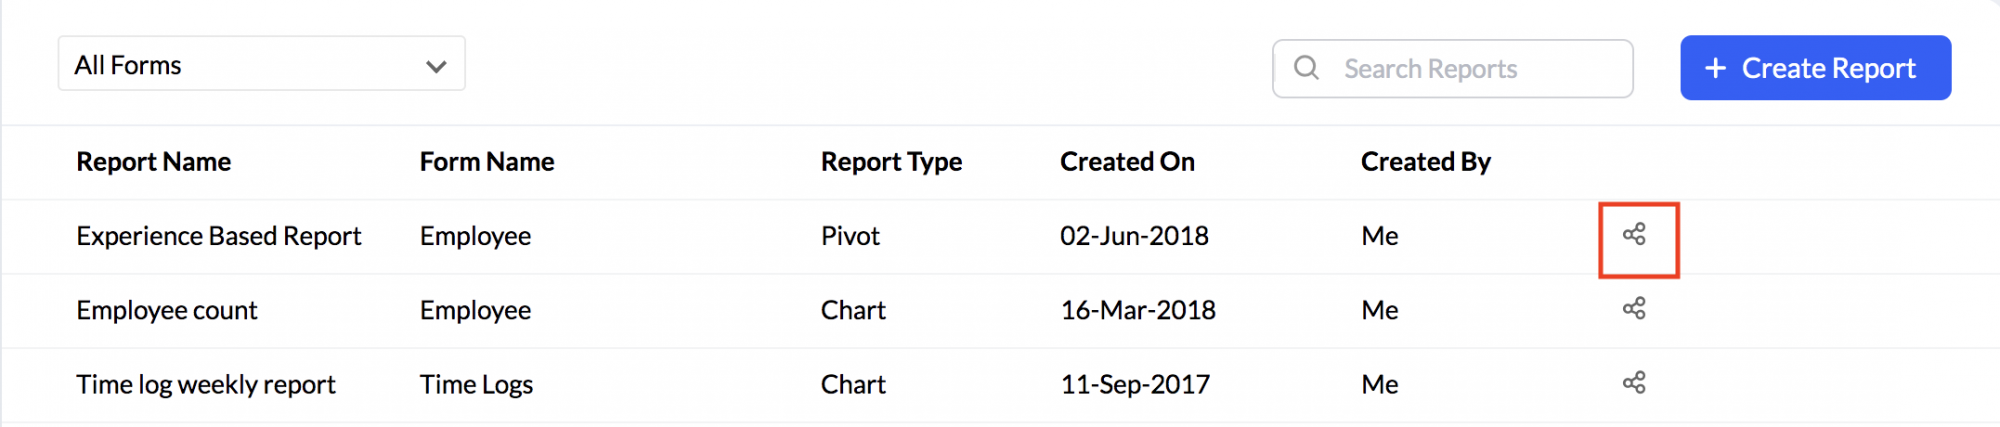
- Go to the report that you would like to share
- Click on the icon that is right next to the 'Created By' column
- In this page, under Share To, use the search tab and get the user from lists like Users, Departments, Roles and Locations.
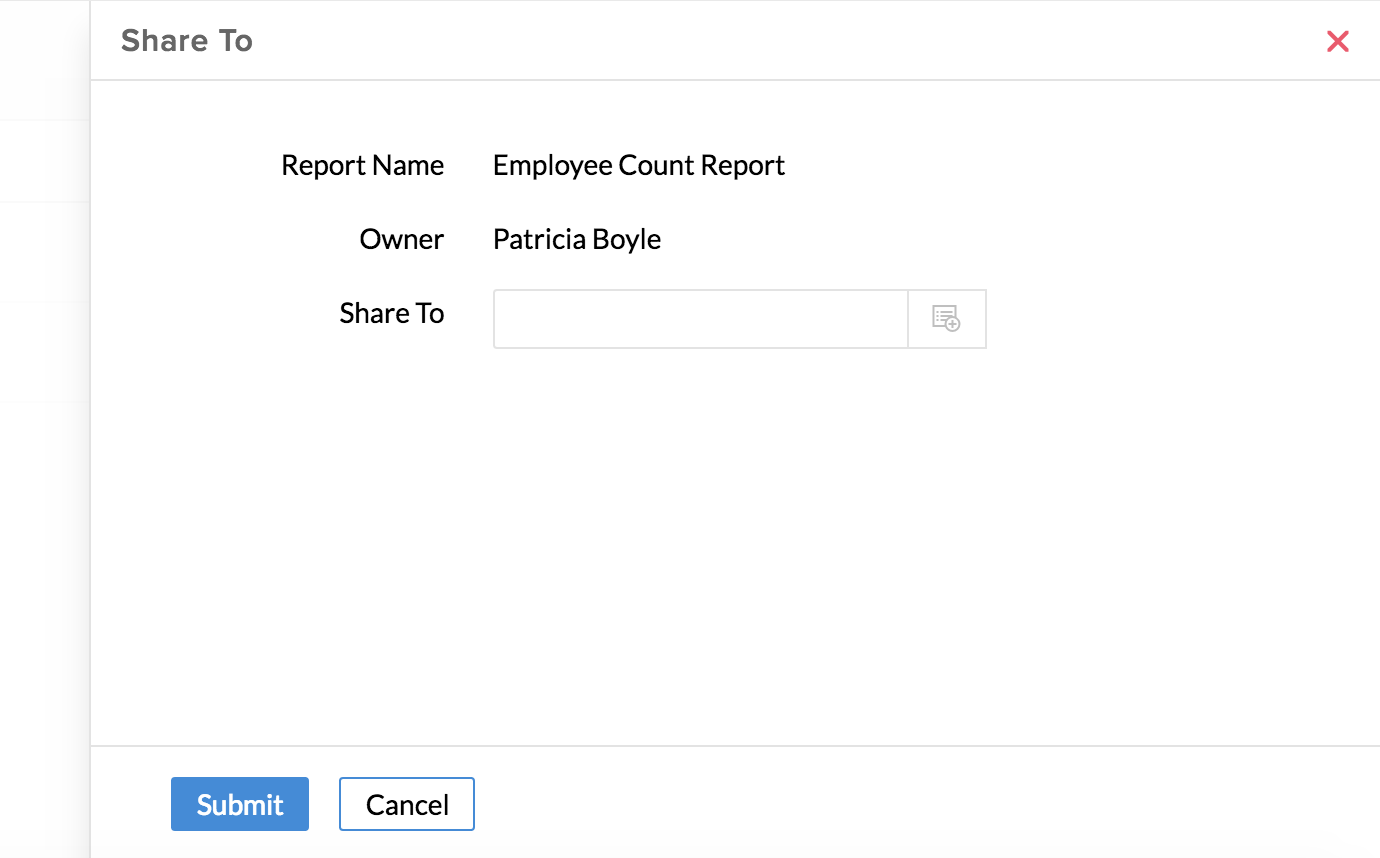
- Click Submit
Note: When you share the reports to your employees, the data that they will be able to view is dependant on the permissions that you have configured for them. For instance, if a particular employees does not have the permission to view some records in a form, then the employee will not be able to see data pertaining to these records even if that data is present in the report that you have shared.
Report Scheduler
If you have reports created in Analytics, you will be able to send them periodically to someone by making use of the Report Scheduler. Using the Report Scheduler you will be able to create a workflow where you can select the recipients. You can have the appropriate reports mapped to this workflow and get these reports delivered via email periodically (Weekly, Monthly etc) at the time that you want.
Click here to know how to create a Report Scheduler.
Exporting a Report
- From your home page, go to Analytics
- Click on the report that you would like to export
- Click on 'Export' which is there at the right corner of the report
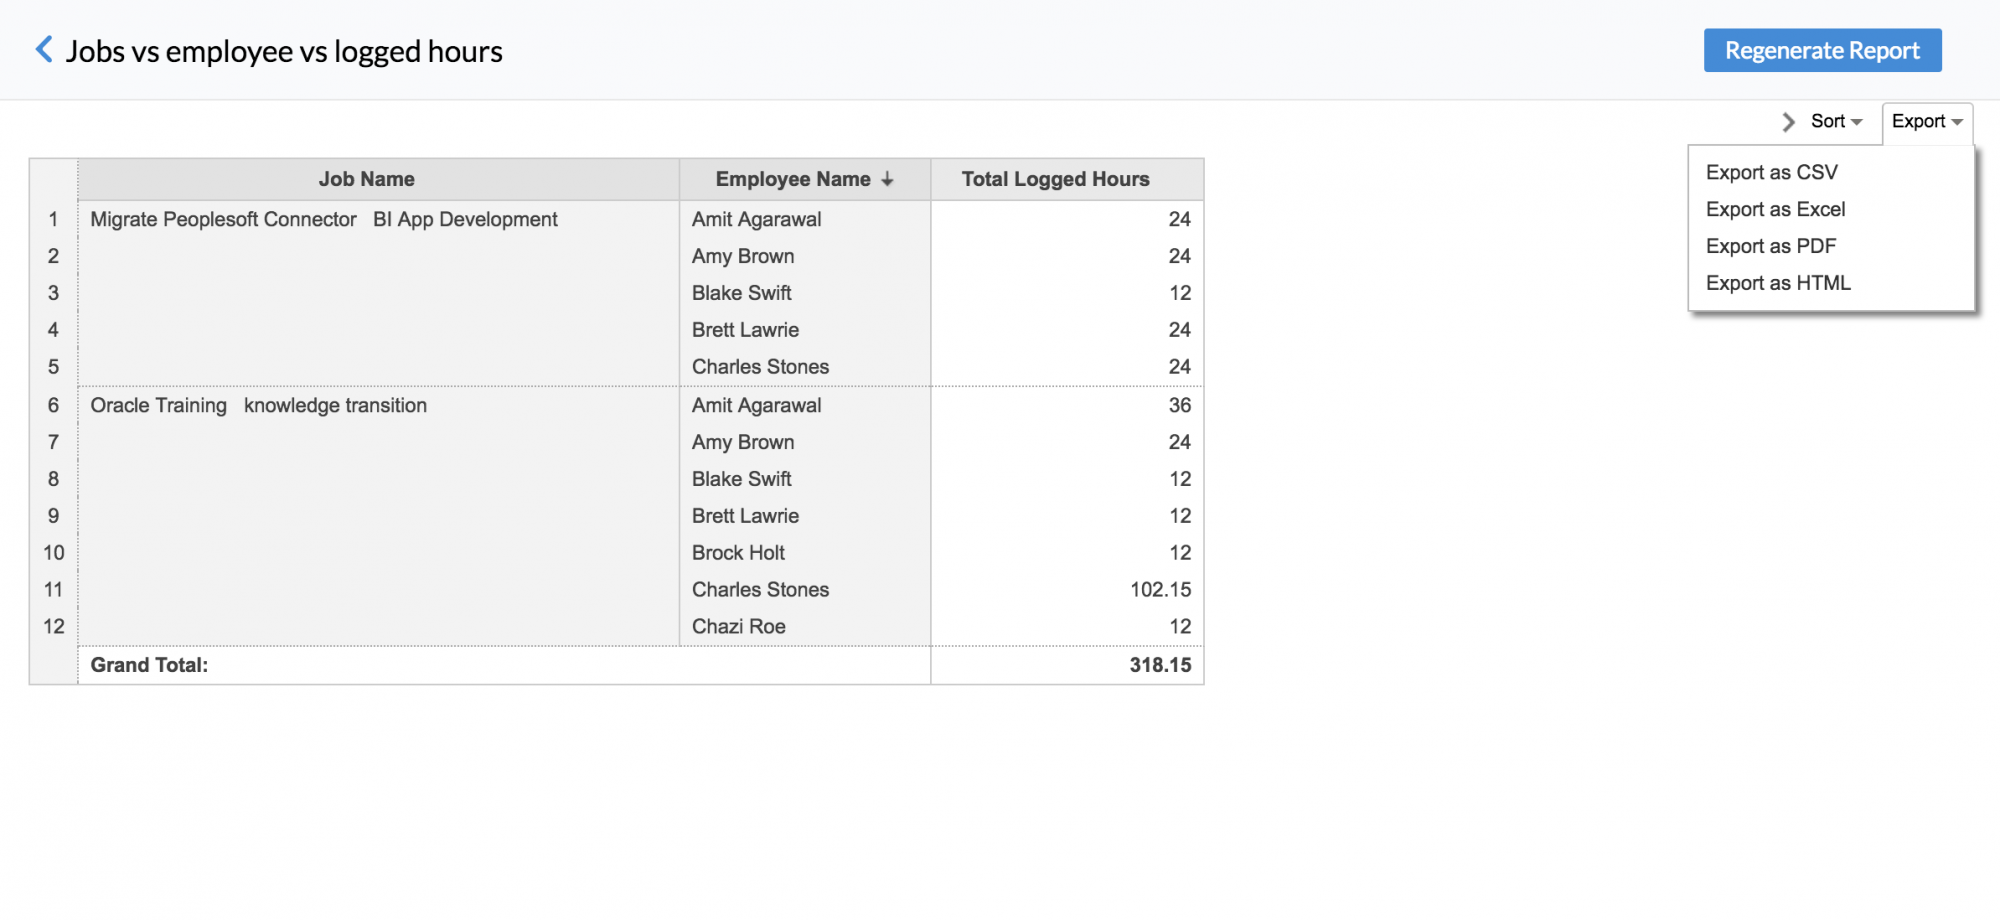
- Select the format from the list (CSV/Excel/PDF/Image/HTML)
- Click Export once done
Analytics owner - changing ownership
Important points to note regarding People Analytics ownership change:
- The person who creates the first report by default becomes the analytics owner. Only the analytics owner has access to aggregate formulas* while creating reports.
- When super administrator is not the analytics owner they can take ownership. (ownership cannot be assigned to someone else as they would need the owner's authentication) the option to take ownership will be shown to super administrators only (when they are yet to take ownership)
- Employee role, employee status, and login status of the analytics owner cannot be changed. The analytics owner cannot be converted to an employee profile as well.
- In case the analytics owner leaves the organization, or if the analytics service is disabled for this person, the report's data from Zoho analytics will no longer be accessible. Data sync will also not take place. So it is imperative to transfer the ownership of the analytics owner before they leave the organization.
- To transfer ownership, the analytics owner should contact the super administrator. Only they can transfer the ownership.
To change ownership of Analytics owner,
- Navigate to Analytics
- Click the ellipsis icon
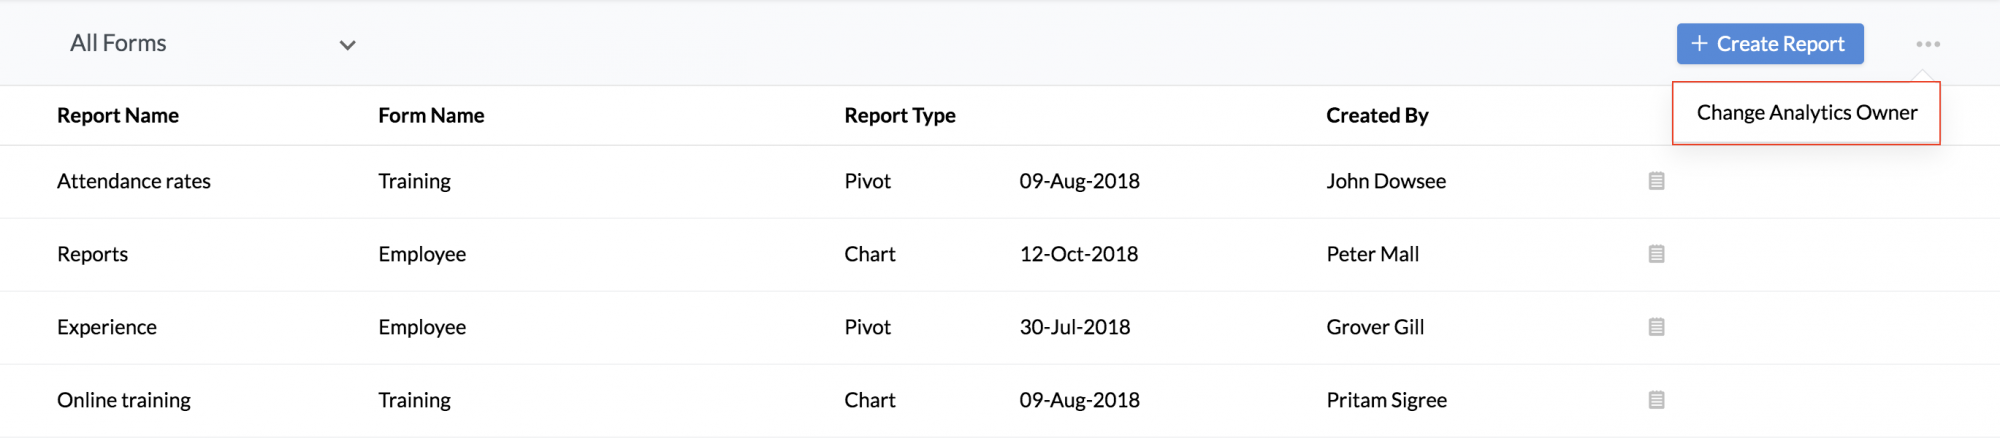
- Click Change Analytics Owner
The process of changing the Analytics Owner will be initiated and a success or failure mail will be sent to the Super Administrator.
*Aggregate Formulas: These are formulas where you use aggregate functions (SUM, AVG..) in the calculation. The result of Aggregate Formulas will not be added as another column in the base table. They will just be associated to the table on which it has been created and can be used while creating reports (Charts, Pivot Tables and Summary Views) like any other table columns. Click here to learn more about Aggregate Formulas.