- HOME
- Website visitor tracking guide for small businesses
Website visitor tracking guide for small businesses
- Last Updated : June 17, 2026
- 100 Views
- 12 Min Read
There’s a version of website tracking that involves data warehouses, server-side tagging, event schemas, and a consultant who charges £300/$400 an hour to configure something called “Consent Mode v2.” That version probably isn’t for you — at least not yet.
There’s also a simpler version. The one where you just want to know: Are people actually landing on my site? Where are they coming from? And what happens after they arrive?
That’s what this guide covers. No jargon. No assumption that you have a developer on call. Just a practical guide to help small and mid-sized business owners make better decisions about their websites.
Before we start — one important distinction
A lot of guides on this topic conflate two very different things: behavioral tracking (what people do on your site) and identity tracking (who those people are as individuals). We’ll cover both, but they’re genuinely different tools for different problems. Confusing them is where most people go wrong at the start.
What website tracking is and what people get wrong about it
Website tracking is simply the process of collecting data about who visits your site and what they do when they get there. A small piece of code called a tracking script or pixel sits in your website’s code. When someone loads a page, it silently records things like: what page they landed on, what device they’re using, where they came from (Google search, a social post, a direct URL), how long they stayed, and whether they clicked anything significant before leaving.
That data gets sent back to whatever analytics tool you’re using, and you can look at it in a dashboard. Simple enough. But here’s where most people trip up: they assume “tracking visitors” means they’ll be able to see who those people are — for instance their names, email addresses, companies. For most websites, that’s not how it works. What you’re tracking is anonymous behavior, not identities. You’ll know that “someone from Manchester, using an iPhone, who found you via Google Search, spent three minutes on your pricing page and then left.” You won’t know it was Jane from XYZ Ltd.
(There are B2B tools that can identify company names from IP addresses — products like Leadfeeder or Clearbit. But that’s a separate category entirely, different setup, different price, different use case. We’ll come back to that briefly at the end.)
The anonymous version is still enormously useful. Knowing that 47 people looked at your pricing page this week and none of them clicked “Get in touch” tells you something is wrong with that page, even if you don’t know their names. That’s actionable. And that’s what tracking is for.
The two things tracking tells you and why most people only use one of them
Website tracking data breaks into two distinct layers. Most people only use the first. The second is where most of the useful stuff actually lives.
Layer 1: The “what” — traffic and source data
This is your standard analytics dashboard. How many people visited. Where they came from. Which pages they looked at. How long they stayed. This is what Google Analytics gives you out of the box, and it’s genuinely useful for answering questions like:
- Is my traffic going up or down this month?
- Which of my blog posts is getting the most visitors?
- Is my Google Ads campaign actually sending people to my site?
- Are mobile visitors staying as long as desktop visitors?
These are important questions. But they’re the surface of the iceberg. The data tells you what happened, but it doesn’t tell you why.
Layer 2: The “why” — behavioral data
This is where things get interesting for a small business. Behavioral tracking tells you not just that someone visited a page, but what they actually did while they were on it. Where their mouse went. Which sections they scrolled past without reading. Which button they tried to click that didn’t work. How far down the page they got before they left.
This is what tools like heatmaps, session recordings, and form analytics give you — and most small businesses haven’t used them, either because they didn’t know they existed or because they assumed they were expensive enterprise-only tools.
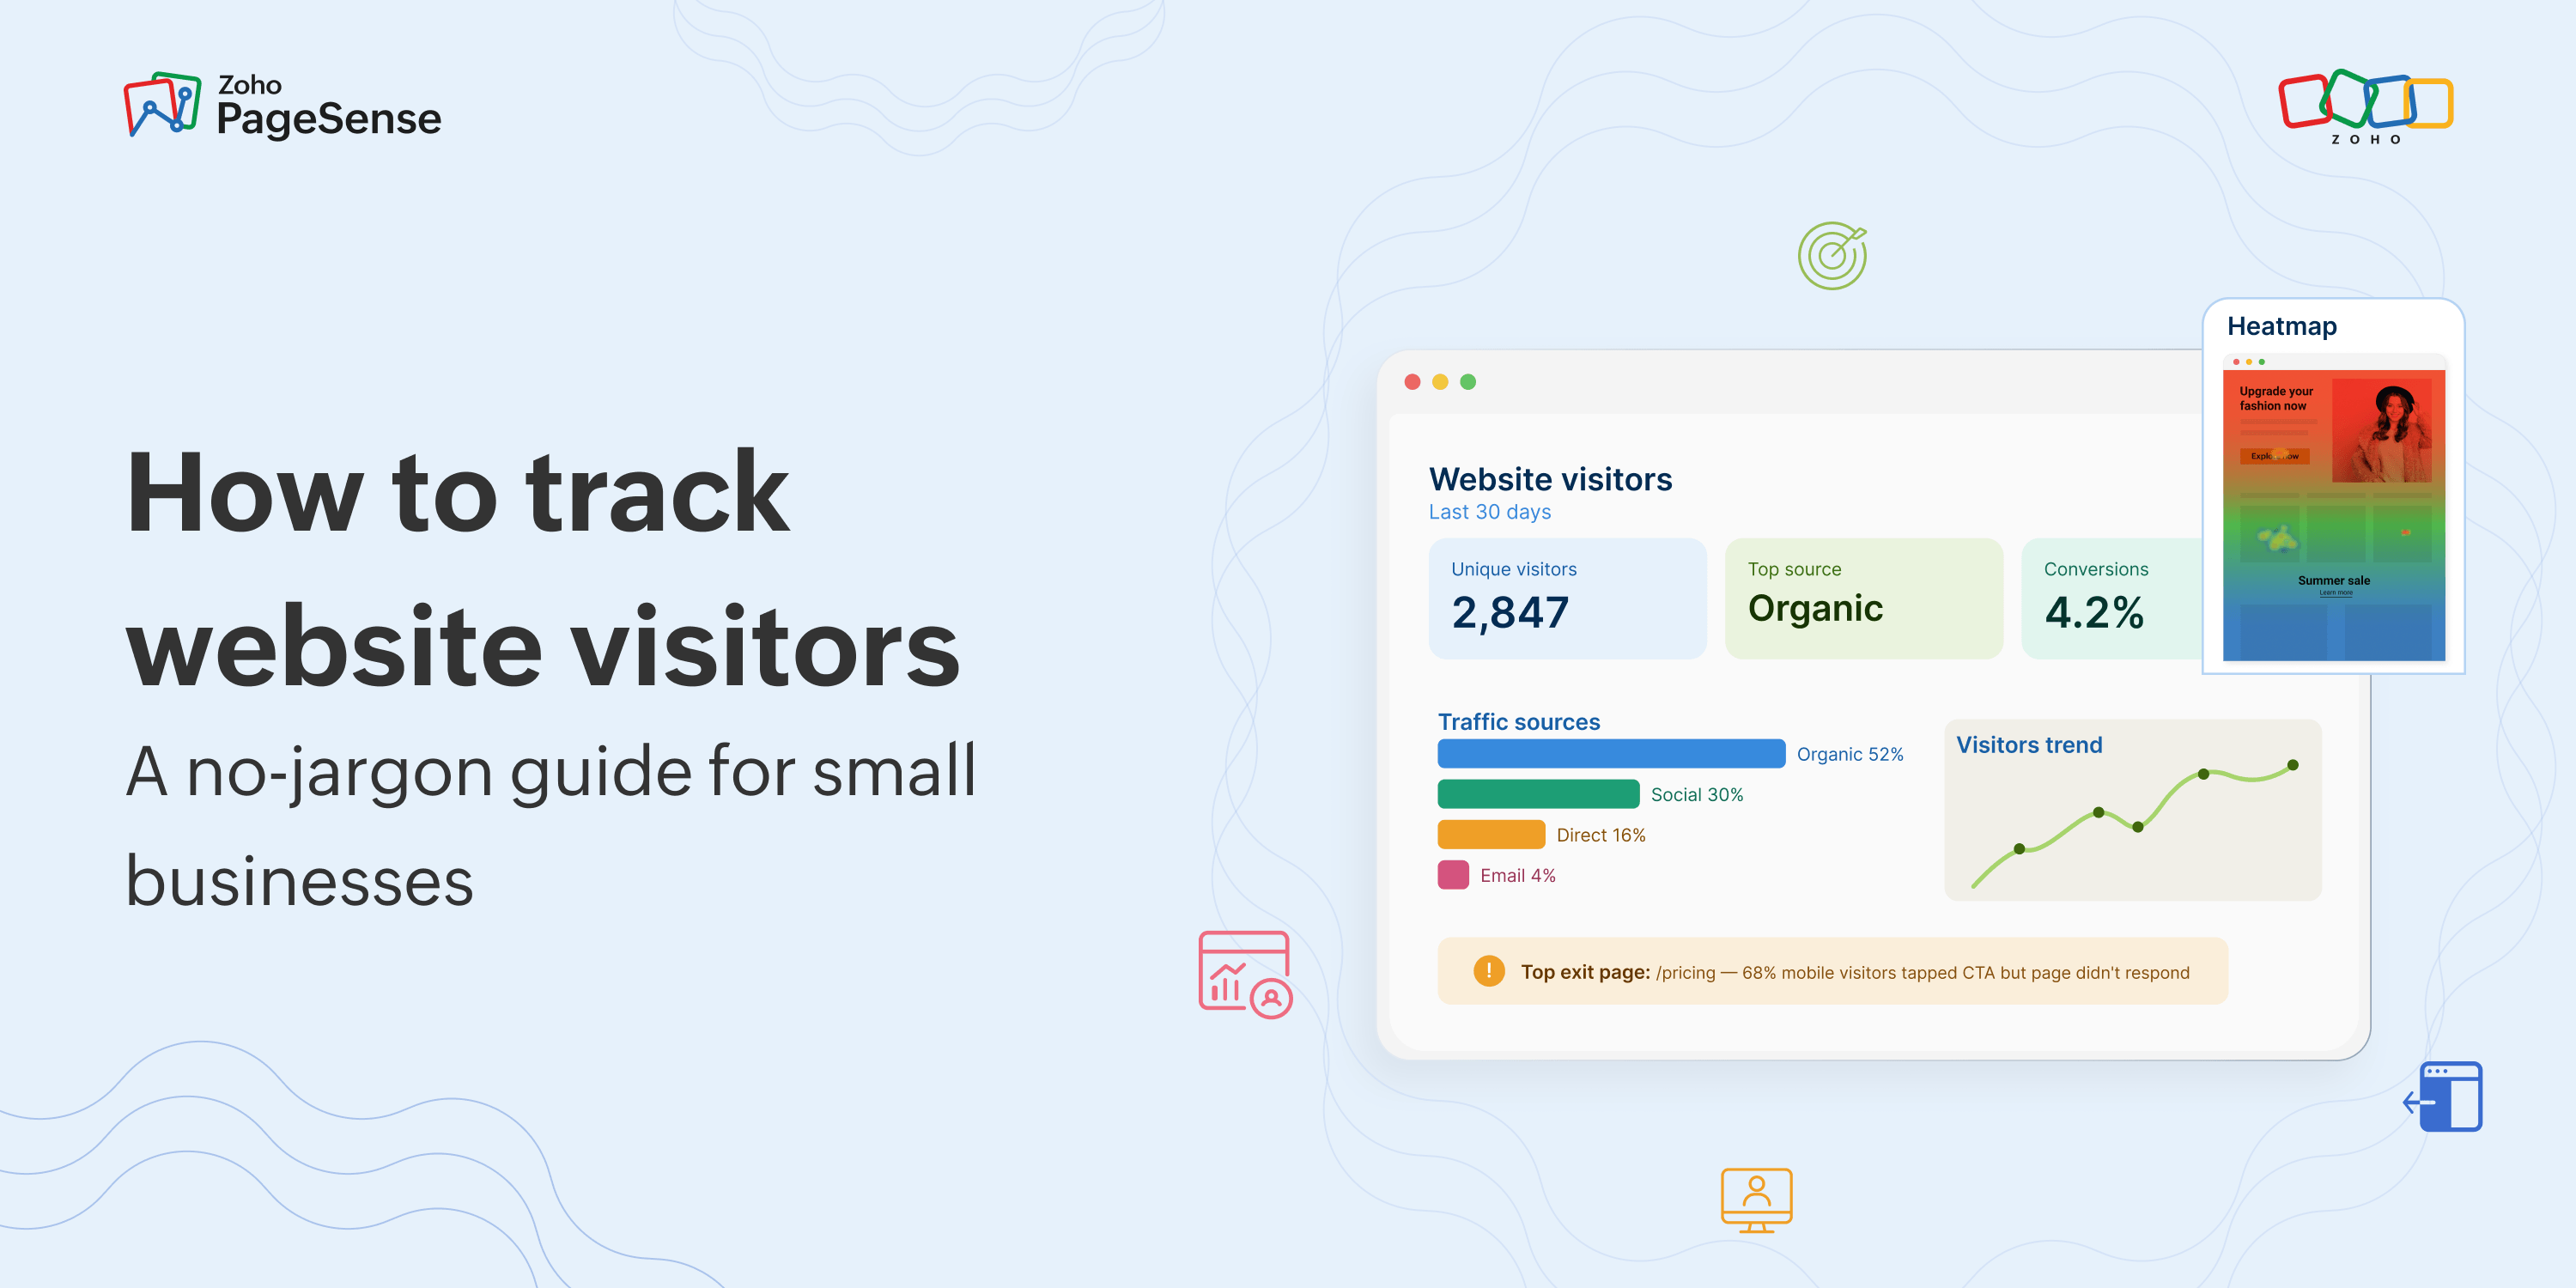
“Your bounce rate went from 58% to 71% this month” is layer one. “68% of mobile visitors are tapping your CTA button but the page isn’t responding because the button’s broken on iOS Safari” is layer two.
The reason layer two matters more than most people realize is simple: layer one tells you there’s a problem. Layer two tells you what it is. And for a small business, knowing what the specific problem is — rather than just that conversions are down — is the difference between making a change that works and guessing.
The 6 metrics that actually matter for small businesses
Every analytics tool will show you dozens of metrics. Most of them are either vanity metrics (they make you feel good but don't tell you much) or advanced metrics that need context you don't have yet. Here are the six you should actually care about.
METRIC 1 : Unique visitors
How many distinct people visited your site in a given period and not total page views. More honest measure of your actual audience size.
METRIC 2 : Traffic source
Where visitors came from: organic search, paid ads, direct URL, social media, email, referrals. More on this below. It's the most actionable metric most teams ignore.
METRIC 3 : Conversion rate by source
Not just which channel sends the most visitors, but which channel sends visitors who actually do something. Often very different channels. This one changes how you spend your budget.
METRIC 4 : Top exit pages
Which pages are people on when they finally leave? A high exit rate on your pricing page is a very different problem from a high exit rate on your blog. Both need fixing differently.
METRIC 5 : Goal completions
How many people actually did the thing your site exists to make them do: a form submission, a button click, a booking, a purchase. The number that matters most, and the one most people forget to set up.
METRIC 6 : Mobile vs desktop split
What percentage of your visitors are on mobile? And does your conversion rate look the same on both? If your mobile conversion rate is significantly worse, your layout has a problem worth fixing.
The one metric to ignore early on
Average session duration is almost always misleading on its own. A 4-minute average session sounds great until you realize it's because people are sitting confused on your homepage, not because they're engaged. Don't optimize for time on page. Optimize for what happens after they're on your page.
What GA4 tells you and the big gap it leaves
If you’ve had a website for more than a year, you probably have Google Analytics on it. Since July 2023, that means GA4, after Google retired Universal Analytics. It’s free, powerful, and effective at tracking most “layer one” data.
But there are a few things worth understanding about how it actually works now, especially for small businesses making decisions based on its data.
The consent problem :
Privacy regulations in Europe and increasingly in other markets require that visitors consent to tracking cookies before any analytics data gets recorded. In practice, a meaningful chunk of your visitors — anywhere from 40% to 75% in European markets, often lower elsewhere depending on your audience — decline or ignore consent banners. That means GA4’s data has gaps. The numbers you’re looking at are undercounts. GA4 uses machine learning to estimate the missing data, which works roughly, but it means you’re making decisions based on modeled traffic rather than real traffic when your opt-out rates are high.
This isn’t a reason not to use GA4. It’s a reason to treat its absolute numbers with appropriate skepticism, and focus more on trends and ratios rather than raw figures.
What GA4 doesn’t cover :
The bigger gap is behavioral. GA4 tells you a visitor landed on your pricing page and left after 90 seconds. It doesn’t tell you:
- Whether they scrolled to your pricing table or just saw the header
- Whether they tried to click “Get a quote” and nothing happened
- Whether they started filling in your contact form and abandoned it on the phone number field
- Whether your page layout is completely broken on their device
For the “why” layer, you need complementary tools such as heatmaps, session recordings, and form analytics. These fill in what GA4 can’t see.
| Question | GA4 | Behavioral tools |
| How many people visited my site? | Yes | Yes |
| Where did my traffic come from? | Yes | Yes |
| Which pages have the highest exit rate? | Yes | Yes |
| Did visitors scroll to my CTA? | No | Yes (scroll maps) |
| Where are people clicking on a page? | No | Yes (click heatmaps) |
| Which form field is causing abandonment? | No | Yes (form analytics) |
| Can I watch a visitor session back? | No | Yes (session recordings) |
| Where in my funnel are people dropping off? | Basic | Yes (funnel analysis) |
How tracking actually works
You don’t need to understand this in depth to use tracking tools. But a basic grasp of how it works helps you understand why the data sometimes looks incomplete, and what to do about it.
The tracking snippet :
Every tracking tool — GA4, Zoho PageSense, Hotjar, whatever you use — gives you a small piece of JavaScript code, usually called a snippet or tag. You add this to your website’s <head> section once, and it runs on every page. If you’re using WordPress, Wix, or Shopify, you can usually install it through a plugin or built-in integration without touching any code.
When a visitor loads a page, the snippet fires in the background. It collects information about the visit — such as device, browser, screen size, referral source, and page URL — and sends it to the analytics platform. From there, you can view it in your dashboard.
What “asynchronous” means and why it matters :
Good tracking scripts load asynchronously, meaning they run in the background without blocking the rest of the page. Your images, text, and layouts load first. The tracking script follows silently. This matters because a slow tracking script can make your site feel sluggish, and slow sites lose visitors before they even get to see your content. If you’re using a tool that’s noticeably slowing your pages down, that’s a problem worth solving.
How visitors are counted :
Most tools use cookies to recognize returning visitors. When someone first visits your site, a small cookie gets stored in their browser. Next time they visit, the tool reads that cookie and identifies them as a returning visitor rather than a new one. This is why “unique visitors” counts are often lower than raw page view counts — the same person visiting five times is counted once.
In practice, this count is always slightly imprecise. If someone visits on their phone and then again on their laptop, they’ll be counted as two visitors. If they clear cookies, they’ll be counted as new. Don’t treat visitor counts as exact figures. Treat them as directional; the trends are reliable even if individual numbers aren’t.
A word on privacy — because it's changed a lot recently
Website tracking in 2026 is very different from five years ago, and small business owners need to understand the basics. Not so they can become compliance experts, but so they don’t accidentally put themselves at legal risk.
The consent requirement :
If you have visitors from Europe, the UK, or an increasing number of other regions, privacy law requires that you ask for consent before loading non-essential tracking scripts. That includes most analytics tools. Your site needs a proper cookie consent banner — not just the ones that say “by continuing to use this site you accept cookies” (which aren’t legally valid under GDPR and similar privacy laws). You need one that actually lets people decline.
The practical implication: some of your visitors will decline, and you won’t have data on them. This is expected, and it’s part of the trade-off.
What tracking tools should not do :
Reputable tracking tools like Zoho PageSense, GA4, Hotjar, and similar do not:
Record keystrokes or passwords in session recordings
Store personally identifiable information by default
Share your visitor data with other companies for advertising
Reputable session recording tools mask sensitive form fields (credit card numbers, passwords) by default and give you controls to mask anything else you want to keep private. This is worth checking in whatever tool you use.
The practical checklist
Three things every small business needs:
(1) A cookie consent banner that lets visitors decline.
(2) An up-to-date privacy policy that mentions what tracking tools you use.
(3) A tracking tool that's GDPR and CCPA compliant. Check that it's listed on the tool's website before you install it.
How to get started today
Most people do this backwards. They install a tool, get overwhelmed by the dashboard, and stop looking at it. Here’s a more sensible sequence for implementing website analytics.
Define one goal before you install anything
What is the one thing your website exists to make visitors do? Book a call. Submit a contact form. Buy a product. Sign up for a newsletter. Write it down. This becomes your first conversion goal, and it’s the number you’ll check every week. Everything else is context for this number.
Choose your analytics tool
Most businesses choose between three types: an all-in-one platform that combines traffic data, heatmaps, and session recordings in one place; a traffic-only tool like GA4 that’s free but needs separate tools for behavioral data; or a self-hosted option like Matomo if your data needs to stay on your own servers.
Install a tracking snippet — it takes about five minutes
If you’re on WordPress, use a plugin. If you’re on Shopify, use the built-in app integration. Otherwise, the easiest way is to paste the snippet into your site’s <head> tag. Your website builder likely has a “custom code” or “header script” option in its settings. You don’t need a developer for this.
Set up your first conversion goal
In whatever tool you use — say, Zoho PageSense — create a goal that fires when someone reaches your thank-you page, or clicks your main CTA button. This is the baseline number you’ll track over time. Without it, you’re just watching traffic numbers and hoping they mean something.
Read your data before you change anything
Give it a week, then look at two things. Which channels are sending visitors and which of those are converting — this usually surfaces one clear priority. Then check your highest exit-rate page. That’s the one to investigate with a heatmap or a few session recordings. It will usually show you exactly what’s happening.
Make one change. Then measure it.
The temptation is to find ten problems and fix them all at once. Resist it. Change one thing, watch the conversion rate for two weeks, and decide if it worked. That discipline — one change, clear measurement — is how sites actually improve.
One last thing: tracking is not a set-and-forget task
The single biggest mistake small businesses make with analytics is installing a tool and then checking it once every few months. By the time they look, the problem they could have caught in week two has been hemorrhaging conversions for three months.
You don’t need to look at your analytics every day. But a weekly ten-minute check — goal conversions up or down, traffic sources, top exit pages — builds the habit of noticing things early. In our experience, most of the actionable insights come from catching changes early, not from quarterly deep-dives into a dashboard that’s six months out of date.
Start simple. Track one goal. Look at traffic sources. Set up a heatmap on your highest-traffic page. That’s a more useful analytics setup than most small businesses ever get to — and it takes about an afternoon to build.
See what your visitors actually do — not just the numbers!
Frequently asked questions
1. How do I track my website analytics?
Add a tracking snippet — a small piece of JavaScript — to your site's <head> tag. Most analytics tools provide this code when you create an account. Once installed, it runs automatically on every page. Zoho PageSense starts collecting data immediately after the snippet is installed. Behavioural tools like heatmaps and session recordings activate once you configure them for specific pages.
2. What does a website analytics dashboard show you?
Your analytics dashboard is the central view of everything your tracking tool has collected. In Zoho PageSense, the website analytics dashboard shows your visitor count, traffic sources, top pages by session time, goal completions, and device breakdown without any setup required.
3. What is the easiest website analytics tool to set up?
For any business, Zoho PageSense and Google Analytics 4 are both straightforward to install — both take under ten minutes if you're on a common CMS like WordPress or Shopify. PageSense has the advantage of combining traffic analytics, heatmaps, and session recordings in one tool, so you're not installing and connecting multiple platforms to get a complete picture.
4. How do I know if my tracking code is working?
The fastest check: open your analytics dashboard and look at live visitor data. If someone is on your site right now and you can see them in the live view, the snippet is working. In PageSense, the live visitor tracker shows real-time activity within seconds of a visit. In GA4, the Realtime report does the same. If you see nothing after visiting the site yourself, the snippet either wasn't installed correctly or is blocked by an ad blocker on your browser.