- HOME
- What a leaking funnel looks like (and how to fix it)
What a leaking funnel looks like (and how to fix it)
- Last Updated : June 17, 2026
- 85 Views
- 8 Min Read
We built a new landing page last year for our feature launch. Traffic was coming in. The numbers looked fine on the surface — sessions were up, bounce rate was acceptable. But trial signups barely moved. So our marketing team did what most people do first: stared at the landing page for too long, changed the headline, moved the CTA, and tweaked the copy. But nothing moved.
Then we set up a funnel. Landing page → features page → signup → confirmation. And there it was: 71% of visitors who hit the features page never made it to the signup page. The problem was one step in, and we'd been looking in the wrong place entirely.
Most teams have access to funnel analysis. The harder part is knowing how to interpret it, knowing that the step with the biggest drop-off is not always the most obvious one.
What is funnel analysis?
Forget the marketing funnel — awareness, consideration, decision — that is a strategy framework, not a diagnostic tool. When we say funnel analysis, we mean something much simpler: you define a sequence of pages a visitor needs to go through to convert, and you measure how many make it from one step to the next.
For most websites, it looks like this:
Landing page → Pricing page → Sign-up page → Confirmation page
Or for e-commerce:
Product page → Cart → Checkout → Payment → Order confirmed
If you are not sure what your funnel should be, answer this: if a visitor arrived on your site right now and did everything right, which pages would they visit before you'd call them converted? Write those pages down in order. That is your funnel. Four to six steps are usually enough for most websites.
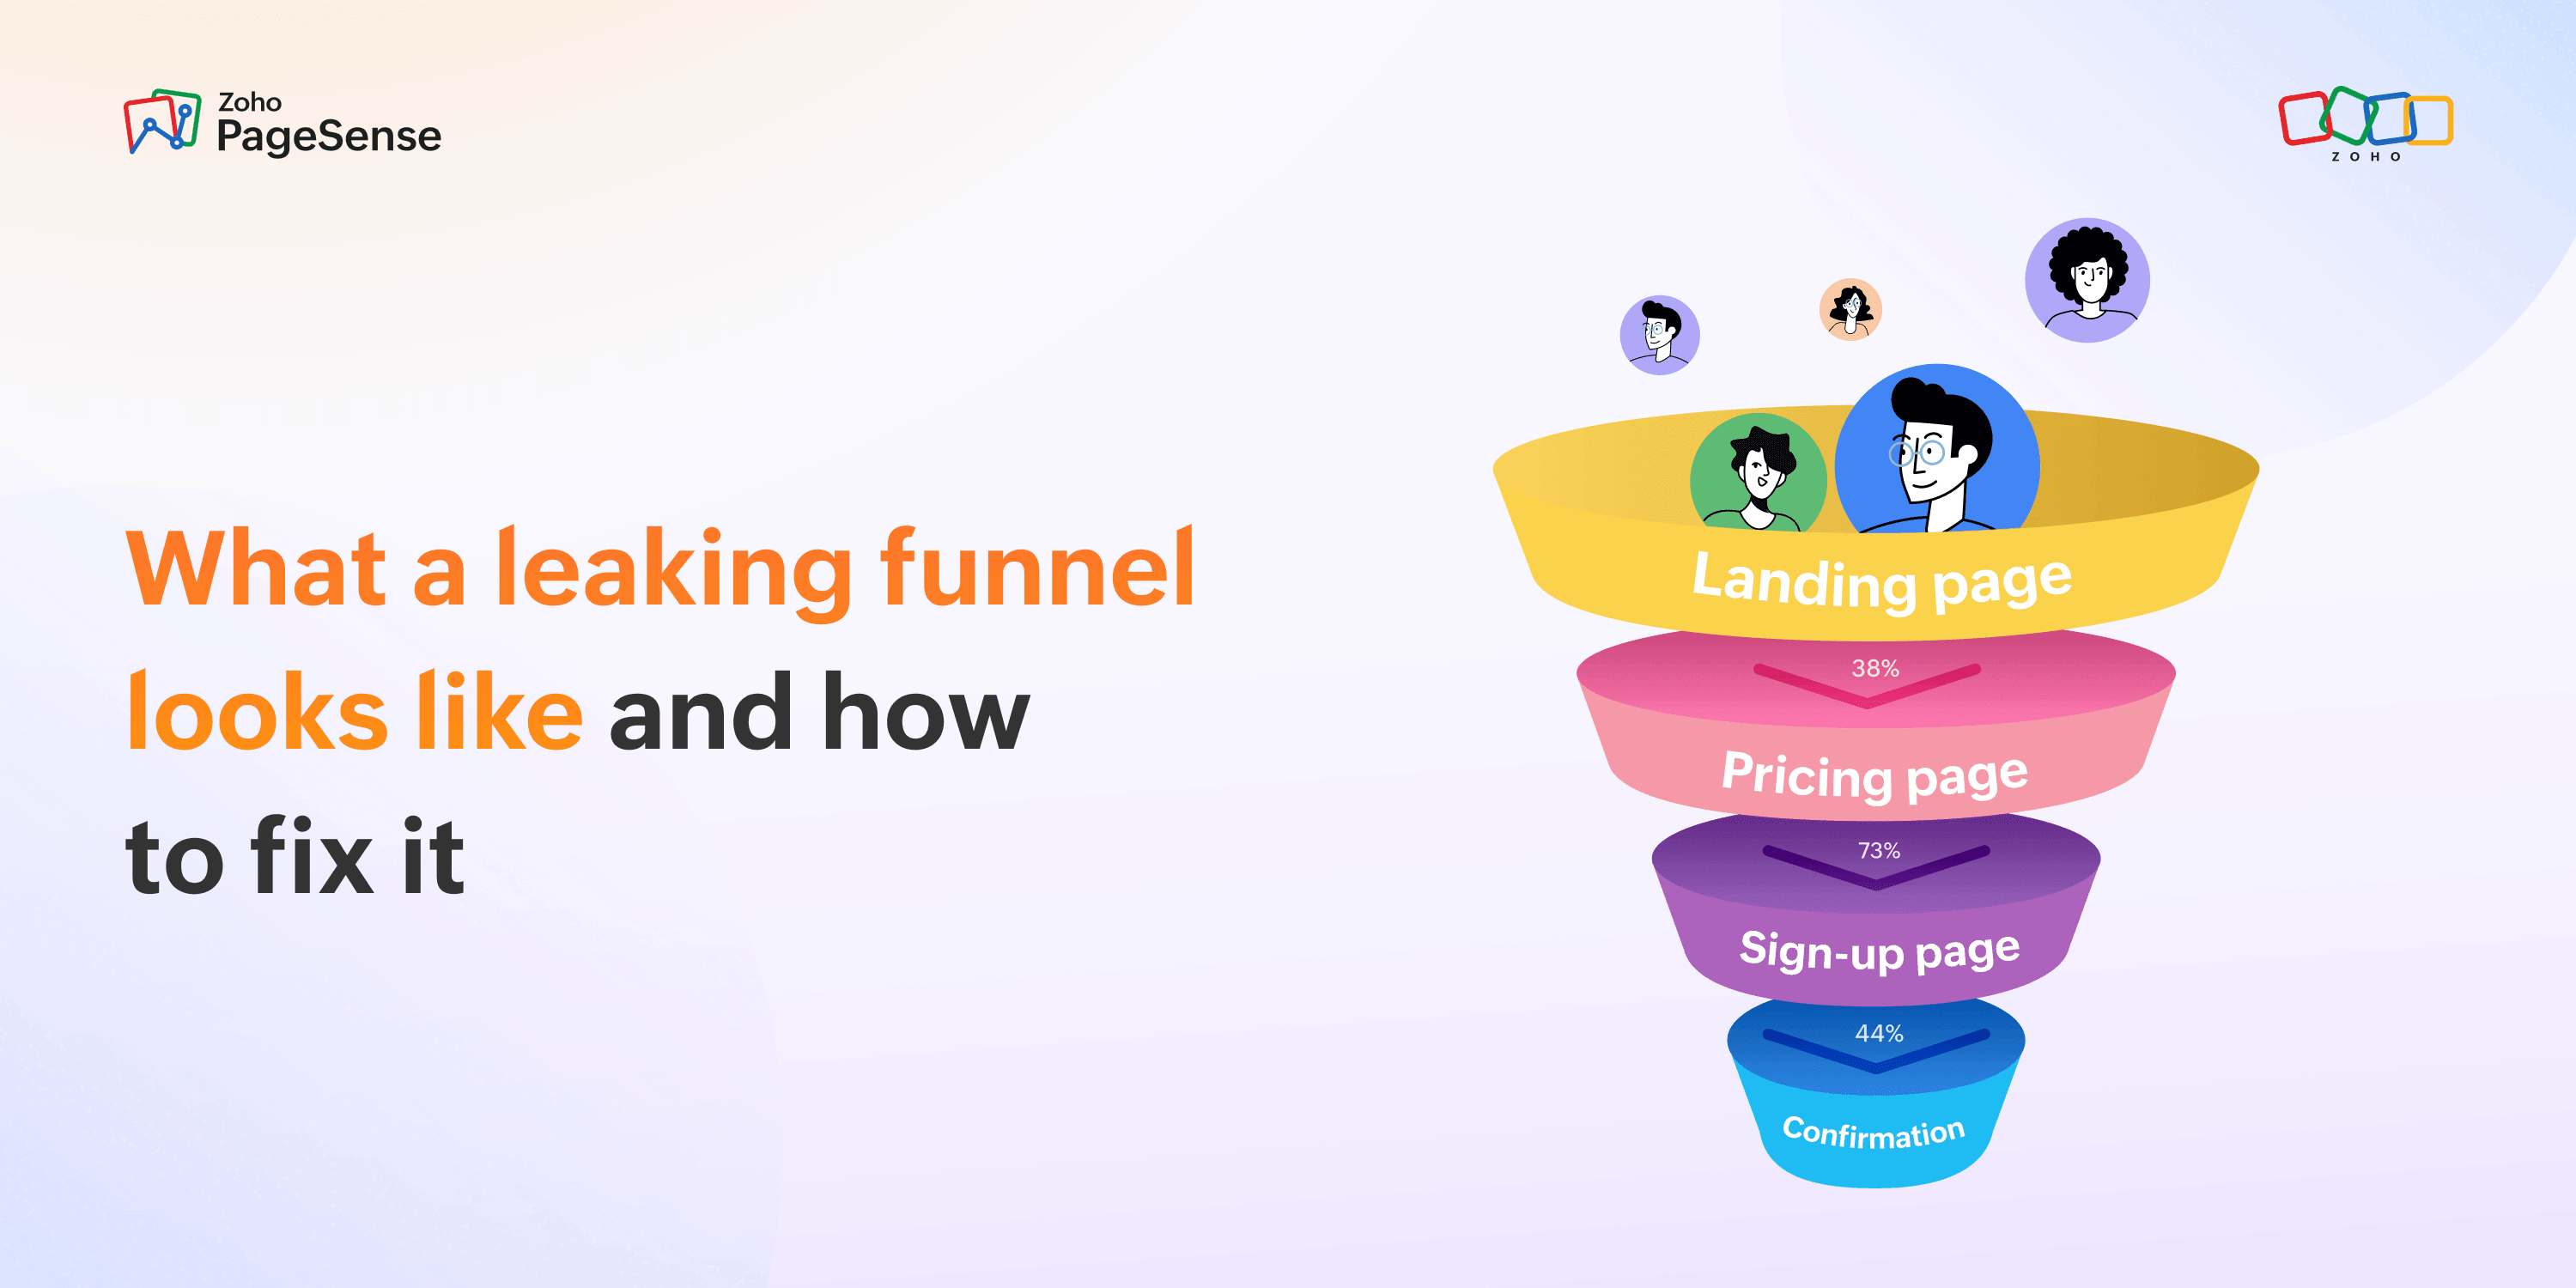
Funnel analysis then tracks how many visitors make it through each step and how many fall off between steps. A typical funnel report looks like this:
Step | Visitors | Dropped off | Drop-off % |
Landing page | 1,000 | — | — |
Pricing page | 620 | 380 | 38% |
Sign-up page | 168 | 452 | 73% |
Confirmation | 94 | 74 | 44% |
That table tells you something a page-by-page analytics view never can. The biggest loss is not at the end — it is from step two to step three. The sign-up page is not the problem (44% drop-off there is actually fine for many flows). Pricing-to-sign-up is where 73% of engaged visitors disappear. That is where your attention belongs, not the landing page.
Without this view, you would look at your sign-up page and see 168 visitors with 94 completions. That looks like a 56% conversion rate. Not bad, right? But the funnel tells you those 168 people had already survived two drop-off points. The issue was upstream.
What is a "normal" drop-off percentage
The illustrative numbers above are not benchmarks — they are a worked example. Real drop-off rates vary widely by industry, traffic source, device, and where the visitor came from. There is no universal "good" drop-off rate for a landing page or a pricing page.The only benchmark that matters for those steps is your own: what your drop-off was last month, and whether it is improving.
What the data does support: for e-commerce specifically, cart abandonment averages around 70% — meaning roughly seven out of every ten shoppers who add something to their cart do not complete the purchase. That figure has remained stable for nearly two decades across dozens of studies, including Baymard Institute's meta-analysis of 50 separate datasets. It is not a failure of individual stores. It is the structural reality of how people browse online, often using carts as wishlists or comparison tools.
The three metrics people confuse
Before you can read a funnel report, you need to be clear on what it is measuring versus what your other analytics are measuring. These three get mixed up constantly, and mixing them up leads to fixing the wrong thing.
Bounce rate
The percentage of visitors who land on a page and leave without visiting any other page on your site. A high bounce rate on a landing page might mean the page is not relevant to the traffic being sent there. Or it might mean the page answered all the questions that they had no reason to go further. Bounce rate alone does not tell you which, and it tells you nothing about what happened in the funnel.
Exit rate
The percentage of visitors who leave your site from a specific page, regardless of how many pages they visited before it. Every page has an exit rate — something has to be the last page a visitor sees. A high exit rate on a checkout confirmation is expected and fine. High exit rate on your pricing page is a signal worth investigating. But the exit rate still does not tell you where in the journey these people were.
Funnel drop-off
The percentage of visitors who reached a specific step in a defined sequence but did not proceed to the next step. This is the one that tells you about journey friction specifically. It is not about whether visitors left your site. It is about whether they continued toward a goal you defined.
A visitor can have a normal bounce rate, a normal exit rate, and still represent a catastrophic funnel drop-off. Each metric measures a different thing.
Of the three, funnel drop-off is the most actionable for conversion problems. The other two can point you to a page. Funnel drop-off points you at a specific break in a specific journey.
How to read your funnel report
When you open your funnel report for the first time, you will see a waterfall showing visitor counts and drop-off percentages at each stage. Here is the sequence that works:
Step 1: Find the biggest proportional drop-off
The standard move: identify the step with the largest percentage gap between visitors who arrived and visitors who continued. If step two to step three loses 55% of visitors while every other step loses 20%, step two to three is where you start. Prioritize by proportion, not by absolute visitor count.
Two patterns change this logic entirely.
The first: If drop-off is spread evenly across all steps with no single stage standing out — say, 20% at each step — you are probably not dealing with one broken page. You are dealing with a series of small friction points across the whole journey.Look at each step individually for one small improvement, which can compound into a meaningful overall lift
The second: a very large drop-off, specifically at step one. A disproportionate exit from your landing page to the second page is often an audience problem rather than a page problem. Check your traffic source data before you touch the page. If paid social is driving 80% of traffic and converting at 2% while organic converts at 18%, the page is probably fine. The audience is wrong.
Step 2: Segment by device
Filter your funnel by device type and look at mobile versus desktop separately. A step that loses 25% of visitors in aggregate often reveals a 65% mobile drop-off when you split the view — two completely different problems requiring completely different fixes.
Sometimes the device split shows almost no difference, and that absence is useful too. If mobile and desktop are dropping off at the same rate on the same step, the problem is more likely to be content, messaging, or pricing rather than a layout issue.. You have just ruled out an entire category of fixes.
Step 3: Segment by traffic source
If organic traffic completes your funnel at 18% and paid traffic completes it at 3%, the funnel steps are probably fine. The problem is an expectation mismatch between the ad and what the page delivers. Aggregate completion rates hide this entirely — which is why most teams running paid campaigns spend months optimizing pages that were never the issue.
Step 4: Connect to session recordings
Funnel analysis tells you where visitors drop off. It does not tell you what they experienced at that step. For that, filter your session recordings to visitors who reached the problem step but did not proceed. Watch 15 to 20 of them.
In most cases, the reason becomes specific and visible quickly — a mobile layout that collapses a pricing table, a CTA that sits below where most visitors stop scrolling, a form field that fires a confusing error.
But sometimes it does not. You watch 15 sessions, and visitors seem to read normally, scroll normally, and leave without doing anything obviously wrong. That result is information too — it usually means the problem is not a usability issue. The page is not broken. Visitors are reading it, not confused by it, and still not converting. That points to a different category of problem: the messaging is not convincing, the price feels wrong, there is a trust gap, or they need information that the page does not give them.
When recordings are inconclusive, the next move is to ask. A short on-page survey — one question, triggered before someone exits — can surface the reason recordings cannot show. "What stopped you from signing up today?" gives you answers that no amount of scroll data will. It is a different tool for a different kind of problem.
What to do when you find the drop-off
The most common outcome of looking at funnel data for the first time is identifying that one specific step is responsible for the majority of your conversion loss.
When you get there, resist the urge to change everything at once. Make one change. Run it for two to three weeks. Measure whether the funnel completion rate at that step improved. If it did, ship it and move to the next problem. If it did not, you have ruled out a hypothesis, which is also valuable.
Teams that run this process continuously are the ones that see conversion improve meaningfully over time. Each cycle builds on the last because every change is measured, and only winners are kept.
Setting up funnel analysis in Zoho PageSense
GA4 — the analytics tool most websites are now running by default — can technically build funnels. But the setup requires event tracking configuration, property-level changes, and a tolerance for a UI that was not designed with small teams in mind. Most non-technical users either never build the funnel at all or build one and cannot figure out why the data looks wrong.
Zoho PageSense includes funnel analysis on its free plan — one funnel, fully functional, set up from page URLs without touching any event configuration.
To set up a funnel in PageSense: define your steps using the page URLs in your conversion path, name the funnel, and save it. Visitor data starts populating immediately for anyone who goes through those pages after setup. Device and traffic source filters are built in.
The free plan covers one funnel. For most small sites, one is enough to start. Set it up for your primary conversion path, diagnose the biggest drop-off, fix it, and then decide whether you need additional funnels.