- HOME
- Customer Experience
- The right customer satisfaction metrics for every stage of customer support
The right customer satisfaction metrics for every stage of customer support
- Published : June 19, 2026
- Last Updated : June 22, 2026
- 75 Views
- 9 Min Read

We generally associate customer satisfaction or product success with not having a lot of customer queries from the same customer. Unfortunately, it's inaccurate to assume that a customer is satisfied just based on a decrease in the number of queries from them.
Fewer complaints don't always mean satisfaction. Sometimes, a customer is so frustrated with the poor resolution experience for their query, that they just stop complaining. Instead, they may take some time to evaluate other competitors' products, and when they get the right fit, they just silently walk away. Meanwhile, the original company persists in the delusion that the customer was satisfied because they were not complaining.
Customer satisfaction should not be based on anecdotal hunches. It is something that needs to be measured systematically, from the customer's perspective as well as the customer service representative's perspective.
What is customer satisfaction and why it is important?
Customer satisfaction is the extent to which a customer is happy with a product, service, or customer support experience. High customer satisfaction can increase the likelihood of repeat purchases and may eventually turn customers into advocates for the business.
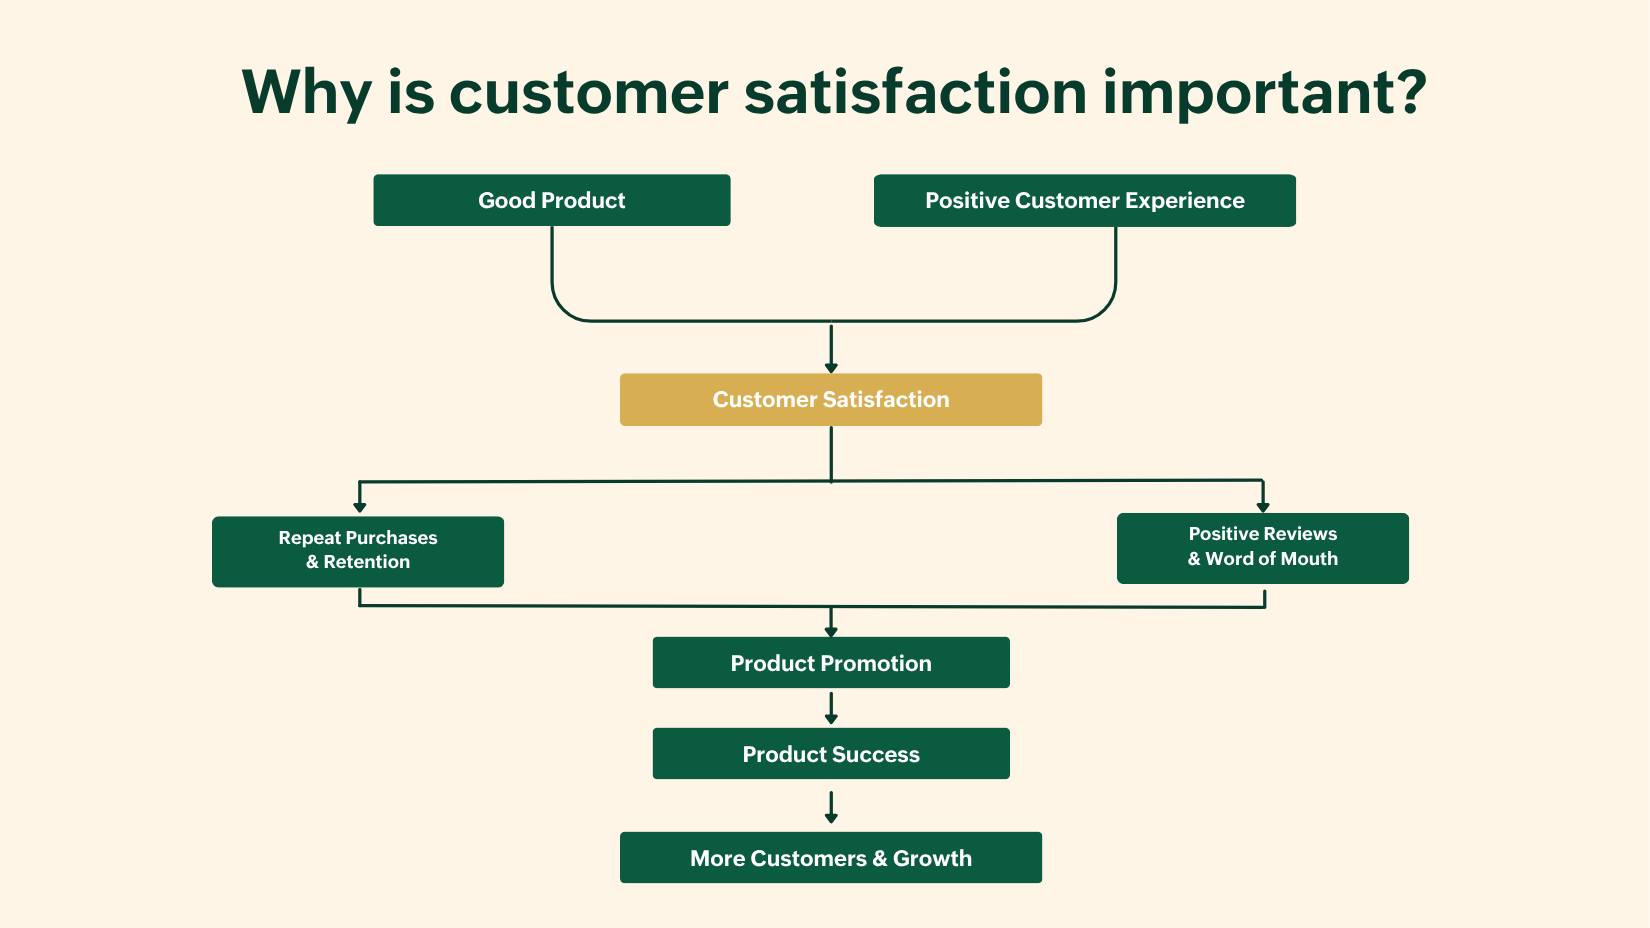
Customer satisfaction doesn't only come from a good product, but also from a good customer support experience. However good and easy to use your product may be, the customer always needs good ongoing support. This good support is one strong factor that can lead to word-of-mouth promotion of your product/service, which then leads to business growth and product/service success. So, everything is interconnected. Here is a simple diagram to show the importance of customer satisfaction in business success.
What are the core stages of customer support?
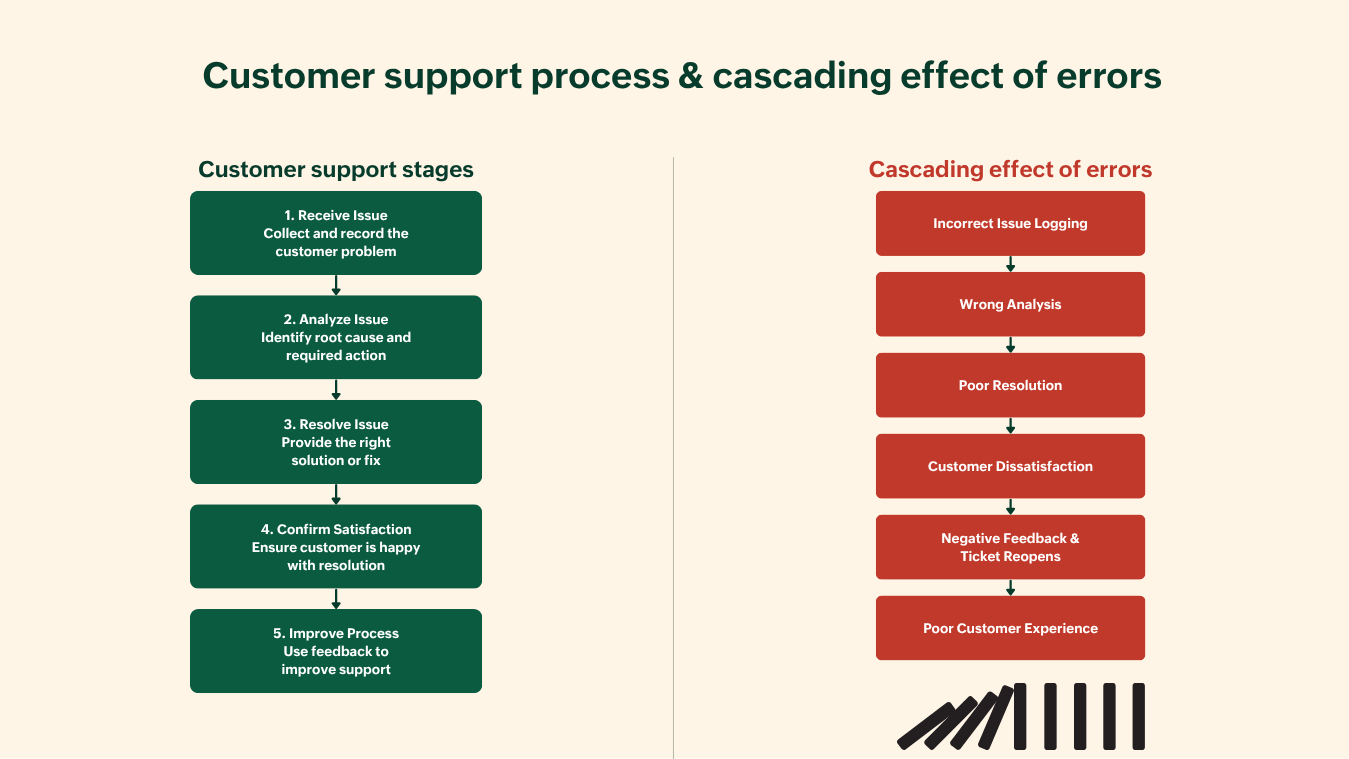
When we think of customer support, it sounds basic. Get a customer query, resolve it, and you are done. It is not actually as simple as it sounds, but you can make it simpler with the right set of tools. Customer support comprises 5 core stages:
Receive issue: Collect and record the customer’s problem or request.
Analyze issue: Understand the root cause and assess the required action.
Resolve issue: Provide a solution or fix to address the customer’s concern.
Confirm satisfaction: Ensure the customer is satisfied with the resolution provided.
Improve process: Use feedback and insights to enhance support quality and efficiency.
Ensuring good support at each of these customer support stages is crucial. An error at any of these stages can have a cascading effect, resulting in a bad customer experience. For example, if you have not logged a customer complaint accurately, it will not get assigned to the right team for analysis. If it is not analyzed correctly, then the resolution won't be up to the mark. If the resolution is not right, then the customer won't be satisfied, and if the customer is not satisfied, it will lead to negative feedback, ticket reopenings, and case queue conundrums.
Recommended read: The ultimate guide to ticketing and case-management for modern customer support.
What are the customer satisfaction metrics for each stage of customer support?
We have summarized the customer satisfaction metrics along with the operational metrics at each stage of customer support in the table below.
Support Stage | Purpose | Customer Satisfaction Metrics | Supporting Operational Metrics |
|---|---|---|---|
1. Receive Issue | Capture the customer's problem accurately and promptly | Customer Effort Score (CES) for issue submission, Initial Experience CSAT | First Response Time (FRT), Queue Wait Time, Ticket Creation Accuracy, Ticket Volume |
2. Analyze Issue | Understand the problem and determine the correct course of action | CES ("I didn't have to repeat myself"), Communication Quality CSAT | Reopen Risk, Escalation Rate, Average Diagnostic Time, Information Completeness |
3. Resolve Issue | Fix the issue or answer the request | Resolution CSAT, First Contact Resolution (FCR) | Time to Resolution (TTR), Resolution Rate, SLA Achievement, Repeat Contact Rate |
4. Confirm Satisfaction | Verify the solution worked and met expectations | Post-Resolution CSAT, Net Promoter Score (NPS), Customer Confirmation Rate | Follow-up Response Rate, Ticket Reopen Rate, Retention Rate |
5. Improve Process | Learn from interactions and prevent future issues | Trend in CSAT, Trend in NPS, Trend in CES | Root Cause Elimination Rate, Knowledge Base Effectiveness, Self-Service Success Rate, Defect Reduction |
Important metrics at different stages of customer support
Stage 1: Receive issue — measure how easy it is to get help
Customer Effort Score (CES)
From the above table, it is evident that the customer effort score comes into play in two stages of customer support: the Receive stage and the Analyze stage. In the Receive stage, it measures how easily a customer's issue gets registered by the support team. This indicates customer satisfaction at the initial stage of the customer support journey.
CES formula for numerical scale
CES = (Sum of all customer effort ratings) / (Total number of survey responses)
CES formula for emoticon/emoji scale
CES = Percentage of positive responses - Percentage of negative responses
First Response Time (FRT)
First Response Time is an operational metric, and it measures how quickly a customer support team responds to a customer's query. Delays in response can frustrate customers and lead to dissatisfaction, potentially prompting them to voice their concerns publicly and damage your brand image. Therefore, addressing delays at this stage is crucial.
The limitation of FRT
First Response Time can become misleading when it is measured as a standalone metric for customer support quality. It measures how quickly the first response is sent, but does not guarantee that the issue is resolved. FRT is one factor contributing to good customer support, but because it doesn't measure the quality of resolution, it is not sufficient on its own.
Formula for FRT
FRT = Total of first response times - Number of resolved tickets
Stage 2: Analyze issue — measure understanding and communication
Customer Satisfaction (CSAT)
In the Analyze stage, the customer is not judging the support team on issue resolution, but they are judging whether the support team understood their problem and communicated properly. The key metrics for this stage are Customer Effort Score (CES), especially “I didn’t have to repeat myself,” and Communication Quality CSAT, which measures how well the support representative understood and communicated with the customer. These metrics help to understand whether the customer had a smooth experience or had to put in extra effort to explain the problem.
Poor analysis often leads to confusion and repeated explanations that frustrate customers, while good diagnosis helps resolve the query faster and brings customer satisfaction.
Formula for CSAT
CSAT (%) = (Number of Positive Responses ÷ Total Responses) × 100
After a support interaction, customers are asked something like: "How satisfied were you with the communication you received today?"
When they give a response, the CSAT is calculated for their responses using the above formula. It's important to note that CSAT only counts responses received — it doesn't account for customers who didn't reply. Low response rates can skew scores, so always track response rate alongside CSAT for an accurate picture.
Stage 3: Resolve issue — measure solution effectiveness
This stage is mostly outcome-driven. In this stage, customers expect quality resolution for their queries, even more than the speed of resolution. Speed of resolution is important, but whether they get their issues resolved according to their expectations is what holds the utmost importance. Therefore, at this stage, support agents should focus on effectiveness and the quality of resolution provided. Quality can be measured by metrics like First Contact Resolution and Resolution CSAT, while resolution speed can be measured by Time to Resolution (TTR).
First Contact Resolution
First Contact Resolution measures the percentage of issues resolved during the first interaction without requiring follow-ups, transfers, or escalations.
Formula for FCR
FCR % = (Total no. of issues resolved in first contact / Total issues )* 100
A high FCR indicates that support reps understood customer issues and provided effective solutions quickly, which also reduces customer effort and improves satisfaction.
Resolution CSAT
Resolution CSAT measures how satisfied customers are with the solution provided. It focuses on the outcome rather than the speed of service.
A higher CSAT score at this stage means the customer's query has been resolved satisfactorily.
Time to Resolution (TTR)
This measures the time taken to resolve a customer's issue fully, from ticket creation to ticket closure.
Formula for TTR
TTR = Issue resolution time − Issue creation time
If a customer creates a ticket at 10:00am and it gets resolved by 2:00pm, then the TTR is 4 hours. This metric can also give an idea of what kinds of tickets require a longer TTR and what kinds require a shorter TTR. With this information, support admins can strategize their support methodologies to ensure faster resolution for both types of tickets.
Why quick closure does not equal effective resolution
If a ticket is closed quickly, it doesn't always mean a better resolution. Operational indicators always measure efficiency and not quality. Customer satisfaction is mapped through the quality of resolution. If the customer is not satisfied with the provided resolution, it will bring your CSAT metric down no matter how fast you mark a ticket as resolved.
So, at this stage, FCR and resolution CSAT hold more value than the TTR.
Stage 4: Confirm satisfaction — measure customer perception after resolution
A customer can walk away with the right answer and still feel let down. Maybe the wait was too long. Maybe the tone felt dismissive. Maybe they had to explain themselves three times. Resolution closes the ticket — but it doesn't close the experience. Support teams need to measure both.
Therefore, after resolving an issue, support teams should measure how customers perceive the overall experience and whether their expectations were met.
Customer Satisfaction Score (CSAT)
This measures how happy the customer is with the overall support they received from the support team.
Example survey question:
"How satisfied are you with the overall customer experience?"
CSAT helps organizations understand whether customers feel their issue was handled effectively and professionally.
Net Promoter Score (NPS)
Net Promoter Score (NPS) measures customer loyalty by asking how likely customers are to recommend the company to others.
Example survey question:
"On a scale of 1-10, how likely are you to recommend our product/service to your friend or colleague?"
Formula for NPS
NPS = (No. of promoters / total responses * 100) - (No. of detractors / total responses * 100)
OR
NPS= % Promoters - % Detractors
NPS score range
NPS Score | Interpretation |
|---|---|
Above 0 | Good |
Above 0 | Good |
Above 0 | Good |
Above 0 | Good |
While CSAT measures satisfaction with a specific support interaction, NPS reflects the customer's overall perception of the brand and their likelihood to remain loyal.
Stage 5: Improve process — measure continuous improvement
Fixing a customer's issue is not the finish line. It is just one lap in a longer race.
Great support teams are not just reactive. They are constantly asking a harder question: why does this keep happening? A spike in tickets is not just a workload problem. It is a signal. Something in your product, your process, or your communication is consistently breaking down, and your customers are paying the price for it.
That is exactly why continuous improvement cannot run on gut feel. It needs to be measured.
The metrics that matter at this stage are:
CSAT trends over time — not just your current score, but whether it is consistently moving in the right direction
CES (Customer Effort Score) trends — is it getting easier for customers to get help, month over month?
Repeat issue reduction — are the same problems showing up in your queue again and again, or are root causes actually being fixed?
Self-service success rate — can customers solve problems on their own using your help center, FAQs, or chatbot, or are they hitting dead ends and escalating anyway?
One number in isolation tells you very little. But when these metrics move together — or contradict each other — that is where the real insight lives.
Where support analytics becomes your most valuable asset
Your ticket data is not just a record of past problems. It is a map of where your product, your documentation, and your processes are failing customers repeatedly. Well-analyzed metrics tell you which complaint categories are trending up, where agents are spending most of their time, and which workflows are creating unnecessary friction.
From there, the improvement loop becomes concrete: better agent training, sharper documentation, smarter internal processes. And when you layer in AI and automation — intelligent ticket routing, predictive issue detection, proactive self-service — you are not just responding to problems faster. You are preventing a meaningful share of them from becoming tickets at all.
The teams that win in the long term are not the ones with the fastest resolution times. They are the ones who make the same problem less likely to recur next month than it was this month — and can prove it with data.
That is what continuous improvement actually looks like.
 Pallavi Sinha
Pallavi Sinha is a Product Marketer at Zoho Corporation, where she works on product positioning and messaging for Zoho Desk. With hands-on experience in both customer support software and the HR tech industry, she brings a strong understanding of how SaaS products solve real business challenges. Outside of work, she enjoys reading business stories and biographies to learn from real-world leadership and growth journeys.