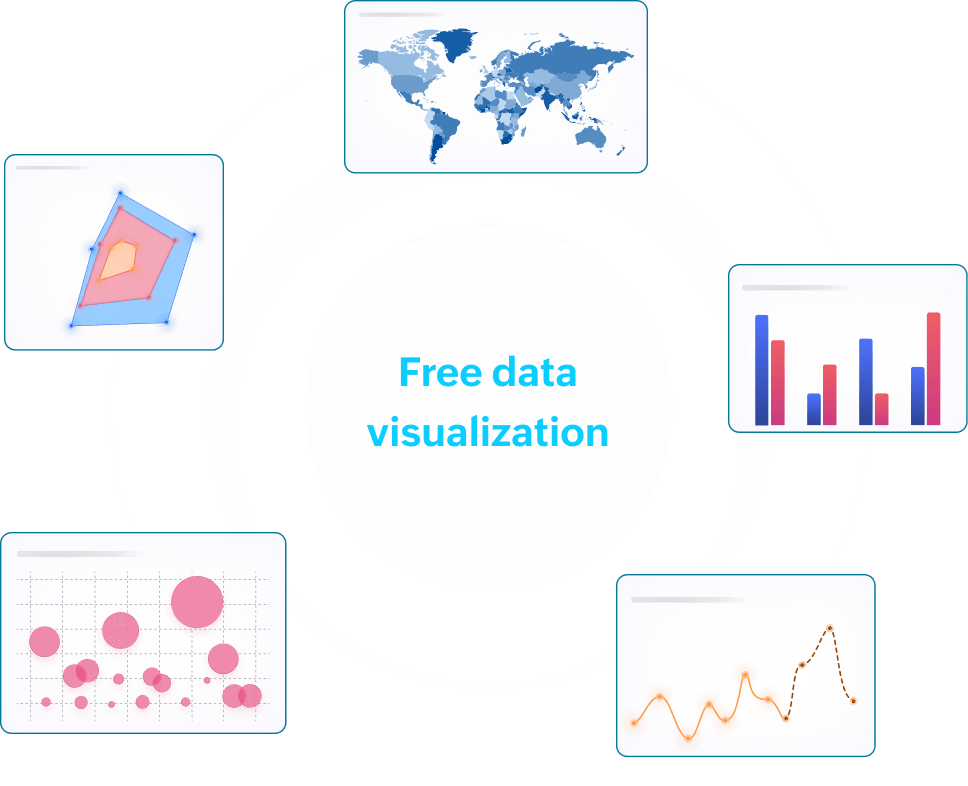
Machen Sie mit einer kostenlosen Datenvisualisierungssoftware aus Ihren Daten beeindruckende Grafiken
Klare Erkenntnisse sind der Schlüssel zu besseren Entscheidungen, unabhängig von der Größe Ihres Unternehmens. Für Startups und kleine Unternehmen haben kluge Entscheidungen eine sehr hohe Bedeutung. Aber begrenzte Ressourcen dürfen Ihre Analysen nicht einschränken. Mit unserer kostenlosen Datenvisualisierungssoftware können Sie Ihre komplexen Daten in wenigen Minuten in leicht verständliche Berichte und Dashboards umwandeln.
Kostenlos anmelden
- 16.000
Kunden
- 3 Mio.
Benutzer
Warum benötigen Sie eine kostenlose Datenvisualisierungssoftware?
Ein kostenloses Datenvisualisierungstool hilft Ihnen dabei, komplexe Informationen zu verstehen, indem es Rohdaten in übersichtliche, interaktive Diagramme und Berichte umwandelt. Anstatt sich mit Tabellen und Zahlen herumzuschlagen, können Sie Trends, Muster und Erkenntnisse auf einen Blick erkennen.
Mit Zoho Analytics als Datenvisualisierungssoftware können Sie ganz einfach Berichte und dynamische Dashboards erstellen und datengestützte Erkenntnisse kommunizieren.
Klare Einblicke und intelligentere Geschäftsentscheidungen sind nicht nur kostenlos – sie sind nur drei einfache Schritte entfernt!
Bringen Sie Ihre Daten mit
Importieren Sie Daten aus über 100 Quellen, darunter Cloud-Speicher, Dateien, Feeds, Datenbanken, Data Warehouses, Data Lakes und relationale Datenbanken

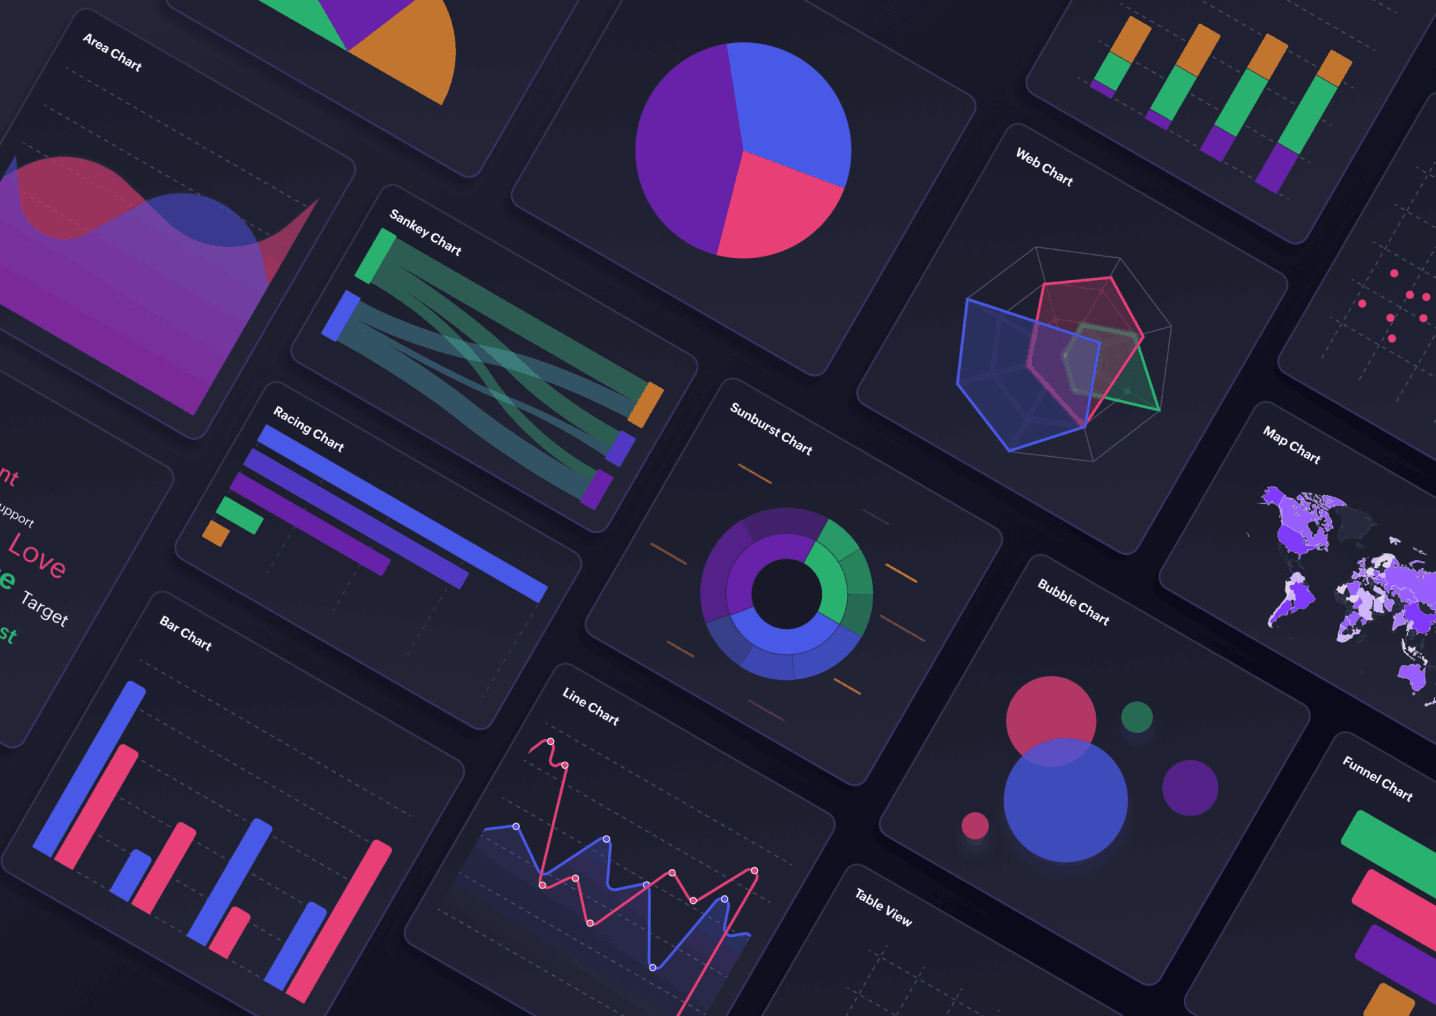
Daten visualisieren
Erstellen Sie Berichte und Dashboards mit über 75 Visualisierungstypen. Mit unserer intuitiven Drag-and-Drop-Oberfläche lassen sich in wenigen Minuten ansprechende Grafiken erstellen.
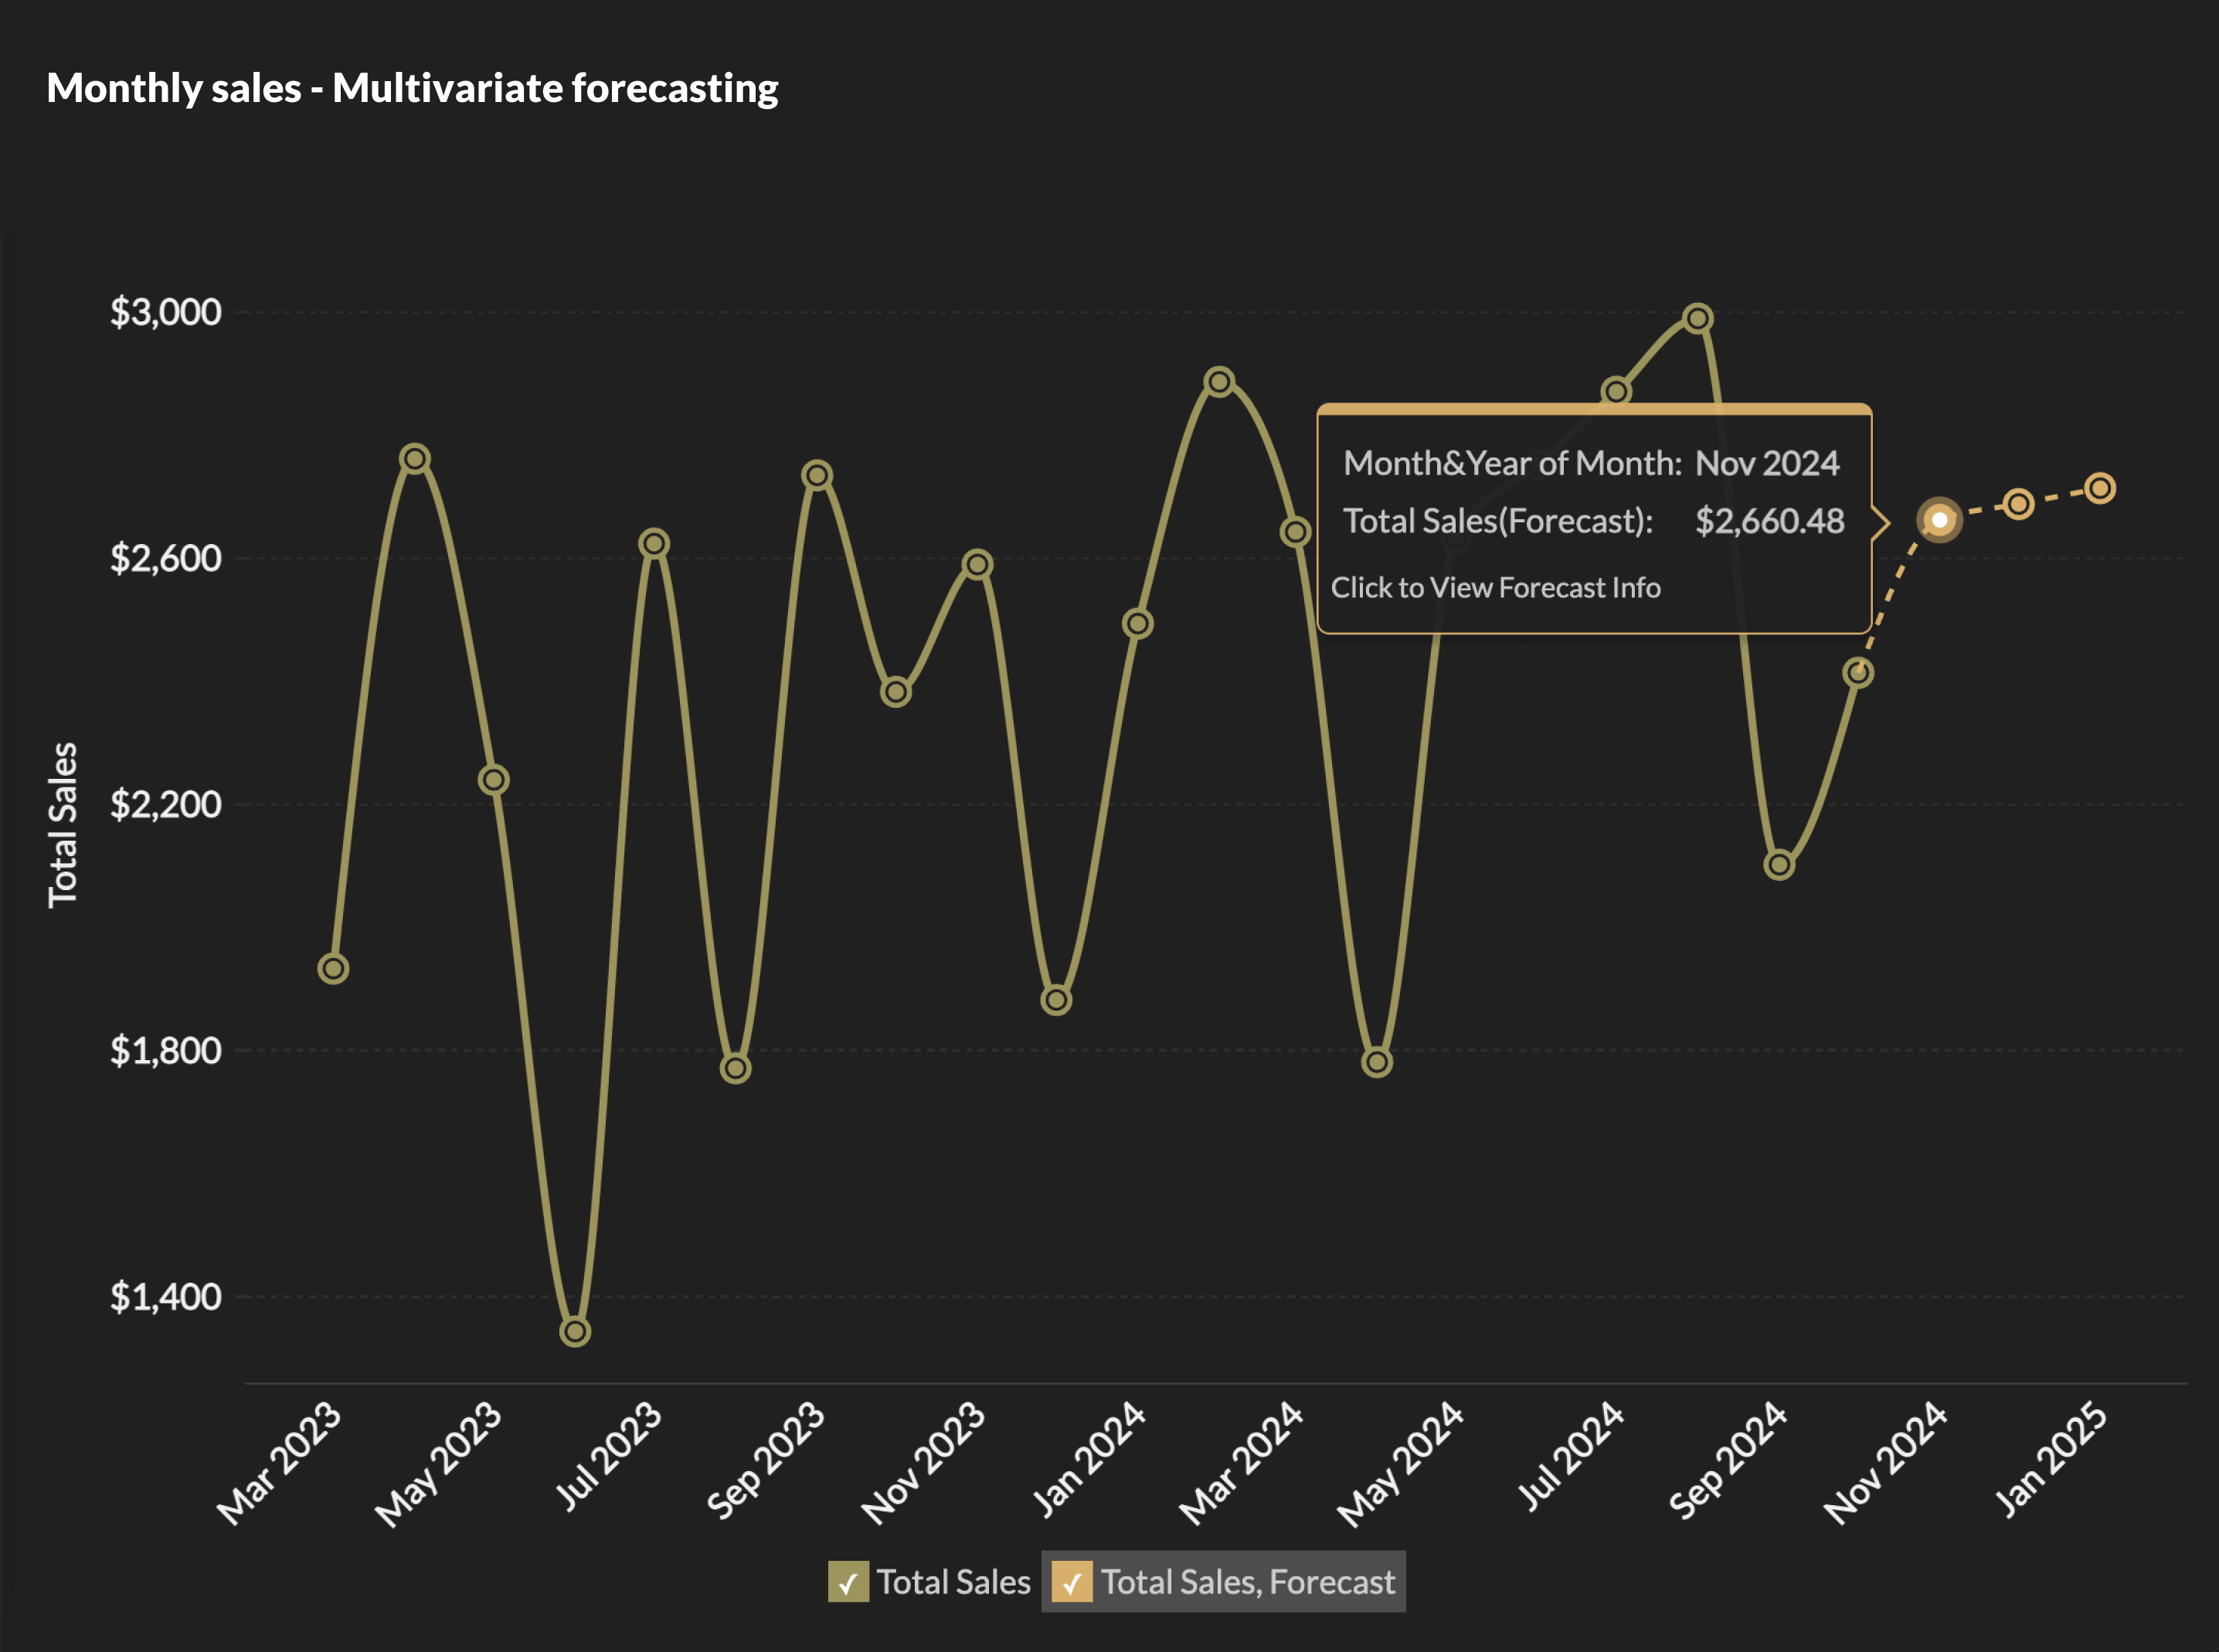
Wichtige Erkenntnisse analysieren und extrahieren
Erkennen Sie in Ihren Berichten Muster und Trends auf einen Blick. Nutzen Sie KI-basierte Funktionen wie Prognosen, Was-wäre-wenn-Analysen und Anomalieerkennung, um tiefere Einblicke zu gewinnen.
Wichtige Funktionen des kostenlosen Tarifs von Zoho Analytics
Für Startups und kleine Unternehmen, die ihre Daten besser nutzen möchten, ist der kostenlose Tarif von Zoho Analytics die perfekte Lösung. Sie ist mit zahlreichen fortschrittlichen Funktionen ausgestattet und verkürzt die Zeit bis zur Gewinnung von Erkenntnissen wesentlich.
Einfache Integration
Sie können Daten reibungslos verbinden, importieren und integrieren, von Tabellenkalkulationen bis hin zu Cloud-Datenbanken.
Automatische Datensynchronisierung
Planen Sie tägliche Datenimporte, um Ihre Informationen automatisch auf dem neuesten Stand zu halten.
Unbegrenzte Berichte und Dashboards
Erstellen Sie private Berichte und Dashboards ohne Einschränkungen.
KI-gestützte erweiterte Analysen
Erhalten Sie tiefere Einblicke mit KI-Funktionen wie prädiktiven Analysen, Was-wäre-wenn-Analysen, automatischen Analysen und Anomalieerkennung.
Einfache Zusammenarbeit
Teilen und mit Teammitgliedern zusammenarbeiten (bis zu zwei Benutzer).
Mobile App
Mit speziellen mobilen Apps für Android und iOS können Sie Berichte und Dashboards auch unterwegs ansehen und verwalten.

Mit der kostenlosen Datenvisualisierungssoftware von Zoho Analytics

Ihre Analysten erhalten …
- Interaktive Diagramme und Grafiken
- Automatische Datenaktualisierungen
- Anpassbare Dashboards
- Einfach freizugebende Berichte
- KI-gestützte Erkenntnisse
Ihre Manager erhalten …
- Leistungsverfolgung und KPIs
- Automatisierte Berichterstellung
- Trendanalyse und Prognosen
- Datengestützte Entscheidungsfindung
- Reibungslose Teamzusammenarbeit
Ihr Unternehmen wird …
- Effizienter
- Schlagfähig
- Kollaborativ
- Skalierbar
- Datenorientiert
Meinungen unserer zufriedenen Kunden
Alle Erfahrungsberichte ansehen
Connor Nobert
Director of Analytics and Technology, Pulse LLC"Zoho Analytics gives us a superior edge over Power BI and Tableau, when it comes to the aesthetics of visualization. We're very happy with Zoho’s capability."

Steve Dubane
Gründer und CEO, Wingman Media"Zoho Analytics created a tremendous amount of value for the agency and takes our relationship with clients to the next level. The preparedness to integrate the data, build alluring visualizations, and its shrewdness have given us the ability to retain clients.

Korvi Rakshand
Founder, JAAGO Foundation"Our main intent was to make data-driven decisions. We use Zoho CRM and Zoho Books and we wanted to precisely analyze every single data point from these apps. So we fell back on Zoho Analytics. The visualization with data precision is impeccable and we are extremely happy with the Zoho suite of products."

ED Levis
Head of IT, NYC Navigator"Data visualization is important for any BI tool. It's great to present data in a way that is meaningful to the audience, helping them quickly grasp the content. That’s where Zoho Analytics is very strong. We now analyze our sales, operations, and finance using Zoho Analytics."

Daniel Franey
Director & Shareholder, Courier Logistics Limited"With Zoho Analytics, the ability to visualize things became easy. Most of my managers now use Zoho dashboards and quickly create reports themselves. Its usability features, like easy drag and drop filters and drill down options, are top-notch."
Ben Smith
Berater und ehemaliger COO bei Sugarfina"Zoho Analytics is the only product with the right mix of cost and value—with features like data visualization, integration, data blending, collaboration, user filters, drag and drop, geomaps, and much more at an affordable price."
Maurizio Pisana
IT Manager bei Caffe Moak“Zoho Analytics—being fast, simple, yet compelling BI software —made our lives easier for importing, integrating, and analyzing data. Visualization is another plus in this product, and dashboards are very appealing."
Connor Nobert
Director of Analytics and Technology, Pulse LLC"Zoho Analytics gives us a superior edge over Power BI and Tableau, when it comes to the aesthetics of visualization. We're very happy with Zoho’s capability."
Steve Dubane
Gründer und CEO, Wingman Media"Zoho Analytics created a tremendous amount of value for the agency and takes our relationship with clients to the next level. The preparedness to integrate the data, build alluring visualizations, and its shrewdness have given us the ability to retain clients.
Korvi Rakshand
Founder, JAAGO Foundation"Our main intent was to make data-driven decisions. We use Zoho CRM and Zoho Books and we wanted to precisely analyze every single data point from these apps. So we fell back on Zoho Analytics. The visualization with data precision is impeccable and we are extremely happy with the Zoho suite of products."
ED Levis
Head of IT, NYC Navigator"Data visualization is important for any BI tool. It's great to present data in a way that is meaningful to the audience, helping them quickly grasp the content. That’s where Zoho Analytics is very strong. We now analyze our sales, operations, and finance using Zoho Analytics."
Daniel Franey
Director & Shareholder, Courier Logistics Limited"With Zoho Analytics, the ability to visualize things became easy. Most of my managers now use Zoho dashboards and quickly create reports themselves. Its usability features, like easy drag and drop filters and drill down options, are top-notch."
Ben Smith
Berater und ehemaliger COO bei Sugarfina"Zoho Analytics is the only product with the right mix of cost and value—with features like data visualization, integration, data blending, collaboration, user filters, drag and drop, geomaps, and much more at an affordable price."
Maurizio Pisana
IT Manager bei Caffe Moak"Zoho Analytics—being fast, simple, yet compelling BI software—made our lives easier for importing, integrating, and analyzing data. Visualization is another plus in this product, and dashboards are very appealing."