Identify trends, uncover gaps, and act faster with Zoho Tables Reports

Overview
Data is everywhere. It holds the signals, trends, and context you need to make smarter decisions.
But tapping on those patterns can often feel like digging through spreadsheets, exporting data from multiple apps, or piecing together scattered metrics—in short, searching for a needle in a haystack!
In today’s fast-paced, AI driven workplace, teams can’t afford to waste hours building static reports that are outdated the moment they’re shared. Decision-making needs to be quick, contextual, and backed by real-time insight, and not just relying on your gut instinct.
Sometimes, you must simplify things to tell the clearest and most accurate story.
That's why we're thrilled to introduce you to Reports in Zoho Tables! With just a few clicks, you can transform your raw data into dynamic reports, combining Charts, KPIs, and Grids into one clear snapshot. It's interactive, living, and always up to date.
Because in 2025, reports aren’t just for looking back; they’re for acting now with the intelligence that's already there.
Let's first look at some common struggles you might face while trying to gather this data and how Zoho Tables solves this problem by enabling teams to take charge of their data like never before!
The struggle: Some common issues businesses face with collecting data.
1. Endless Data sprawl
Data sprawl typically means the accumulation of large sets of data in an organisation that are largely scattered across tools and teams beyond the point of managing and deriving insights from them. Without a single source of truth, insights become fragmented and decision-making slows down. The result? Higher costs, wasted talent, and strategies built on incomplete data.
2. Misses in data preparation
Businesses often struggle with messy data that's full of inaccuracies, inconsistencies, and duplicates. This, in turn, slows down preparation and skews results. Poor-quality data means wasted time, unreliable analysis, and decisions made on shaky ground.
3. Lack of data wisdom
Many businesses collect data but get stuck in the DIKW (Data → Information → Knowledge → Wisdom) hierarchy, stopping at data or information, without progressing to knowledge and wisdom. Without this evolution, they miss the clarity needed for smart, forward-looking decisions.
4. Bad visualizations
Using the wrong visualization method for deriving a certain type of insight or presenting excessive data can lead to misleading visualizations. On the other hand, showcasing oversimplified representations may also result in a report that misrepresents the actual situation.
Key Reports features and capabilities in Zoho Tables
When you’re turning raw data into insights, the right building blocks matter. Zoho Tables Reports come packed with simple yet powerful options, like charts, KPIs, and grids, each suited for different purposes. Let's look at what they are:
1. KPI cards
KPIs keep you focused on critical metrics. Whether it’s monthly revenue, churn rate, or leads closed, KPIs give you at-a-glance numbers.
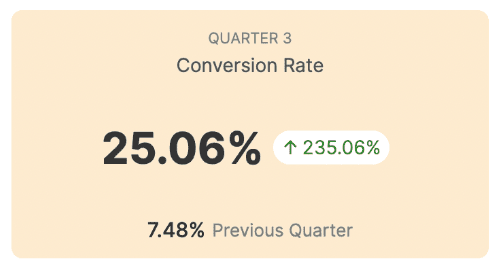
KPI to track your conversion metrics for your ad campaign
2. Charts
Spot trends, track performance, and compare metrics without getting lost in rows and columns using any of the four options, i.e., column, bar, line, and pie. 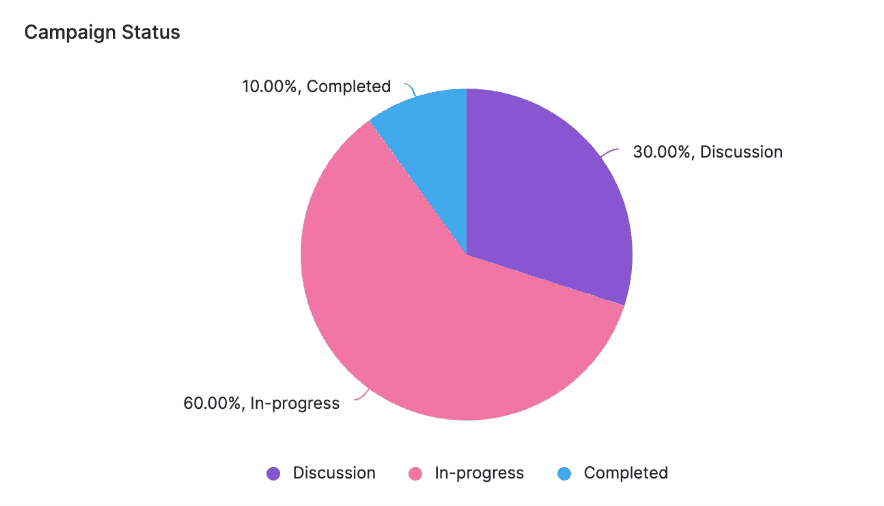
Pie chart to show the progress of your campaigns
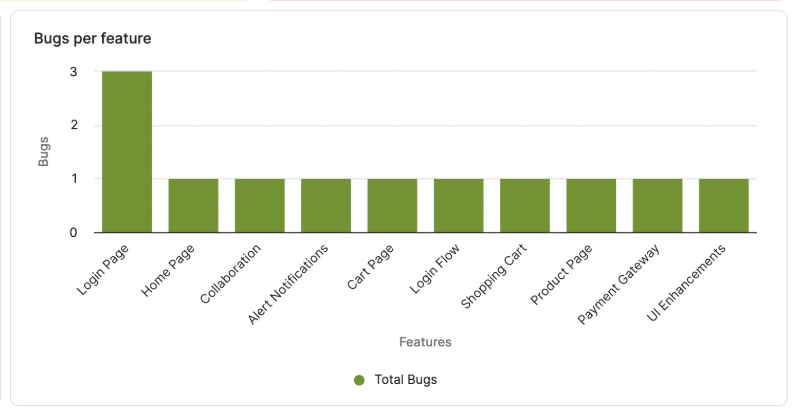
Column chart to indicate the number of bugs per feature 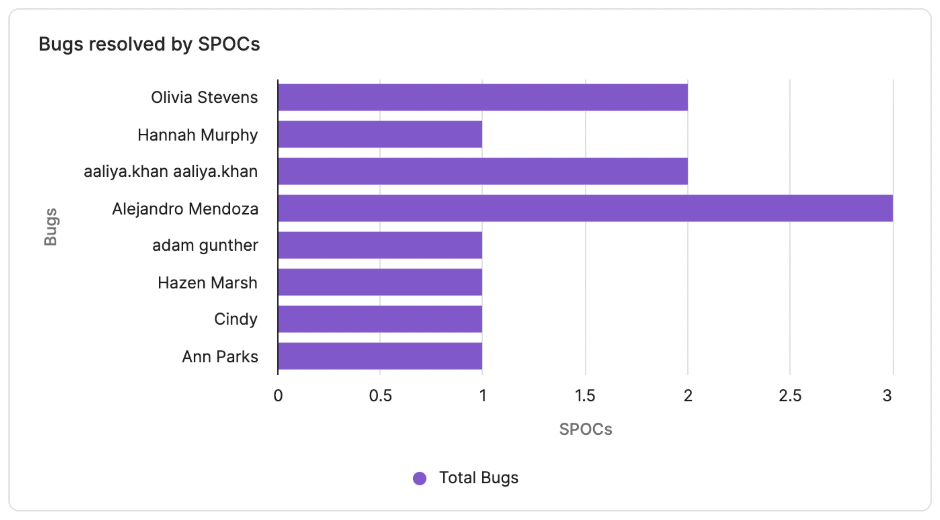
Bar chart to highlight the number of bugs resolved by SPOCs 
Line chart to identify trends across different departments
3. Text blocks
Numbers might not always convey the entire information. Text blocks come in handy to add commentary, context, or next steps so everyone knows what the data means and what to do with it.
Text block element to add titles
4. Grids
Sometimes you want to see your raw data in a tabular format. Grids give you structured tables of data that can be filtered, sorted, and scanned alongside your visuals. They can be used to gain an overview of all your marketing campaigns, scan a filtered view of completed tasks, monitor all open support tickets, and much more.
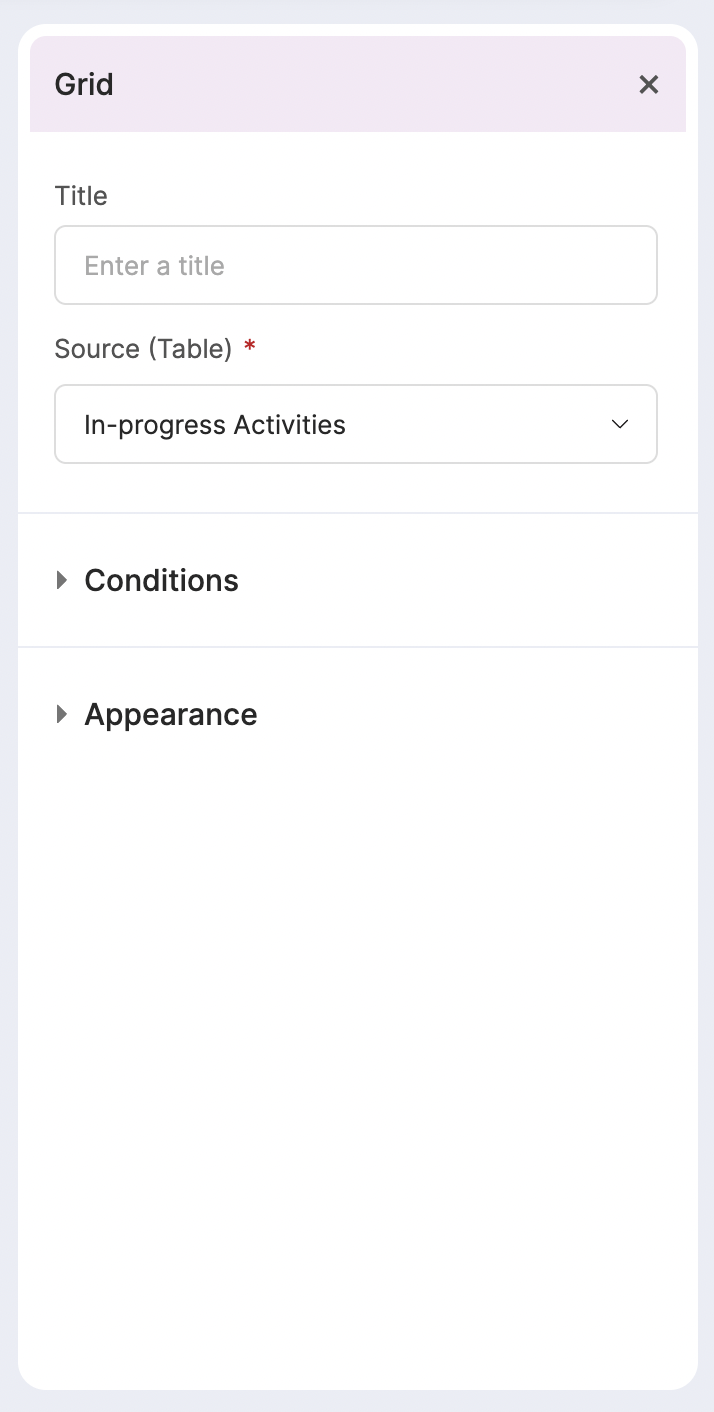
Grid element
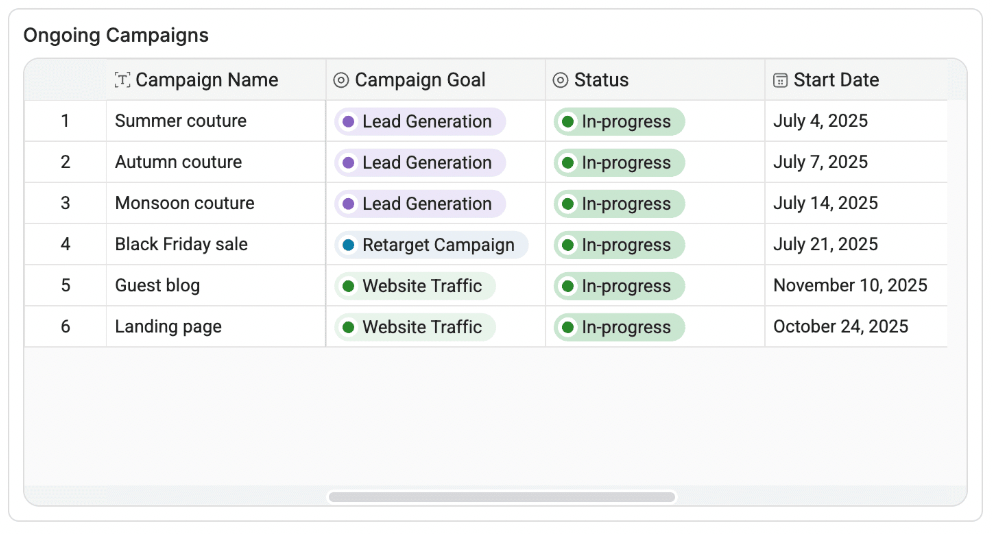
Grid element to get an overview of all your campaigns
By combining these elements, you can create fully customized reports tailored to your team’s workflow and data visualization needs.
For a step-by-step walkthrough of building custom dashboards in Zoho Tables, see our Help guide.
Reports at work: Everyday use cases you’ll relate to
Here’s how teams across the board put Zoho Tables Reports to work:
1. Track your marketing impact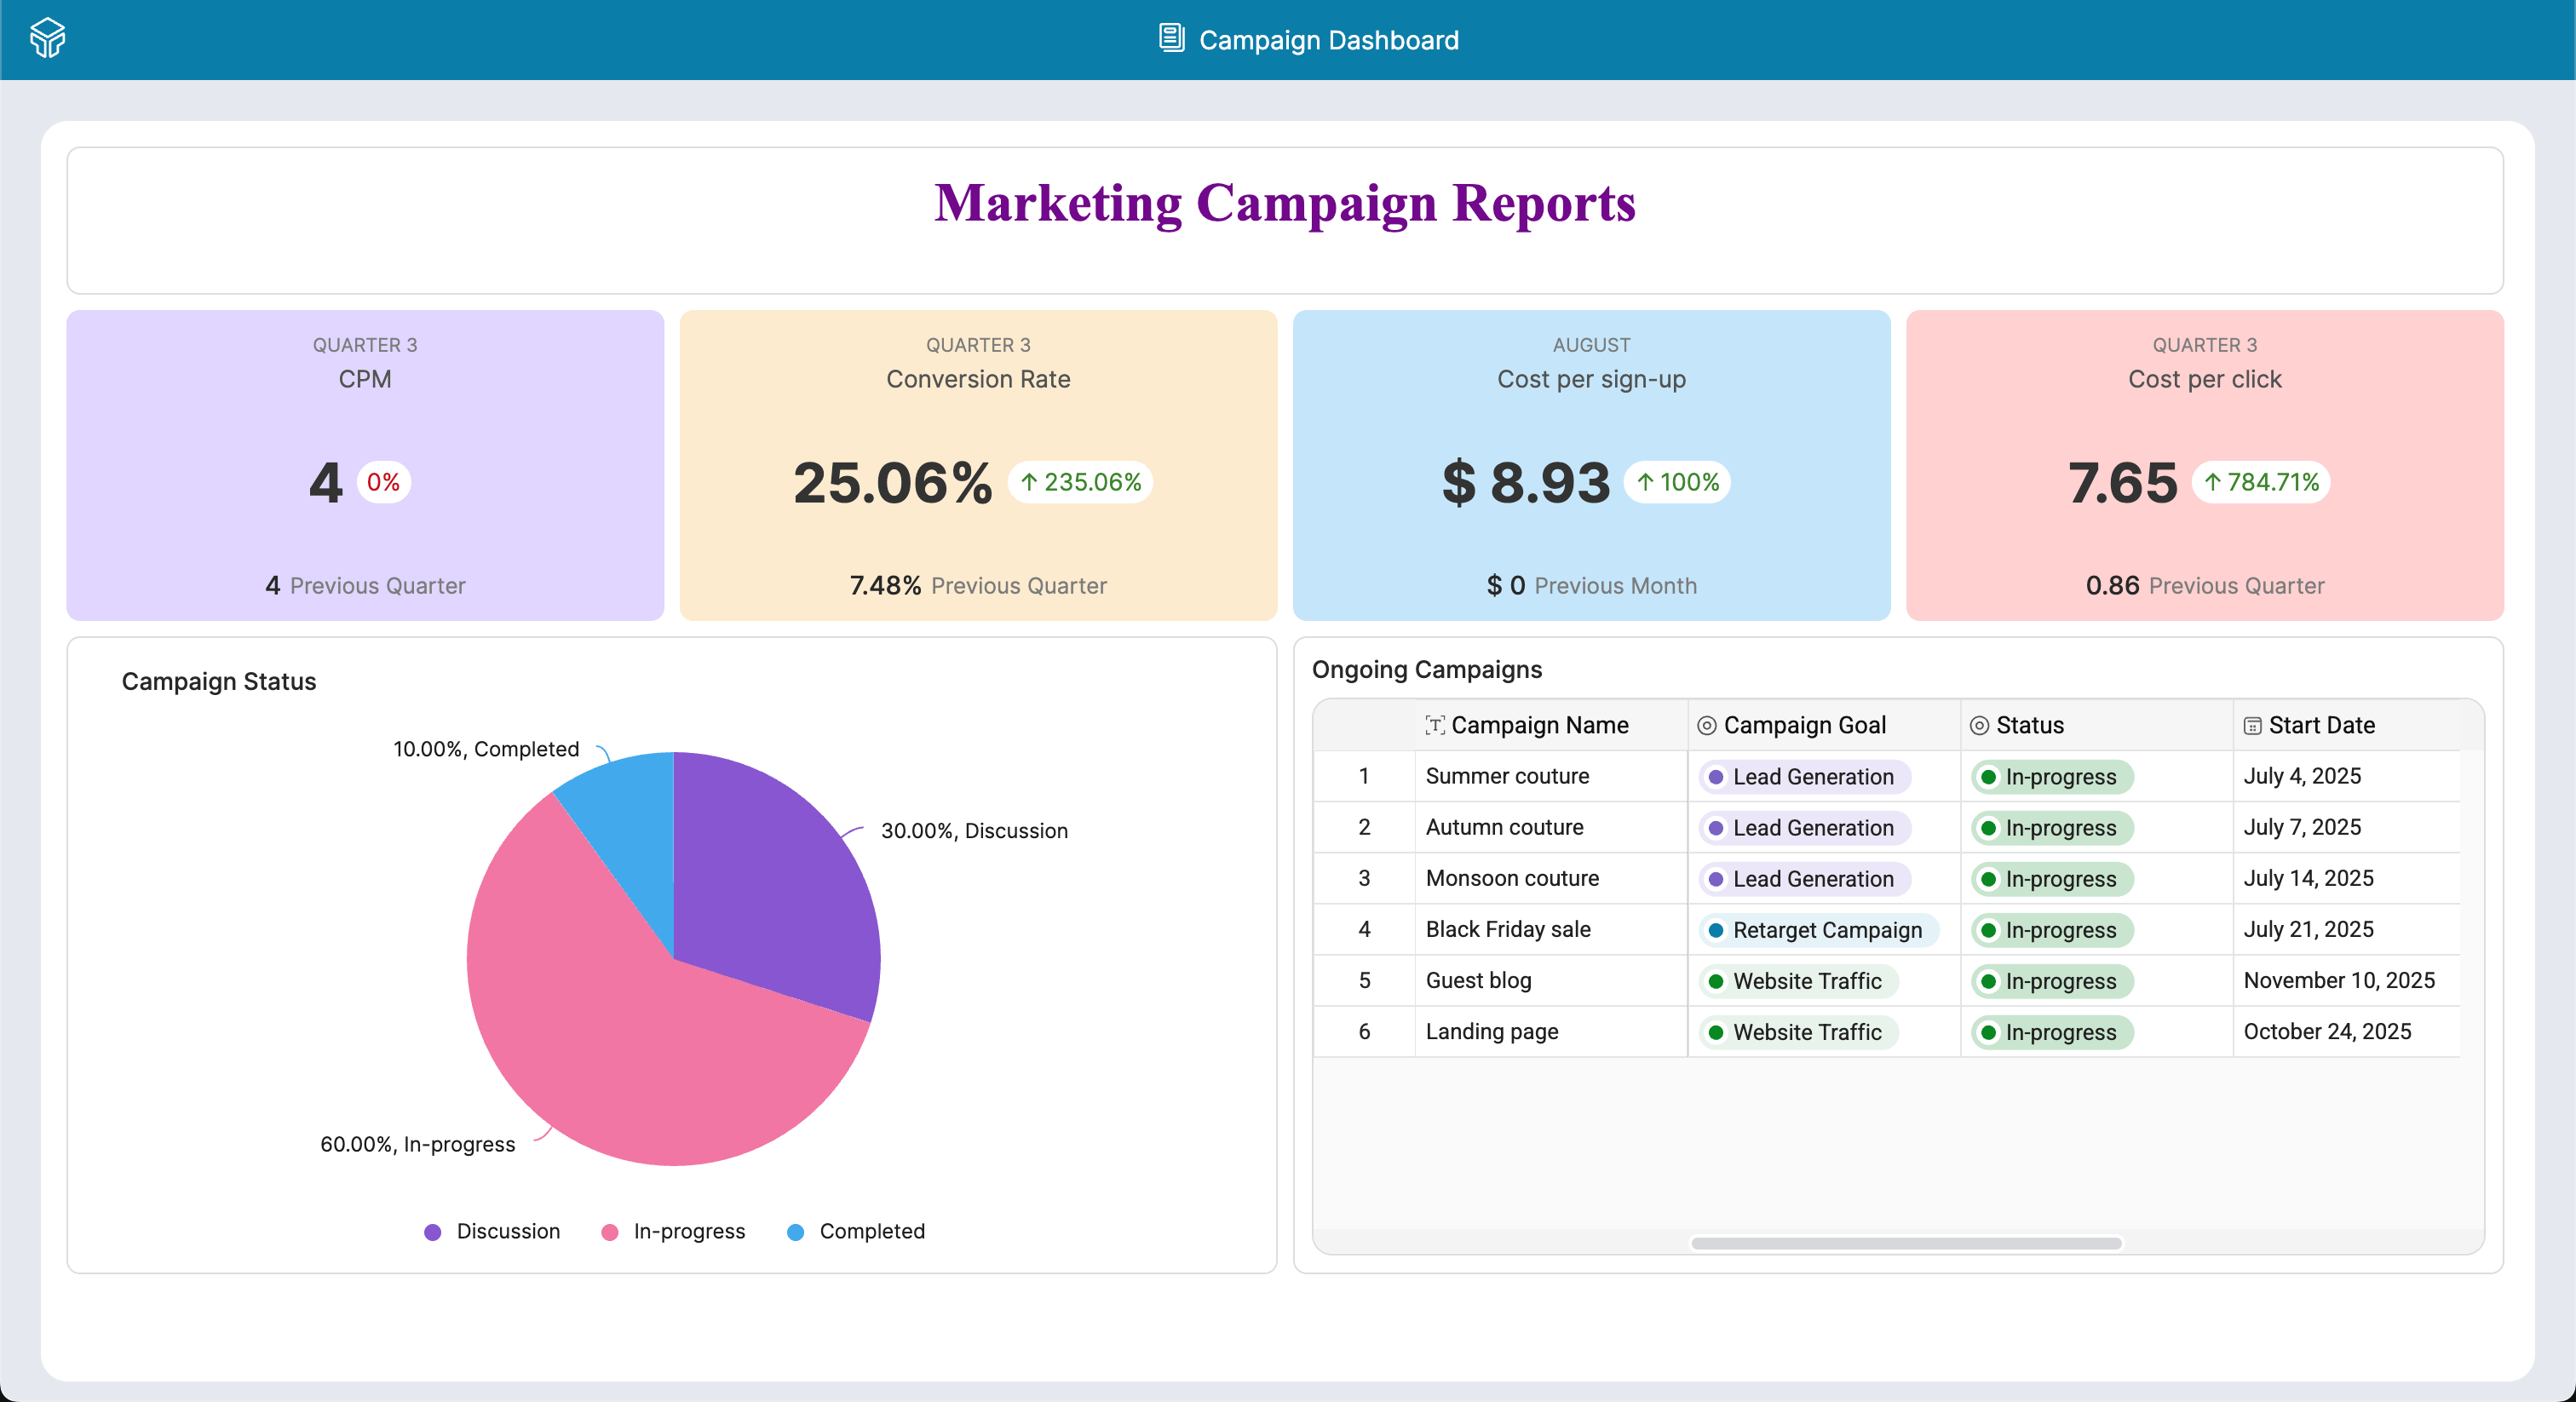
Marketing Campaign Performance Report
Monitor campaign performance in real-time with visual dashboards showing ROI, reach, and conversions. Teams can instantly spot what’s working and tweak strategies on the fly.
2. Streamline your bug tracking![]()
Bug Tracker Report
Turn bug logs into actionable insights by visualizing frequency, severity, and resolution timelines. This helps dev teams prioritize fixes and improve product stability faster.
3. Stay on top of team performance
Employee Performance Report
Move beyond spreadsheets to identify employee performance trends by analysing KPIs, achievements, and development requirements. Managers get a clear picture to drive growth and fair evaluations.
4. Keep your content organized![]()
Blog Tracker Report
Monitor blog performance, distribution channels, and engagement. All this in one report.
Wrapping up
The new Reports feature in Zoho Tables transforms large sets of data into meaningful narratives.
From high-level key performance indicators (KPIs) to in-depth analytics, Zoho Tables Reports transform raw data into actionable visual insights. Instead of struggling with spreadsheets or searching for scattered updates, you now have a single platform to track, measure, and progress.
Because your decisions deserve more than guesswork.
Have questions? We're here to help. Contact our team at hello@zohotables.com to explore how you can use the Reports feature for your unique need.


Comments