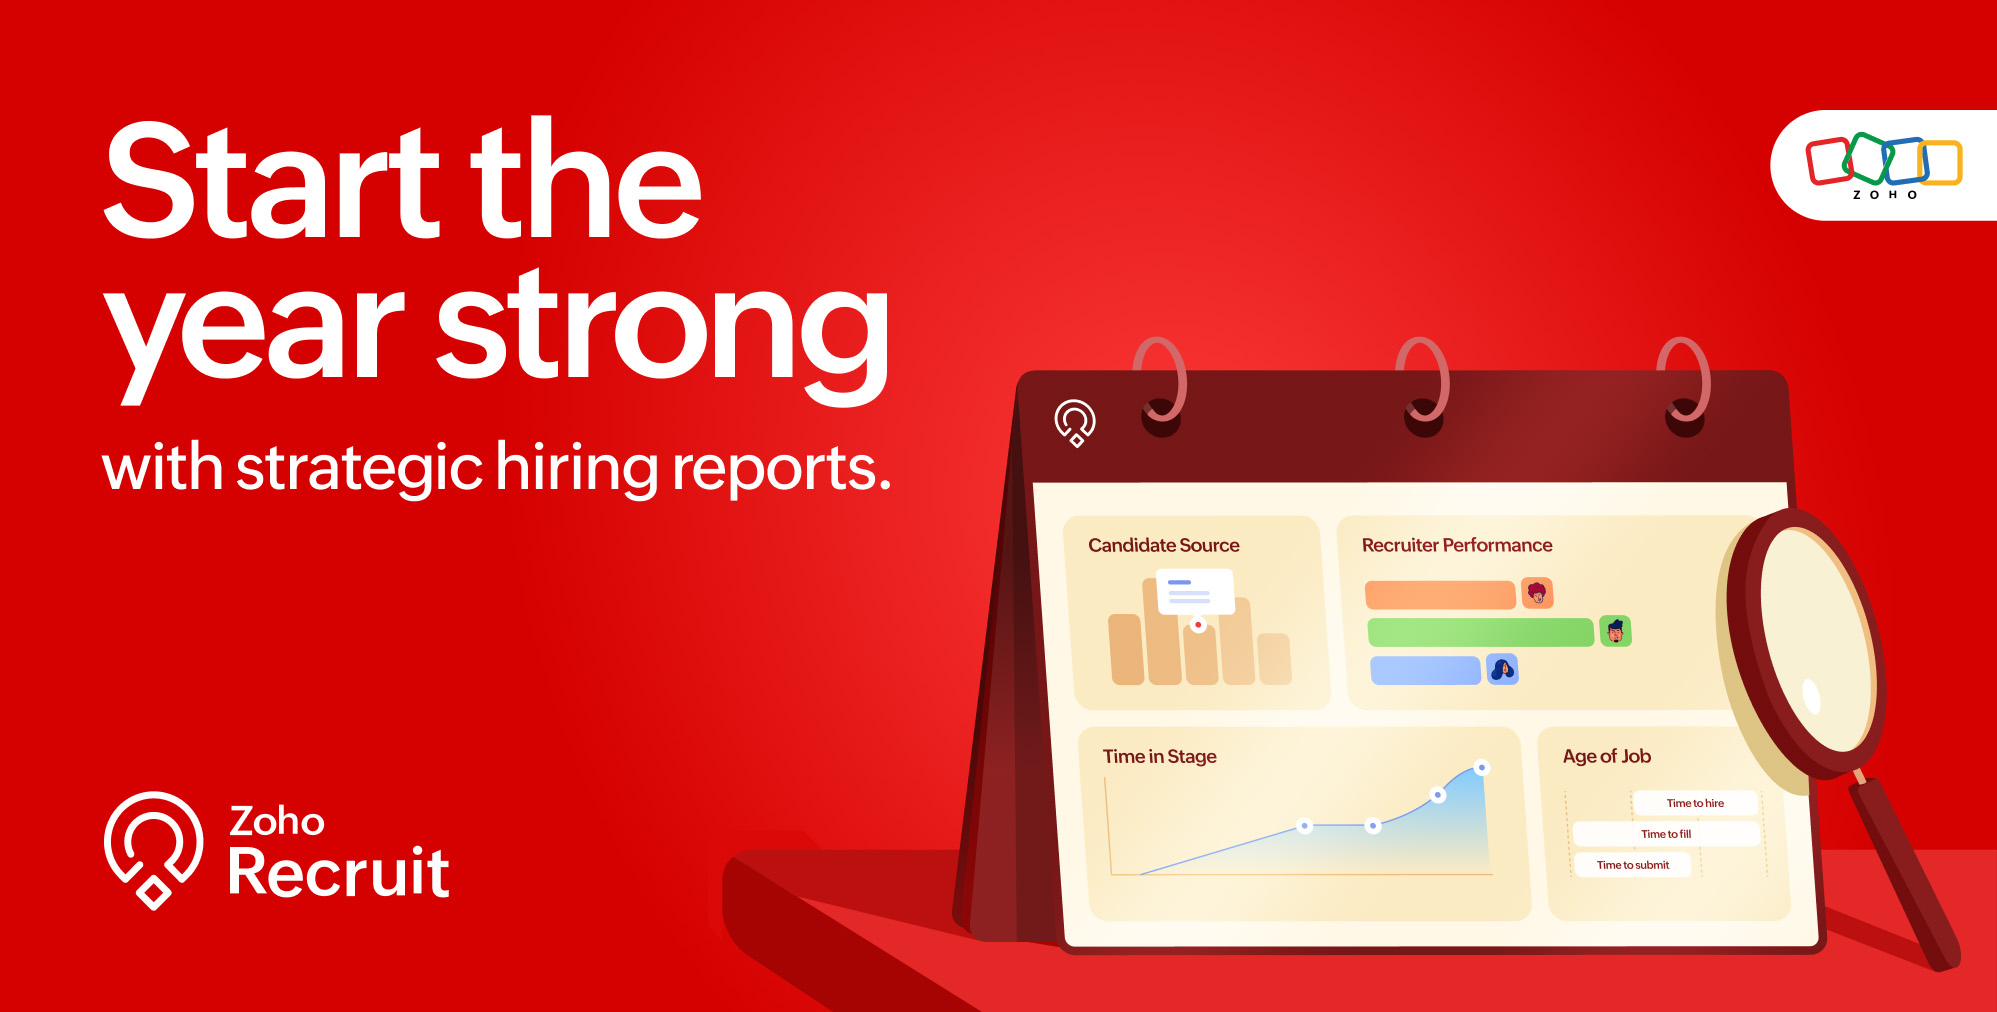
Numbers that help you hire better in 2026

You’re back from a long vacation, refreshed for the new year and ready to bring your hiring A-game. But once meetings pile up and tasks start coming in, everything begins to blur.
The fastest way to clarity? Recruitment reports and well-defined goals. They help you step back, analyze what actually happened last year, and move forward with intent.
Consider this your to-do list, designed to help you review the past year calmly and set smarter hiring goals for 2026.
Measure meaningful KPIs
To understand how your hiring performed across the year, you need visibility. That visibility comes from reports and analytics.
Recruitment reports help you identify what worked, what didn’t, and where your hiring efforts fell short. More importantly, they highlight the KPIs that should shape your next set of hiring goals.
Before jumping into numbers, get clarity on where you’ve been and where you want to go. Here’s how to structure your reports the right way:
1) Know what you want to measure
Start with the right hiring questions. Are you evaluating quality of hire, cost efficiency, recruiter workload, or burnout? Clear questions lead to focused reports and better decisions.
2) Avoid vanity metrics
Not every metric deserves your attention. For example, tracking the total number of applicants alone rarely tells you anything meaningful. Instead, measure how many qualified candidates you attracted for the role.
3) Combine metrics to interpret outcomes better
Some recruitment metrics don’t tell the full story when viewed in isolation. For example, time-to-fill and candidate retention should be analyzed together, as reducing time-to-fill by compromising on quality often leads to early attrition and drives up costs in the long run.
4) Use existing report templates in your ATS
You don’t need to start from scratch or play data analyst. Built-in report templates help you understand your recruitment process faster, while customizable reports let you tailor insights to your unique hiring workflows.
Actionable recruitment reports you can use
Here’s a comprehensive list of reports to understand how your recruitment performed in 2025.
- Hiring efficiency report
- Quality of hire report
- Candidate experience report
- Sourcing and job performance report
- Recruiter and team performance report
- AI and automation impact report
- Onboarding and retention report
- Client submission to placement report
An overview of practical recruitment reports, illustrated through a fictional recruitment scenario at Zylker.
Hiring efficiency report
The hiring efficiency report reflects the overall health of your hiring pipeline. It shows how quickly recruiters attract, filter, identify, and onboard quality candidates. From application to offer, it highlights where time is spent, where it’s wasted, and where momentum slows.
Why it matters
It helps identify candidate drop-offs, offer delays, and recruiter overload. This helps you cut unnecessary interview rounds and speed up communication.
Focus on
- Time-to-hire
(Percentage change in time-to-hire compared to last year overall and by role) - Time spent at each stage
(Which hiring stage takes the longest compared to others and why) - Candidate drop-offs by stage
(Number of candidates dropping out at each stage) - Interview-to-offer turnaround time
(Time taken to make an offer after an interview) - Offer approval time
(How long approvals took each quarter)
Quality of hire report
The quality of hire report evaluates how well your hiring decisions perform over time. It shows whether new hires perform well, stay longer, and truly fit the role and the team.
Why it matters
It helps you identify where early attrition occurs, so you balance hiring speed with quality candidates and avoid costly re-hires.
Focus on
- Hire success rate
(Percentage of hires who perform well after joining) - Roles reopened after hire
(Number of new hires needing replacement) - Early attrition rate
(Percentage of new hires leaving early) - Performance or probation outcomes
(Performance outcomes during probation) - Offer acceptance rate
(Offer acceptance rate compared to previous job openings or roles)
Candidate experience report
The candidate experience report captures how candidates experience your hiring process from the first interaction to the final decision. It highlights where candidates disengage, wait too long, or feel left in the dark.
Why it matters
Poor experiences lead to candidate drop-offs, declined offers, and long-term employer brand damage, especially in competitive markets. This report helps you maintain consistent communication across stages and shorten feedback cycles.
Focus on
- Response and feedback turnaround time
(Response time compared to your expected benchmark) - Interview scheduling delays
(How long the interview scheduling delayed across roles) - Offer acceptance vs. decline rate
(Percentage of offers accepted relative to declined) - Candidate feedback or satisfaction scores
(Trends in candidate feedback) - Engagement of passive candidates
(How many quality passive candidates stay interested and open to other roles)
Sourcing and job performance report
The sourcing and job performance report shows where your candidates come from and how well each job opening performs across channels. It helps you understand which sources bring in quality candidates and which roles struggle to attract the right talent.
Why it matters
More applications do not always mean better hiring outcomes. This report helps you invest in the right sourcing channels, refine job postings, and avoid wasting time on low-performing sources.
Focus on
- Source-to-hire ratio
(Number of applicants hired from each source) - Quality of candidates by source
(Number of quality candidates from each source) - Time to fill a role by source
(How many days a job stays open for each source) - Application-to-interview conversion rate
(How many applicants move to interviews from each source) - Cost per source
(Cost of each source vs. candidate quality)
Recruiter and team performance report
The recruiter and team performance report shows how hiring work is distributed across the team and how efficiently recruiters manage their workload. It helps you understand who is overloaded, where delays start, and how team performance affects hiring outcomes.
Why it matters
When recruiters are stretched too thin, hiring slows down, candidate experience suffers, and good candidates slip through. This report helps you balance workloads, set realistic expectations, and prevent burnout.
Focus on
- Roles handled per recruiter
(Number of open roles each recruiter manages) - Time spent per role
(How long recruiters spend filling each role) - Interview load per recruiter
(Number of interviews handled by each recruiter) - Response time to candidates and hiring managers
(How quickly recruiters respond to candidates and stakeholders) - Hires completed per recruiter
(Number of roles successfully closed by each recruiter)
AI and automation impact report
The AI and automation impact report shows how much manual work AI and automation have reduced across your hiring process. It helps you understand where time is saved, where AI adds value, and where manual effort still matters.
Why it matters
AI should reduce workload, not add to it. This report helps you identify where automation makes the most impact, frees up recruiter time, and supports decisions around further automation investments.
Focus on
- Tasks automated across hiring stages
(Number of hiring tasks completed automatically) - Time saved through automation
(Hours or days saved compared to manual work) - AI-assisted screening outcomes
(How many quality candidates AI helps screen) - Automation adoption rate
(How often do recruiters use available automation features) - Manual effort remaining
(Tasks still handled manually despite automation)
Onboarding and retention report
The onboarding and retention report tracks what happens after a candidate is hired. It shows how well new hires settle into their roles, how long they stay, and where early exits occur.
Why it matters
Hiring does not end with an accepted offer. Poor onboarding or early disengagement leads to attrition, rehiring costs, and lost productivity. This report helps you spot gaps early and improve long-term hiring success.
Focus on
- Offer acceptance rate
(Percentage of candidates who accept offers) - Early attrition rate
(Percentage of new hires leaving within the first few months) - Time to productivity
(How long new hires take to become fully productive) - Manager feedback on new hires
(How hiring managers rate new hires on skills, team fit, and company culture) - Retention after probation
(Percentage of hires staying beyond probation)
Client submissions to placement report (staffing-specific)
This report shows how quickly candidates move from being shared with clients to getting placed. It helps you see where candidates slow down, drop off, or get stuck waiting for client decisions.
Why it matters
In staffing, speed affects revenue. Slow feedback or delays can cost you placements and good candidates. This report helps you identify where momentum breaks and fix it early.
Focus on
- Candidates moving to interviews
(How many candidates shared with clients get shortlisted or interviewed) - Interviews turning into placements
(How many interviewed candidates actually get placed) - Time taken to close a placement
(How long it takes to place a candidate after sharing their profile) - Client response time
(Response time of clients after candidate submissions or interviews) - Placements closed by each recruiter
(How many successful placements each recruiter makes)
Turn data into hiring strategy
Recruitment success cannot be measured through a single report. It comes from stepping back and understanding the full hiring journey, from sourcing to retention, and seeing how each recruiter has contributed along the way.
When you review your data regularly, patterns start to appear and small issues can be fixed before they turn into bigger problems. Make this a monthly habit instead of a yearly exercise.
Measure what matters and use those insights to shape your hiring strategy for 2026. After all, recruiters bring in the people who turn good companies into great ones.


Comments