• 16K

    Customers

  • 3M

    Users

BI dashboard for Finance

Convert scattered financial data into unified dashboards, insightful reports,
and AI-powered forecasts. From small businesses to large enterprises, Zoho Analytics delivers the clarity
and control needed for sustainable growth.

Finance Overview Dashboard Coupon

How can finance industries benefit from BI tools?

For banks and financial institutions, it means tracking KPIs, reducing risks, and making faster decisions.

360° view into your business

Create Profit & Loss, Balance sheet, and Cash Flow statement for your business anytime. Analyze them real-time, take informed decisions, and stay in control of your financial health.

Financial Statement Dashboard Coupon

Cashflow Analysis

Get insights into key metrics like receivable-to-sales ratio, top suppliers, pending balances, and payment statuses by analyzing your invoices and finanical statements - all in one place.

Cashflow Analysis Dashboard

Ask questions, get insights

With Zia, our built-in AI assistant, all you need is to ask your questions. Zia uses NLP and machine learning to instantly deliver answers as reports based on your data.

Ask Zia AI Assistant Dashboard

Contextual alerts for financial metrics

Monitor financial KPIs and get notified of any anomalies in your financial data through contextual alerts. Set custom conditions and make faster, data-driven decision.

Contextual Alerts for Financial Metrics

Data blending

Bring in data from multiple sources to build cross functional reports. For example, you can merge financial data with CRM insights to create a performance report.

CRM Books Data Blending Dashboard

Features of BI software for Finance

Everything you need. Built-in.

Email, export and print reports

Export or print reports for offline access. Schedule your reports and dashboards to be emailed automatically to the given recipients.

Integrate with your preferred tools

Access a full fledged BI tool by automatically syncing your data from various financial tools such as Zoho Books, QuickBooks, Xero, and
more.

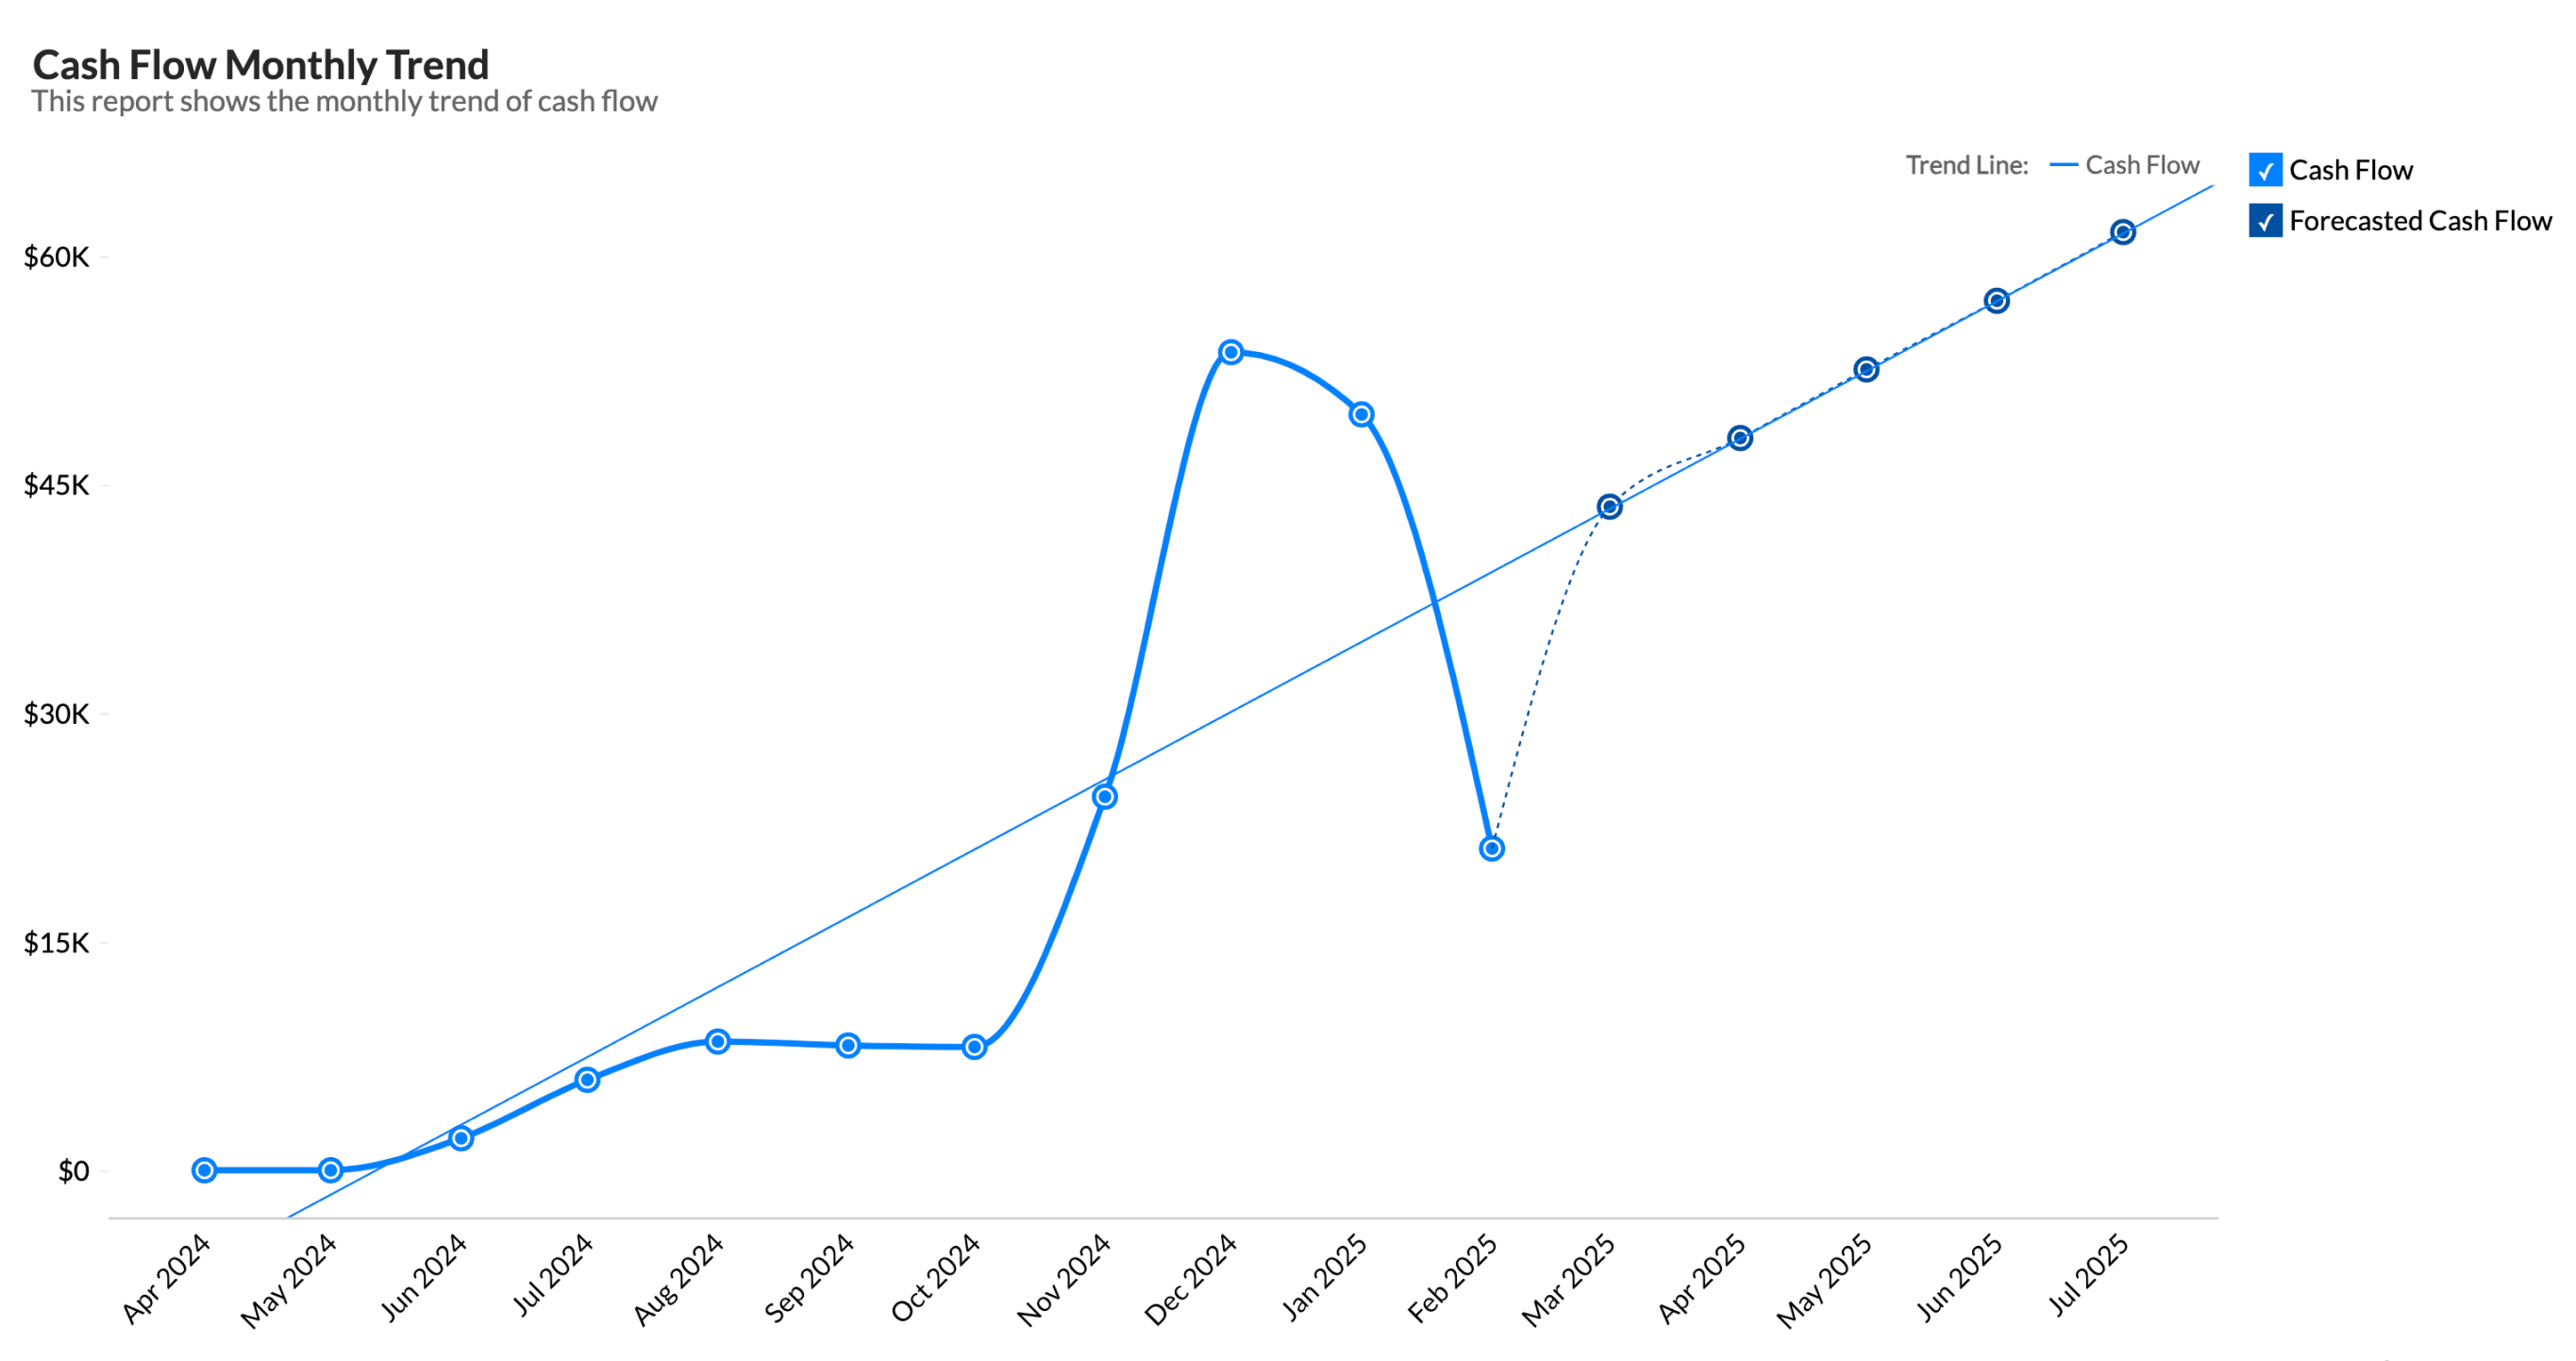
Forecast financial performance

Make informed decisions from your finance data and in turn manage your cash-flow, workforce and resources. Predict revenue, and plan for future growth.

Collaborate analytics

Develop & analyze reports together with your finance team. Share with each other privately. Embed your reports and dashboards for wider
consumption.

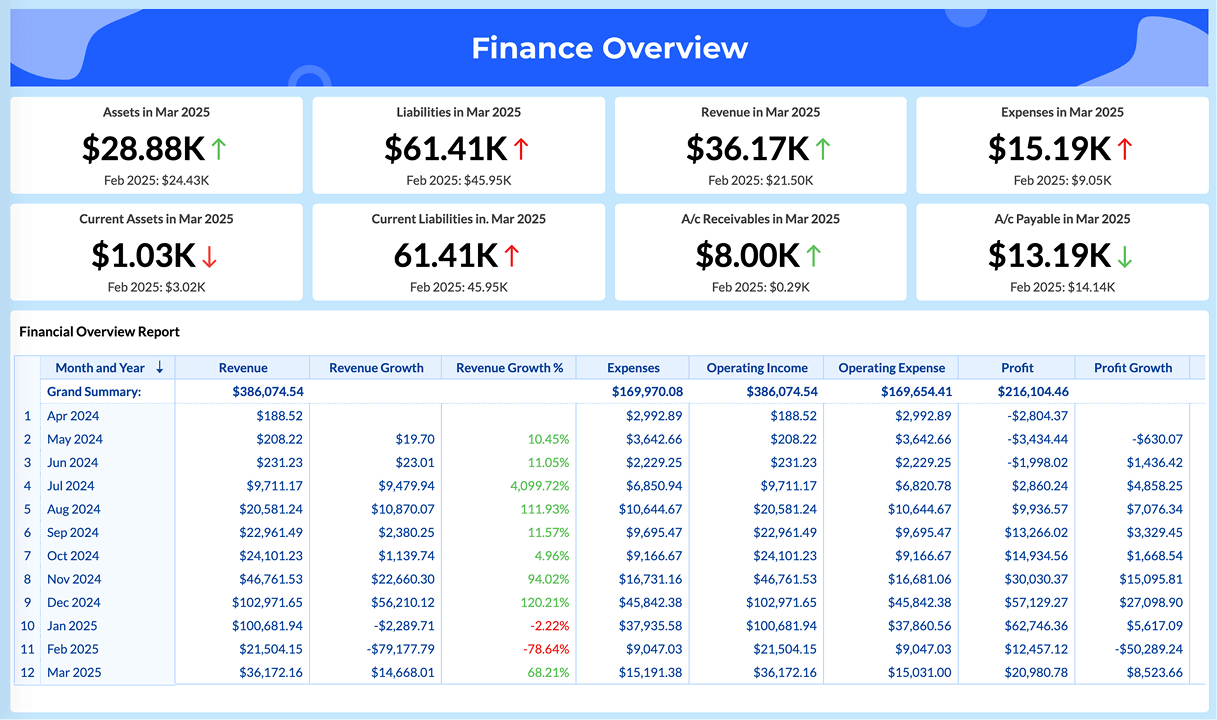
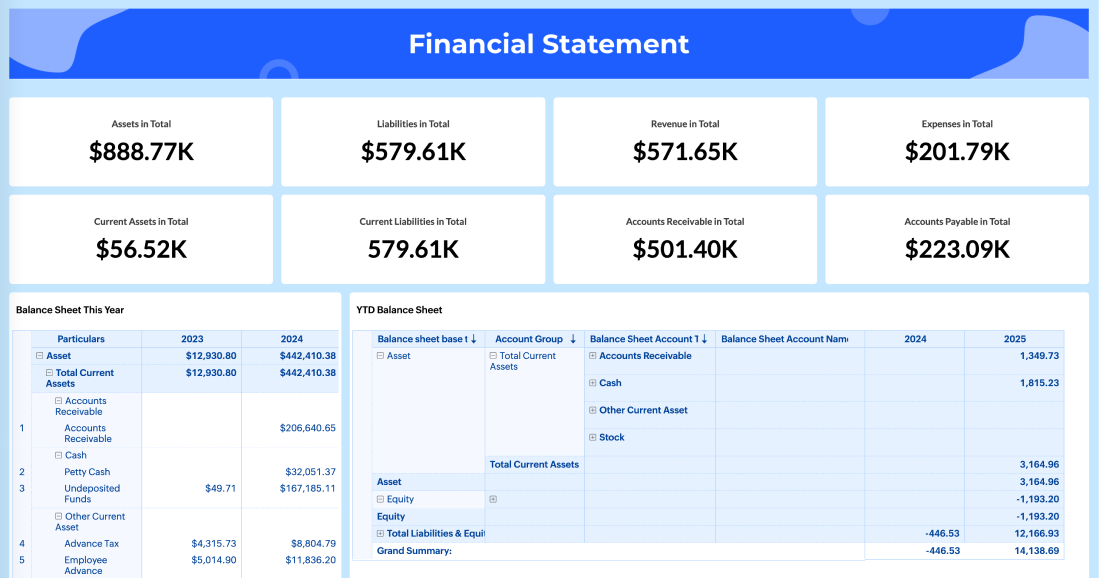
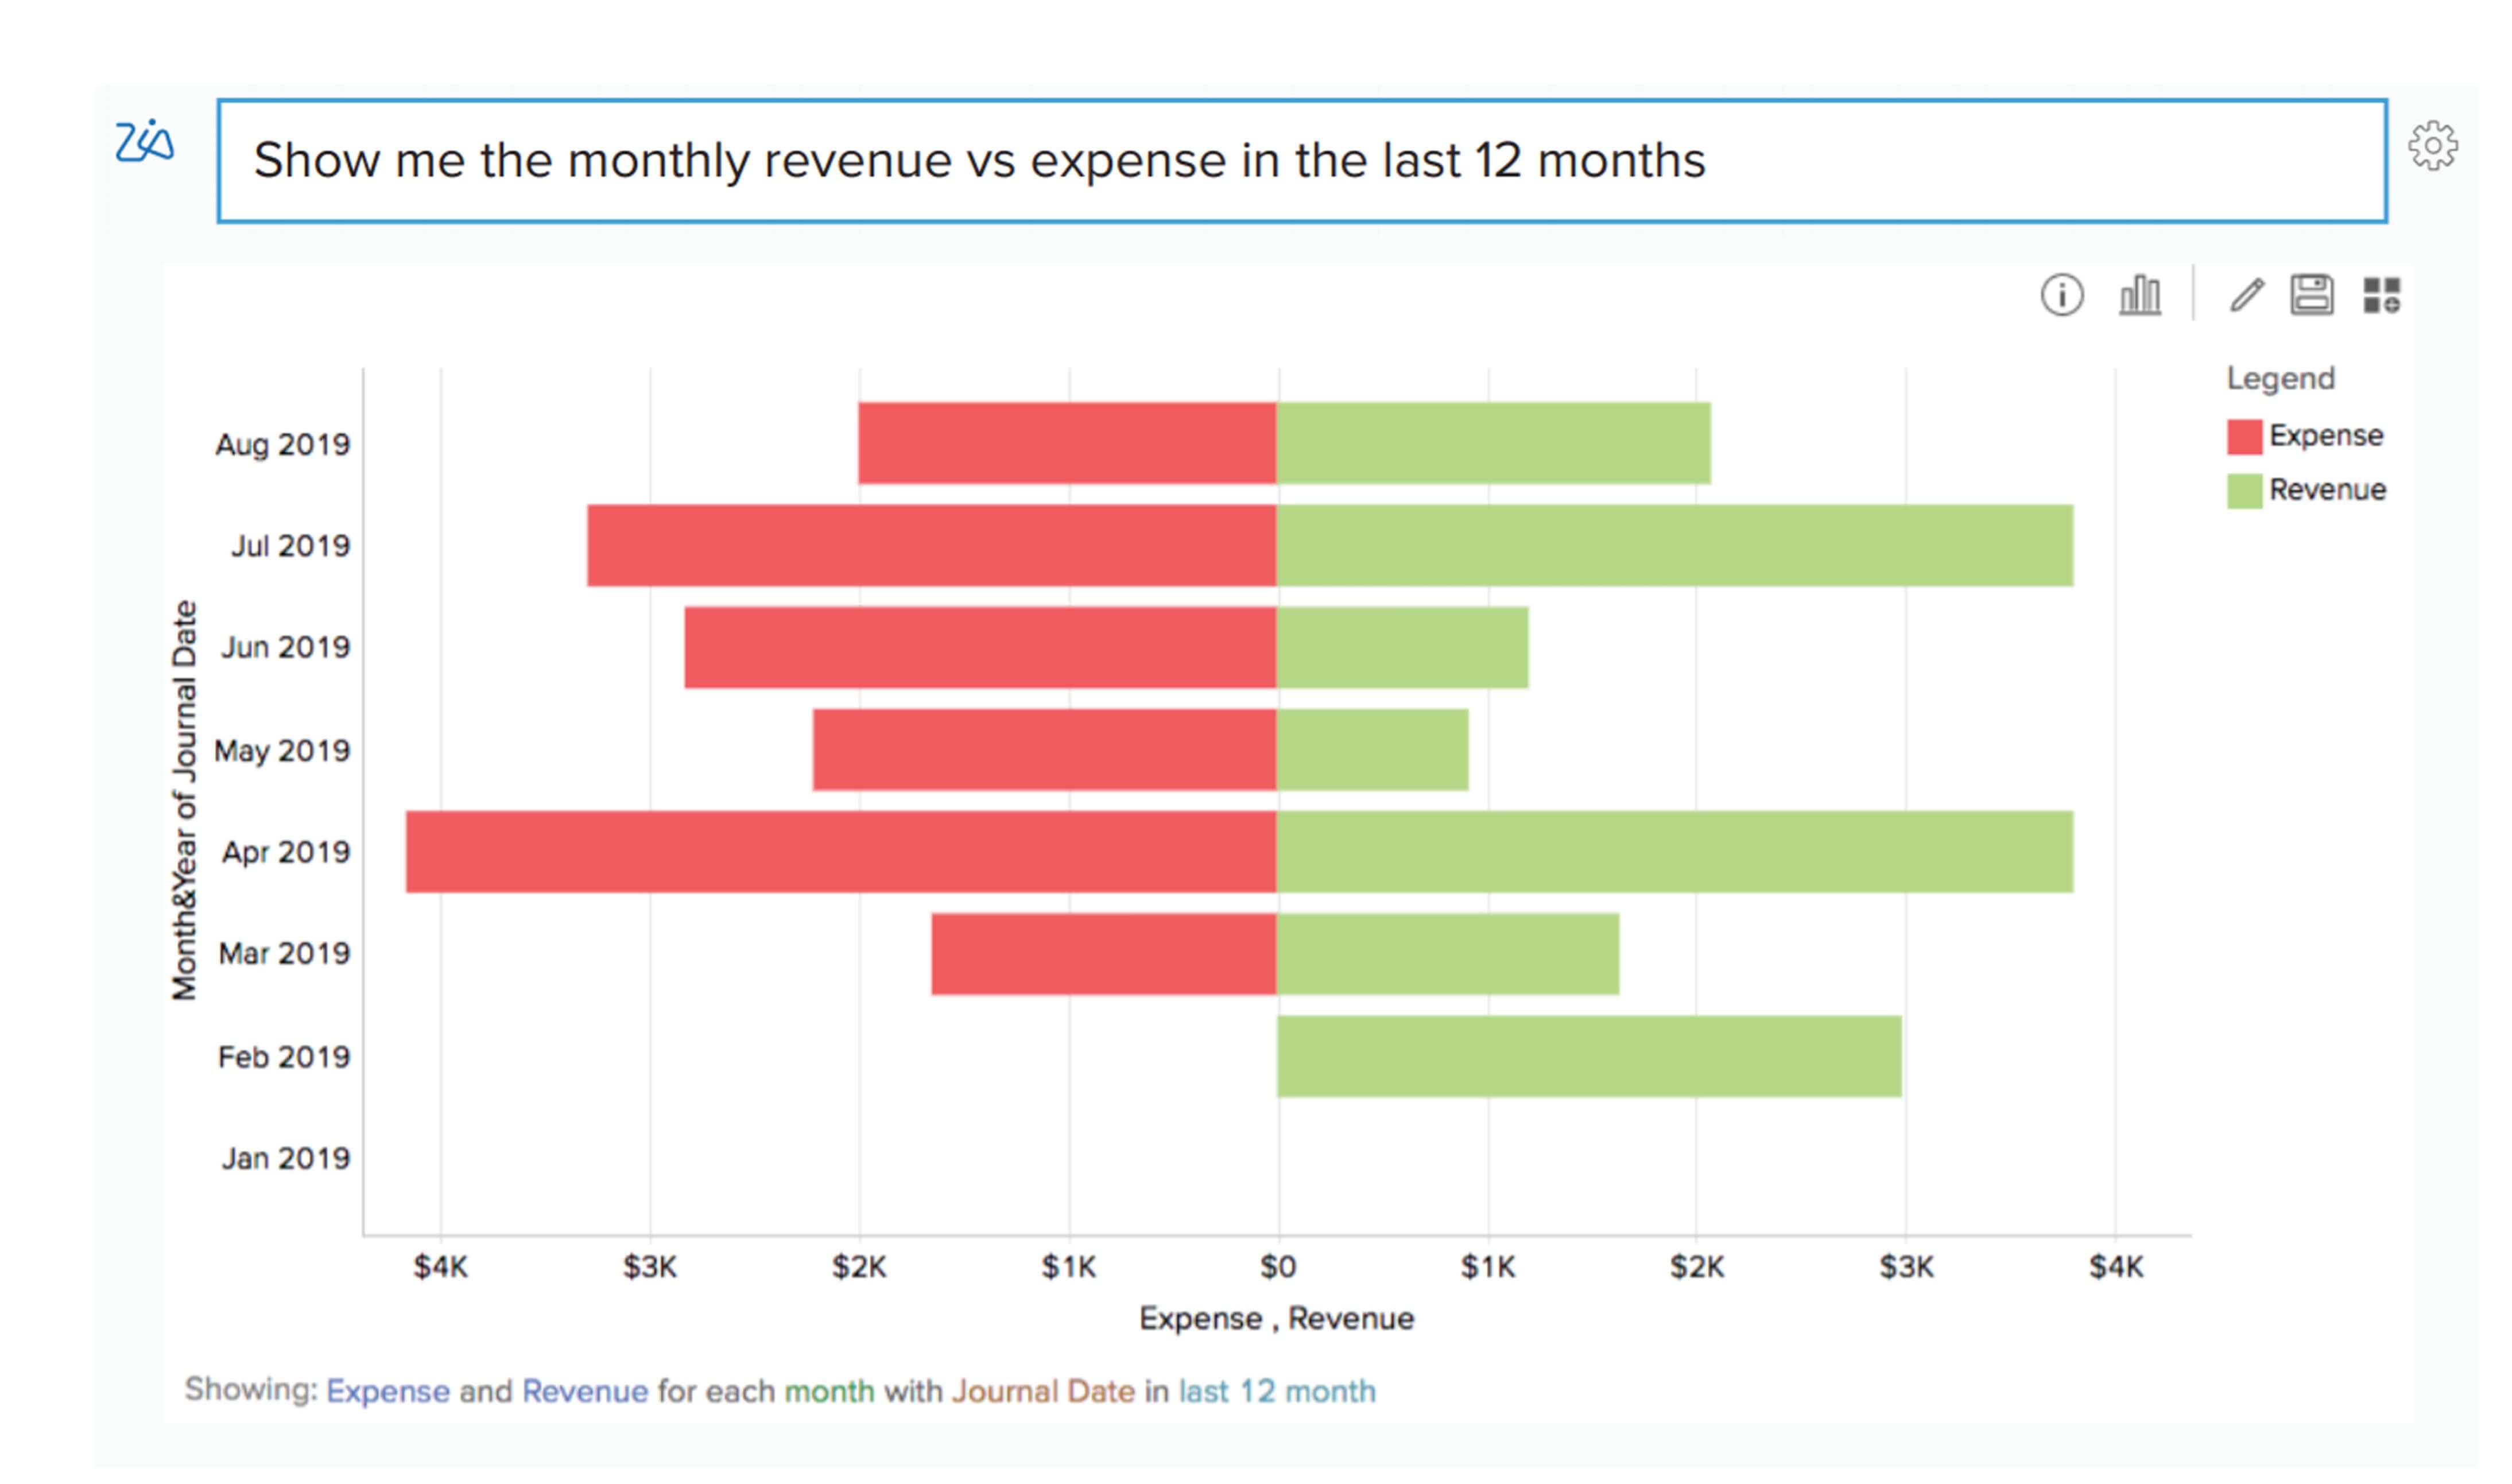
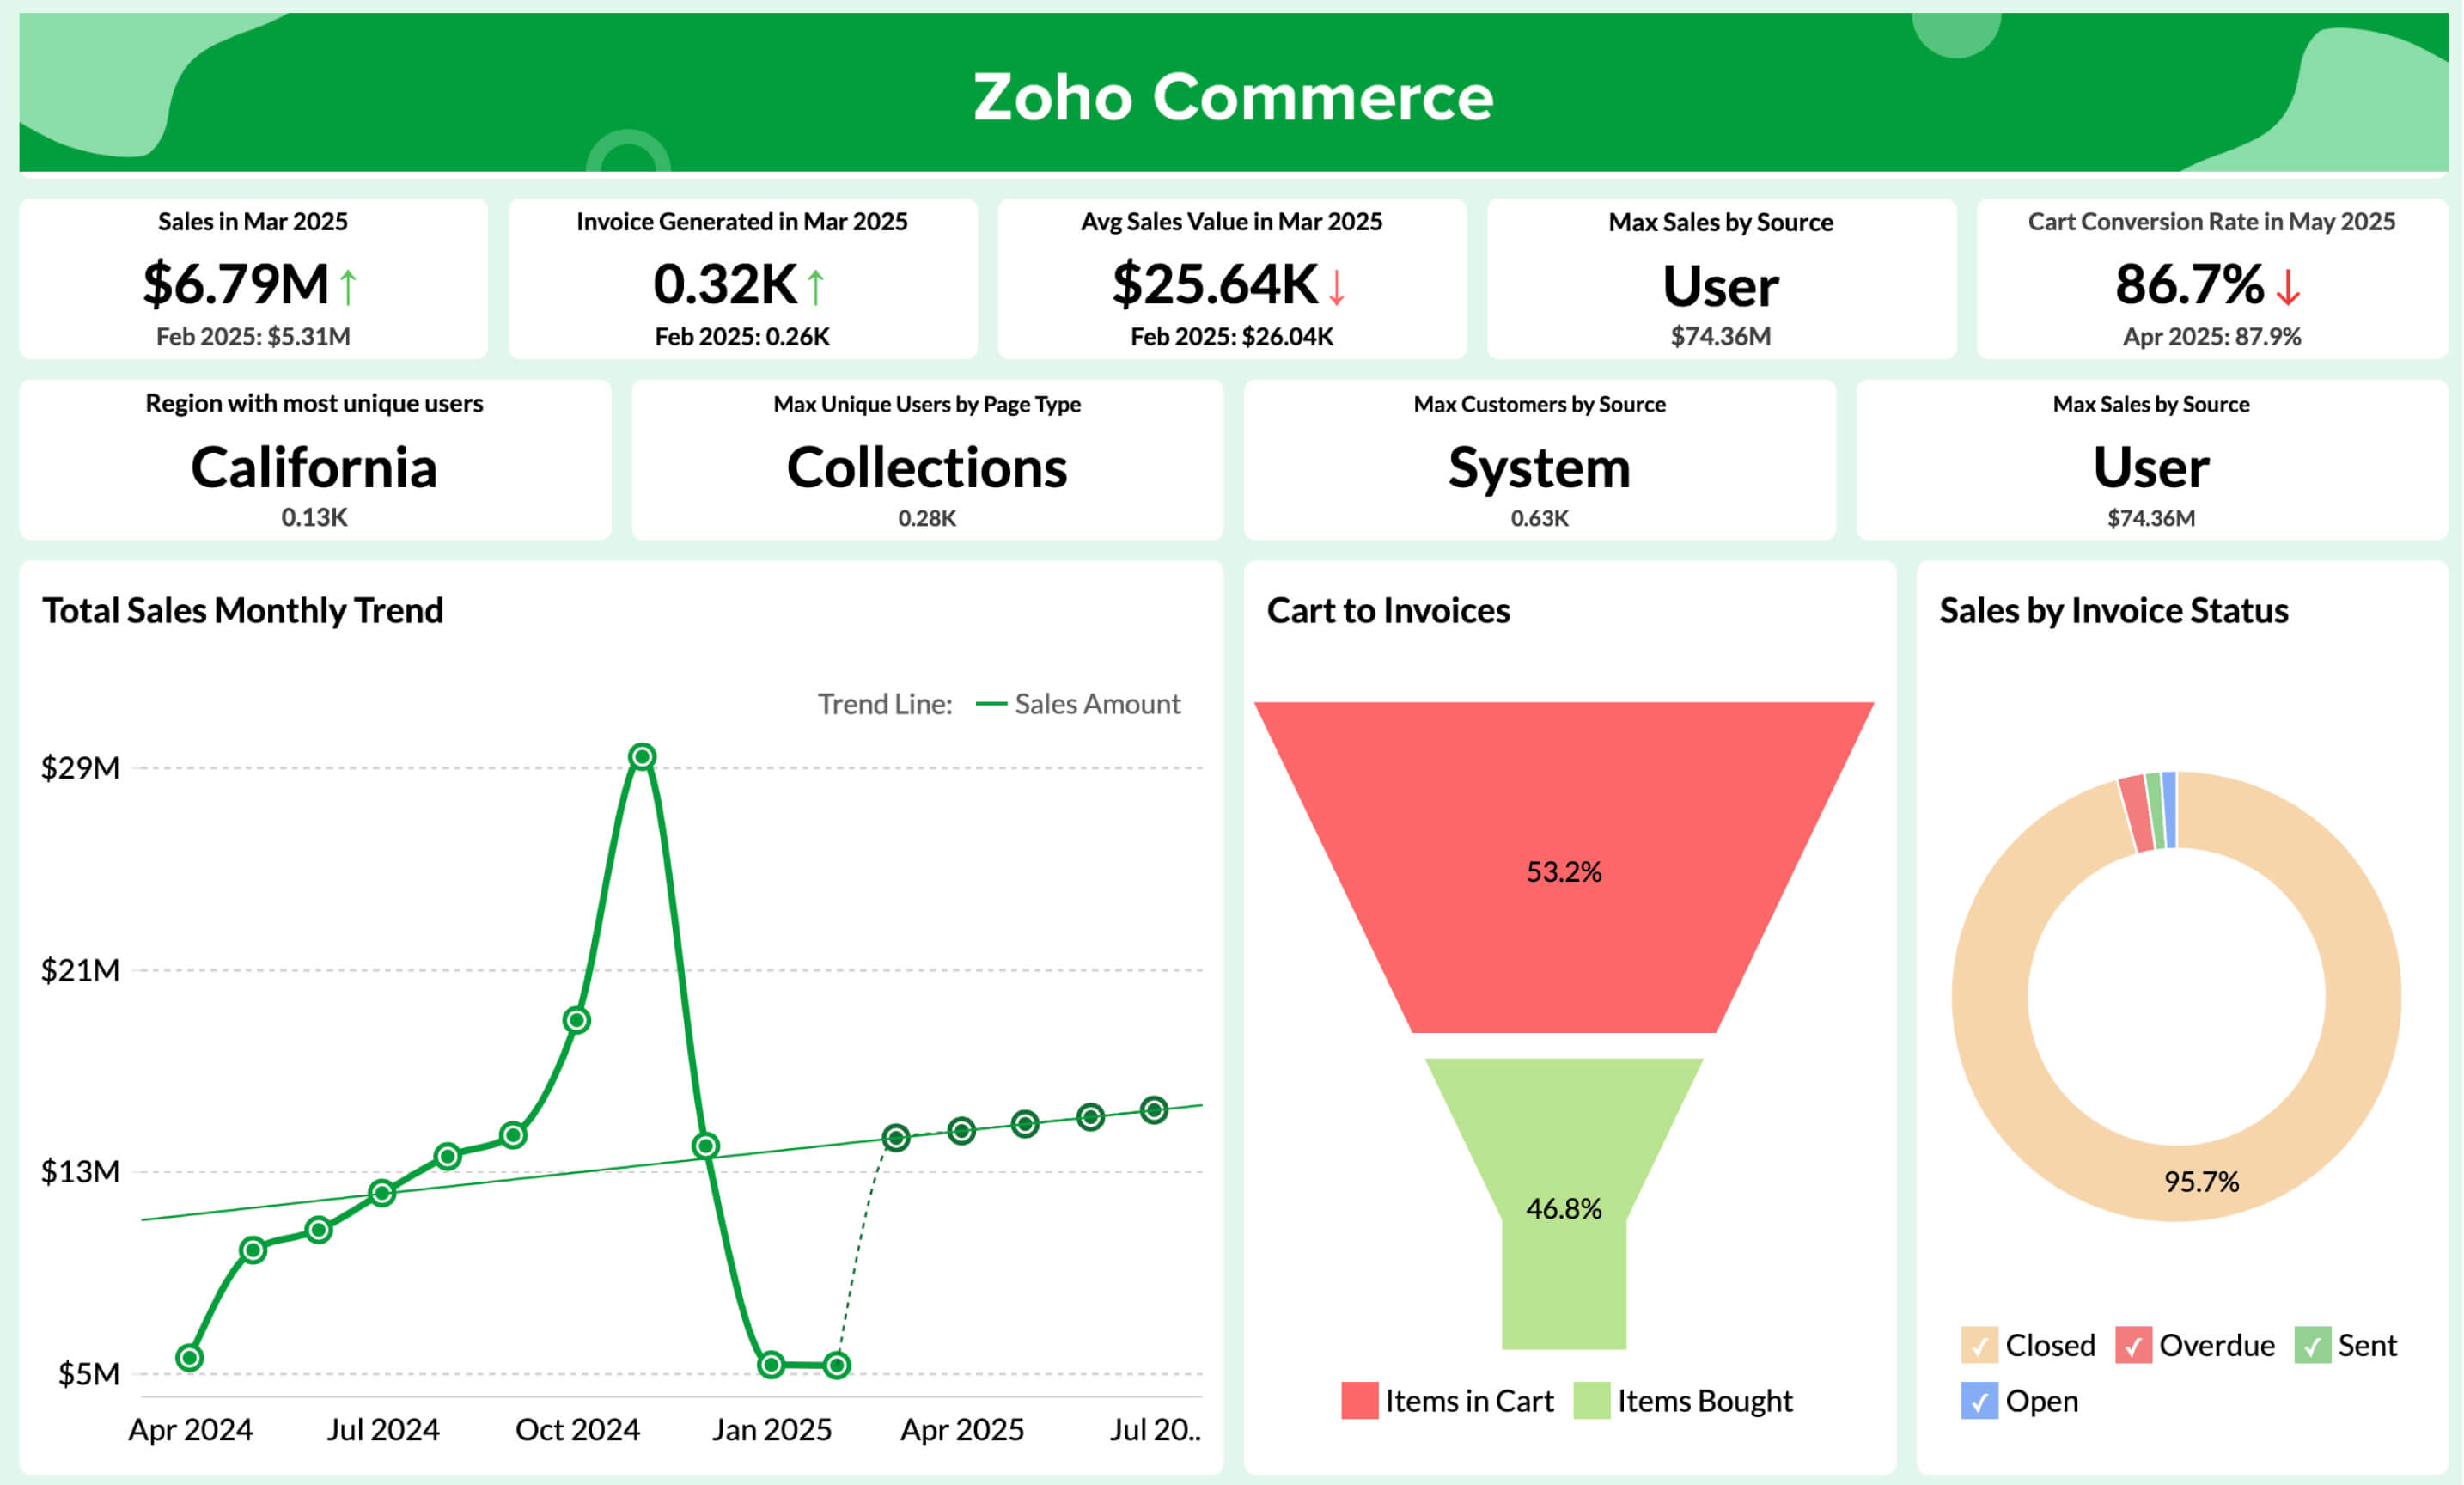
Pre-built Visualizations

Kick start your analytics journey with 75+ pre-built data visualizations or build your own with the drag-and-drop interface.

Embedded Analytics

Get a powerful BI, reporting, and analytics solution in your own brand name, embedded within your product/application or setup as a standalone
portal.

Ask. Analyze. Act - With Zia

Zia Circle Icons

Conversational analytics

Ask questions in plain English and get instant answers both visual and textual.

What-if analysis

Simulate complex business scenarios using what-if analysis

Smart data alerts

Set up smart data alerts and get notified instantly when something changes.

Predictive Analytics

Forecast future performance using historical data using AI forecasting models.

Anomaly Detection

Automatically detects anomalies and outliers in your data.

Auto-generated reports

Zia analyzes your data and builds relevant reports and dashboards in seconds.

Double quotes

Whenever I have a new client meeting, I demonstrate the Ask Zia feature of Zoho Analytics with a question like "what was my income last month?" Its quick reply or a visual fascinates my clients, and they say, 'This is what we want.

Craig Roxby, Managing Director, MagnifyCraig RoxbyManaging Director, Magnify

BI dashboards for banks and financial institutions

  • Purchase and Payables Dashboard

    Purchase and Payables

    Get an in-depth understanding of purchases, average purchase value, and billable expenses in a single view and make sure there are no overdue invoices.

  • Marketing ROI Dashboard

    Marketing ROI

    Analyze your marketing return on investment, campaign spends and revenue generated, and acquisition costs. Also, filter ads' ROI based on region and campaigns.

  • Inventory Sales and Orders Dashboard

    Inventory Sales and Orders

    Track the number of orders received, sales growth percentage, and the sales trend and invoiced amount for the month and identify whether they are improving or not.

  • Marketing ROI Dashboard

    Marketing ROI

    Analyze your marketing return on investment, campaign spends and revenue generated, and acquisition costs. Also, filter ads' ROI based on region and campaigns.

All Your Financial Data. Unified.

Connect seamlessly to your favourite apps.

Double quotes

Data visualization is important for any BI tool. It's great to present data in a way that is meaningful to the audience, helping them quickly grasp the content. That’s where Zoho Analytics is very strong. We now analyze our sales, operations, and finance using Zoho Analytics.

ED Levis, Head of IT, NYC NavigatorED LevisHead of IT, NYC Navigator

No more spreadsheets just smart, visual insights

Experience the smartest way to manage, analyse, and forecast your business finances with Zoho Analytics

Ready to Simplify Financial Reporting?

Frequently asked questions

Why does the financial industry really need Business Intelligence?

  • Because finance runs on data. BI helps financial institutions bring all that data together to uncover insights, reduce risks, stay compliant, and make faster, more confident decisions—whether it’s forecasting revenue or flagging suspicious activity.

How do credit unions use Business Intelligence?

  • Credit unions use BI to better understand their members, personalize services, and track the performance of loans, branches, and products. It helps them boost engagement, improve operational efficiency, and make data-driven decisions without guesswork.

What features should a financial BI tool have?

  • A good BI tool for finance should include real-time dashboards, predictive analytics, data blending from multiple systems, anomaly detection, strong security, and compliance-friendly reporting. Bonus if it’s easy to use and doesn’t require coding.

Can small and mid-sized financial businesses benefit from BI?

  • Definitely. Today’s BI tools are cloud-based, affordable, and easy to use—perfect for smaller financial teams. They help SMBs track cash flow, forecast trends, and gain the insights they need to grow and compete.

What are some AI-powered BI tools used in finance?

  • Some commonly used AI-powered BI tools in the finance industry are Zoho Analytics, Power BI, Tableau, Qlik, and Alteryx. These tools leverage AI to interpret an extensive financial data set, streamline analysis, and provide actionable insights instantly.

What are the different types of financial dashboards you can create with a BI tool?

  • With a BI tool like Zoho Analytics, you can build a variety of dashboards like cash flow tracking, revenue and expense trends, profit and loss monitoring, risk and compliance dashboards, portfolio performance, and even forecasting dashboards. You can also combine KPIs, charts, and widgets into a single view so you can the whole financial picture at a glance.

What role does AI play in financial business intelligence?

  • AI supercharges BI by doing beyond simple reporting. It can forecast revenue, detect unusual transactions, answer questions in plain English, and surface insights you might miss. It helps finance teams shift from reaction to proactive, predictive decision-making.