Creating a Dashboard
Dashboard allows you to combine multiple reports in a single page for a quick overview. Zoho Advanced Analytics provides a flexible m x n layout that allows you to organize the dashboard in any way as required. With this, you can easily create a visually rich and interactive dashboard by adding reports, widgets, user filters, and rich-formatted text.
The following is a sample Dashboard.
The following screenshot shows the same dashboard in Degisn Mode.
1 - Custom Title added in the Dashboard
2 - User Filters added in the Dashboard
3 - KPI widgets added in the Dashboard
4 - Reports added in the Dashboard
5 - List of available Reports to drag into the Dashboard
6 - Add Tab option to created Tabbed Dashboard
The above is a sample layout of a dashboard, which could be customized. Once you have created the reports/views that you want in Zoho Advanced Analytics, you can start designing your Dashboard. The following section describes how to create a Dashboard and layout it as needed.
Creating a Dashboard
Zoho Advanced Analytics offers easy-to-use flexible m x n layouts for the Dashboards. You can quickly drag and drop reports and more components to your dashboard. You can organize them in any way as required.
To create a Dashboard, follow the below steps:
- Click the Create button > New Dashboard option.
- The Edit Design window will open.

You can also create a new dashboard from the Dashboards button in the menu bar.
A shortcut link Create New Dashboards will be available inside the Dashboards button in the menu bar. You will be navigated to the Dashboards Editor by clicking the Create New Dashboards link.
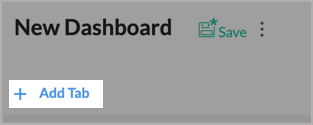
Adding Tabs
Zoho Advanced Analytics allows you to add multiple tabs to organize your reports. You can add up to 10 tabs in a dashboard. You can add tabs while creating a dashboard, or to an existing dashboard. Follow the below steps to add tabs to a dashboard.
- Open the Workspace.
- Click Create at the top left and then select the New Dashboard option.
- The Dashboard designer will open. Click Add Tab button.
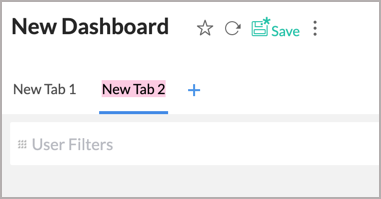
- The existing view will be assigned as New Tab 1 and a new tab will be created. You can further add tabs using the (+) icon. You can add up to 10 tabs in a dashboard.
- Click the Action icon that appears on the mouse over on the tab. Select Rename and provide name.
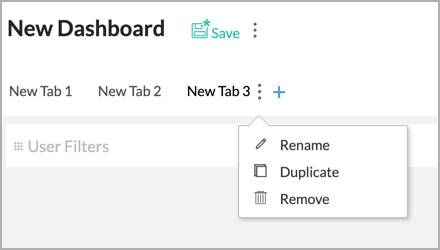
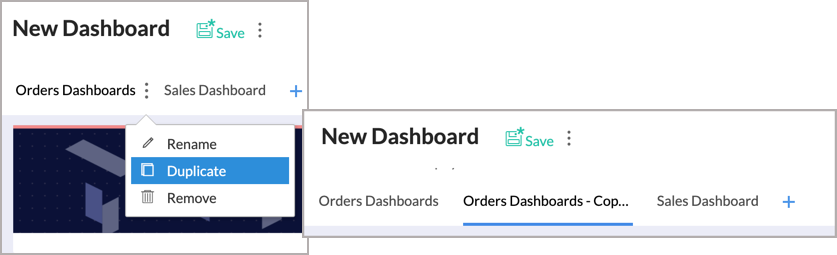
- Clicking the Duplicate option will copy the tab along with the embedded components into a new tab.
- Click the Remove option to delete a tab.


Adding Reports
Zoho Advanced Analytics allows you to add reports to your dashboard easily with a drag and drop interface.
Follow the steps below to add reports to your dashboard.
- Click Create > New Dashboard option from the menubar.
- You will notice that all the reports available in this Workspace listed in the left panel, which you can drop into the Design Area and resize them to fit your need.
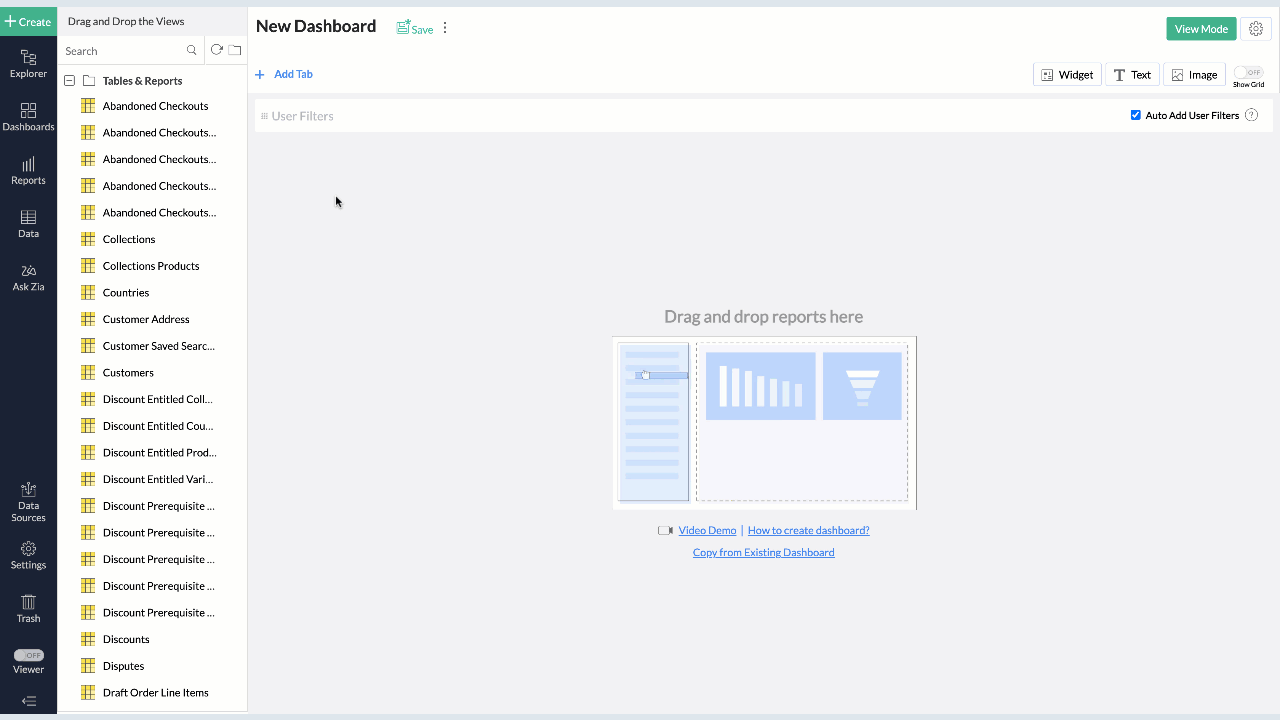

You can add any number of reports to the dashboard and organize them as needed.
Layouting components in Dashboards
Zoho Advanced Analytics provides a flexible m x n layout Dashboard. You can organize the dashboard in any way. You can simply drag and drop the components in edit mode of the dashboard.
Reorganizing Components
You can rearrange the components in a dashboard into any location needed by drag and drop. As you drag, other components will be automatically arranged. 
You can also reorganize multiple components together. Select components in the same row and/or column and drag them to the required location. The following animation explains how to re-organize multiple components.

Resizing components
You can resize the components in the dashboard anytime using one of the following options.
Drag to Resize
You can easily resize the component by dragging the border.

You can also resize multiple components together. Select components the same row and/or column and drag them to resize.
The following animation explains how to resize multiple components together.

Copy and Paste Dimensions
Zoho Advanced Analytics allows you to apply a uniform dimension to multiple components using the Copy-Paste Dimension option.
You can select the component with the desired dimensions and click Copy Dimensions option in the contextual toolbar that appears at the bottom. Now select the components on which you want them to be applied and click Paste.
The following animation explains how to copy-paste dimensions from one component to others.

You can choose to copy the width, or height or both.
Fit Components to Width
Fit components to width allows you to resize the components to fill available space with proportionate width.
Select components which are in the same row and same height and click Fit to Width option in the contextual toolbar that appears. The components will be resized with proportionate width to fit in the available space. The following animation explains how to resize to fit components to width.

Fill Space
You can resize the components to fill the space in the dashboard layout in few clicks. The following animation explains how to resize to fill the space.

Remove Components
You can easily remove the components from dashboards anytime.
To remove a component, click the action menu of the component and click Remove.

To remove multiple components together, select the components you want to remove and click the Remove icon in the Dashboard contextual toolbar.

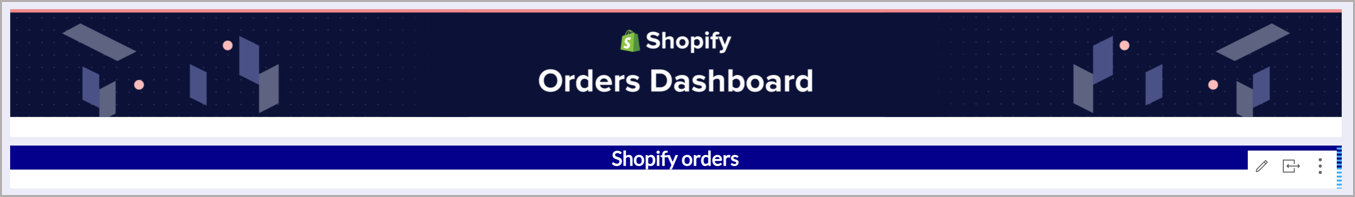
Customizing Dashboard
Zoho Advanced Analytics provides context-specific customizing options for all view that you dropped in a dashboard. You can also apply themes to improve the look and feel of your dashboard. To know more details on this, refer to the Customising Dashboard section.
The below is a final Dashboard with customised theme.
Adding Formatted Text, Images & HTML
Zoho Advanced Analytics allows you to enhance your dashboard by adding rich formatted text, images and HTML content to enrich your dashboard with relevant contextual information and styling.
To add text:
- Click Add Text option from the toolbar or double-click on any point in the Design Area.
- Enter the content in the Text Editor that opens.

- You can insert an image by clicking image icon.
- You can insert content using HTML editor. Will be useful to insert any Web components like Youtube video etc.,.
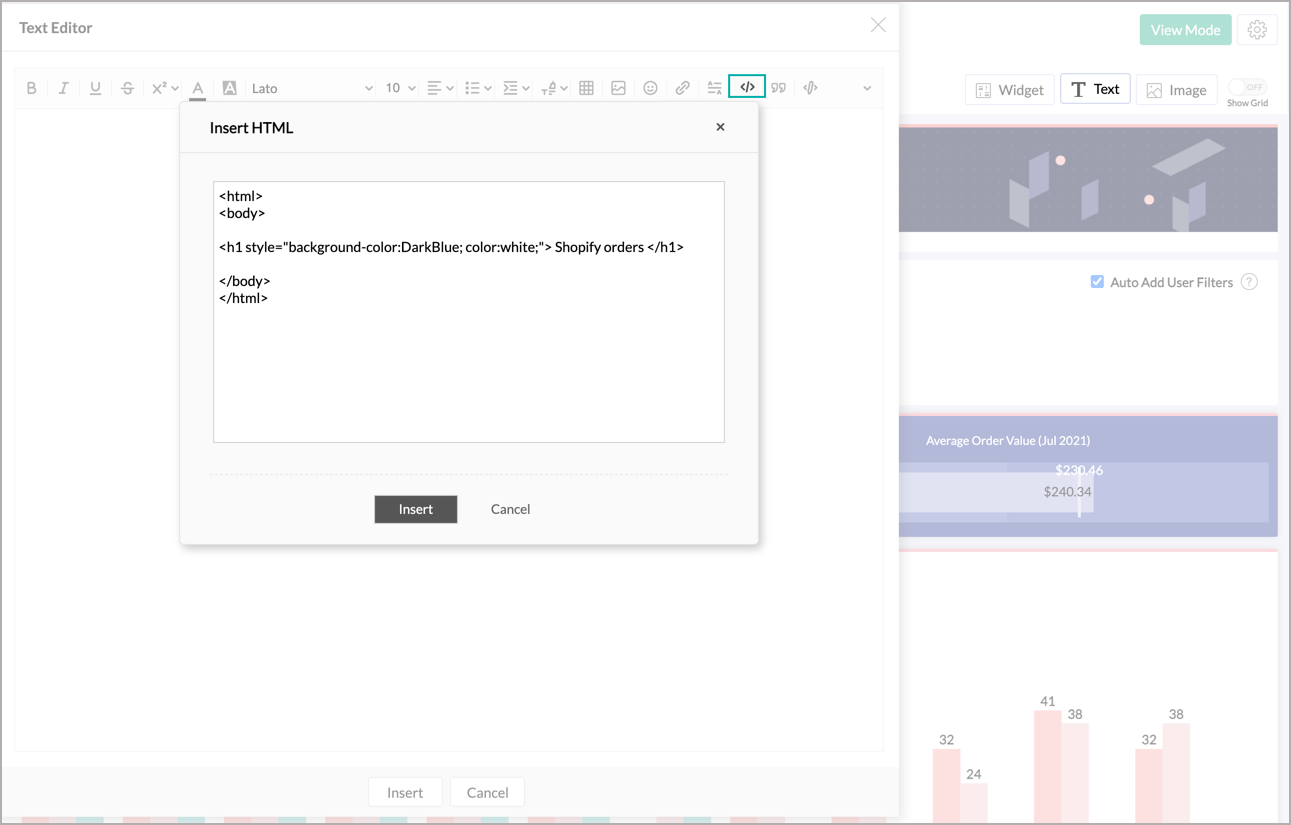
- Click Insert button. The content you have added will be inserted.


Zoho Advanced Analytics allows you to organize the added text as needed at any time. To know how to layout your dashboard, refer here.
Adding KPI Widgets
Zoho Advanced Analytics offers a widget-based model for adding single number and chart type widgets within dashboards. These are called KPI Widgets. This is a pretty useful feature to highlight any key metric in a dashboard for easy comprehension. The key metric can also be accompanied with associated comparison indicators to highlight the trend or plotted against a target to show progression.
Zoho Advanced Analytics offers two types of widgets,
- Single number widget
- Chart type widget
Adding a Single number KPI Widget
Adding a Chart Type KPI Widget
Click here to read a detailed help document about adding a KPI Widget.
Adding User Filters
Zoho Advanced Analytics allows you to include dynamic filtering capability in the dashboard view mode using the User Filters option. This enables viewers of the dashboard to apply filters dynamically and view the required information. You can add User Filters to the entire dashboard or for the individual reports embedded as required.
The following sections explain how to add User Filters.
User Filters for the Dashboard
To add User Filters to the Dashboard:
- In the Edit Mode, the User Filters section will be available. Click Add User Filters button.
- All columns relevant to the reports added in the dashboard will be listed in the column panel at the left. Drag and drop the required columns to be used as user filters.
- Editing user filters column is similar to editing user filters for charts (or pivot table or summary view).


Auto Add User Filters
Zoho Advanced Analytics allows you to add user filters available in the embedded reports into the dashboard too. This is an easy & convenient way to add users filters to a dashboard, without the need to repeat the task of user filters creation again.
To achieve this:
- Select the Auto Add User Filters checkbox from the User Filters field.
- Add reports with user filters to the dashboard. User filters in these reports will be automatically added to the dashboard.
User Filters for the Individual Reports
You can also add user filters for individual reports that have been added in a dashboard.
To achieve this:
- Create a report (chart/pivot/summary view) with User Filters.
- Add this report to the dashboard.
- Hover your mouse over the added Report.
- Select the Show Report Specific User Filter checkbox from the Options. Click Apply.
User Filters will be added to the corresponding report alone.
Columns Not Related
Zoho Advanced Analytics will display an alert over a user filters column (refer to the image below), which is longer relevant to the dashboard i.e., All the reports that use this column is removed from the dashboard. You can easily remove these user filters by hovering your mouse over the corresponding column and select Remove. You cannot save the dashboard without removing these columns.

Adding Timeline Filters
Zoho Advanced Analytics allows you to create a common Date/Period user filters that can be applied to all reports in the dashboard. This user filter is different from the other filters (described above), as it is not tightly bound to any (date) column in a table.
With this timeline filter, you will be able to set up a common Date/Period user filter independent of the tables on which the reports have been created. When you use the timeline filter in a dashboard, Zoho Advanced Analytics will apply the criteria on all reports, matching it with the best possible date column associated with the report. By default, if the report has a date column, it will filter using it. The matching date columns can also be customized, refer to this section to know how.
Since this is a common period filter, you can set up only one timeline filter in a dashboard.
To add a timeline filter,
- Click Add User Filter button and select Include Timeline Filter checkbox (or drag and drop) as shown in the snapshot.

- Click the edit icon that appears on hovering the mouse on the timeline filter. In the Edit Timeline Filter dialog that opens, you can change the filter name in the Filter Display Name box.
- Click the Edit link to change the values that you wish to display in the Timeline filter.

- You can select the values by selecting the checkboxes.

- Click Apply to add the filter.


How does this filter work?
When you apply this filter, by default it will be applied only to those reports that have a date column as a part of it. The date columns can be customized using the Timeline filter column mapping section(as shown in the below snapshot).
- In the Date columns to use for filtering section, you can specify the date column to be filtered. You can specify multiple columns as well.
- You can also specify the order for applying filters in this section
- On date columns used in the report (default option)- choose this option to apply the timeline filter on the date column used in the report which is a part of the dashboard.
- On date columns in the table on which the report has been created - choose this option to apply the timeline filter on the reports present in the table on which the report is created, although the report does not contain a date column itself.
- On date columns in related tables - choose this to apply the timeline filter on the reports in the dashboard which does not contain a date column in its table but has a date column that is contained in a related table.
- Click Apply. This filter will be applied.
Merging User Filters
Zoho Advanced Analytics allows you to merge multiple user filters into a single a filter. This is pretty useful in cases when you have a dashboard with reports created over similar columns from different tables, but still wanted to have a single common user filter to apply over them.
You can merge user filters by simple drag and drop. 
You can add or remove the column from these filters anytime as shown below.
- You cannot remove the primary user filter column over which other User Filters are merged.
- Values from this primary column alone will be listed as filter values.
- You cannot merge two columns for the same table into the same User Filter.
- You cannot merge two columns with different data types in a User Filter.
- You can merge columns with similar data types in the same category. Such as Number, Decimal Number, and Positive number can be merged.
Reports as Filters
Zoho Advanced Analytics allows you to set reports to act as filters in your Dashboard. By doing so, you will be able to click on any data point and filter all other dependent views based on the value.
You can set reports to act as filters from the Dashboard Settings dialog. Select Enable Reports to Act as Filters to allow reports to act as filters. Click here to learn about more Dashboard Settings.

Now you can click on any data point and filter all other dependent views in the dashboard. Reports as Filters allows you to filter by the following filtering options:
- Filter including this value - The selected value will be filtered in the Dashboard.
- Filter excluding this value - The selected value will be excluded from the Dashboard.
