





- HOME
- Payroll metrics
- 9 payroll accounting metrics every India team should track each cycle
9 payroll accounting metrics every India team should track each cycle
Ask an HR manager at a 200-person company what their payroll costs. They will have the number. Ask them what their payroll error rate is. They will not.
This gap isn't unique to one company or one city. It's the default state of payroll operations at most Indian companies that haven't built an explicit measurement framework. Cost gets tracked because it shows up on the P&L. Accuracy, compliance timeliness, and process efficiency get tracked by nobody, until something goes wrong.
These are the 10 metrics that change that; each with a formula, an India-specific benchmark, the pain signal it catches, and the exact report in a payroll system that surfaces it. You can start tracking any of them this cycle.
The metrics that matter in Indian payroll
The 10 metrics fall into three layers. Use them to navigate to the layer most relevant to your role.
Layer 1 - Cost Metrics (Metrics 1, 2, 3): What payroll actually costs the company. The CFO layer. Most teams undercount gross payroll cost by 5% to 7%, because employer statutory contributions never appear on the payslip and rarely make it into the cost calculation either.
Layer 2 - Compliance Metrics (Metrics 4, 5): Whether statutory obligations are met correctly and on time. The risk layer. One missed TDS deadline costs 1.5% monthly interest. On a ₹5L TDS liability, that's ₹7,500 a month, appearing nowhere on any report unless someone's counting deposit dates.
Layer 3 - Process Efficiency Metrics (Metrics 6, 7, 8, 9): Whether the payroll process itself is working. The operational layer. Cycle time, error rate, off-cycle run count, and post-disbursement query rate: five numbers that tell you where your process is losing time and accuracy.
Metric 1 - Gross payroll cost
The CFO asks for your payroll accuracy numbers, and you discover you've been reporting the bank transfer amount, not the full company cost.
What it measures: The total cost of payroll to the company in a given cycle, including every employer-borne statutory contribution that never appears on an employee's payslip.
Formula
Gross payroll cost = Sum of (Basic + HRA + Allowances + Employer EPF + Employer ESI + Bonus + all other employer-borne components) across all employees
Two components most teams miss
Employer EPF contribution: 12% of each employee's basic salary, capped at Rs. 1,800 per month for the statutory mandatory portion (based on the Rs. 15,000 PF wage ceiling).
Employer ESI contribution: 3.25% of gross salary for every employee earning up to Rs. 21,000 per month.
Both are real costs to the company. Neither appears on the employee's payslip. Both are absent from most informal payroll cost calculations.
Confirm your covered employee count against ESIC applicability thresholds before applying the ESI component; coverage rules shift as headcount and wage bands change.
Benchmark: Gross payroll cost should match your CTC register within ±2% every cycle. A variance above that, without a documented headcount change or salary revision, is a calculation error, not a rounding difference.
Worked example
Component | Amount |
Monthly bank transfer (50 employees, avg CTC ₹8L/year) | ₹33.3L |
Employer EPF (₹1,800 x 50 employees) | ₹0.9L |
Employer ESI (3.25% applied to eligible gross) | ₹0.8L |
Actual gross payroll cost | ₹35.0L |
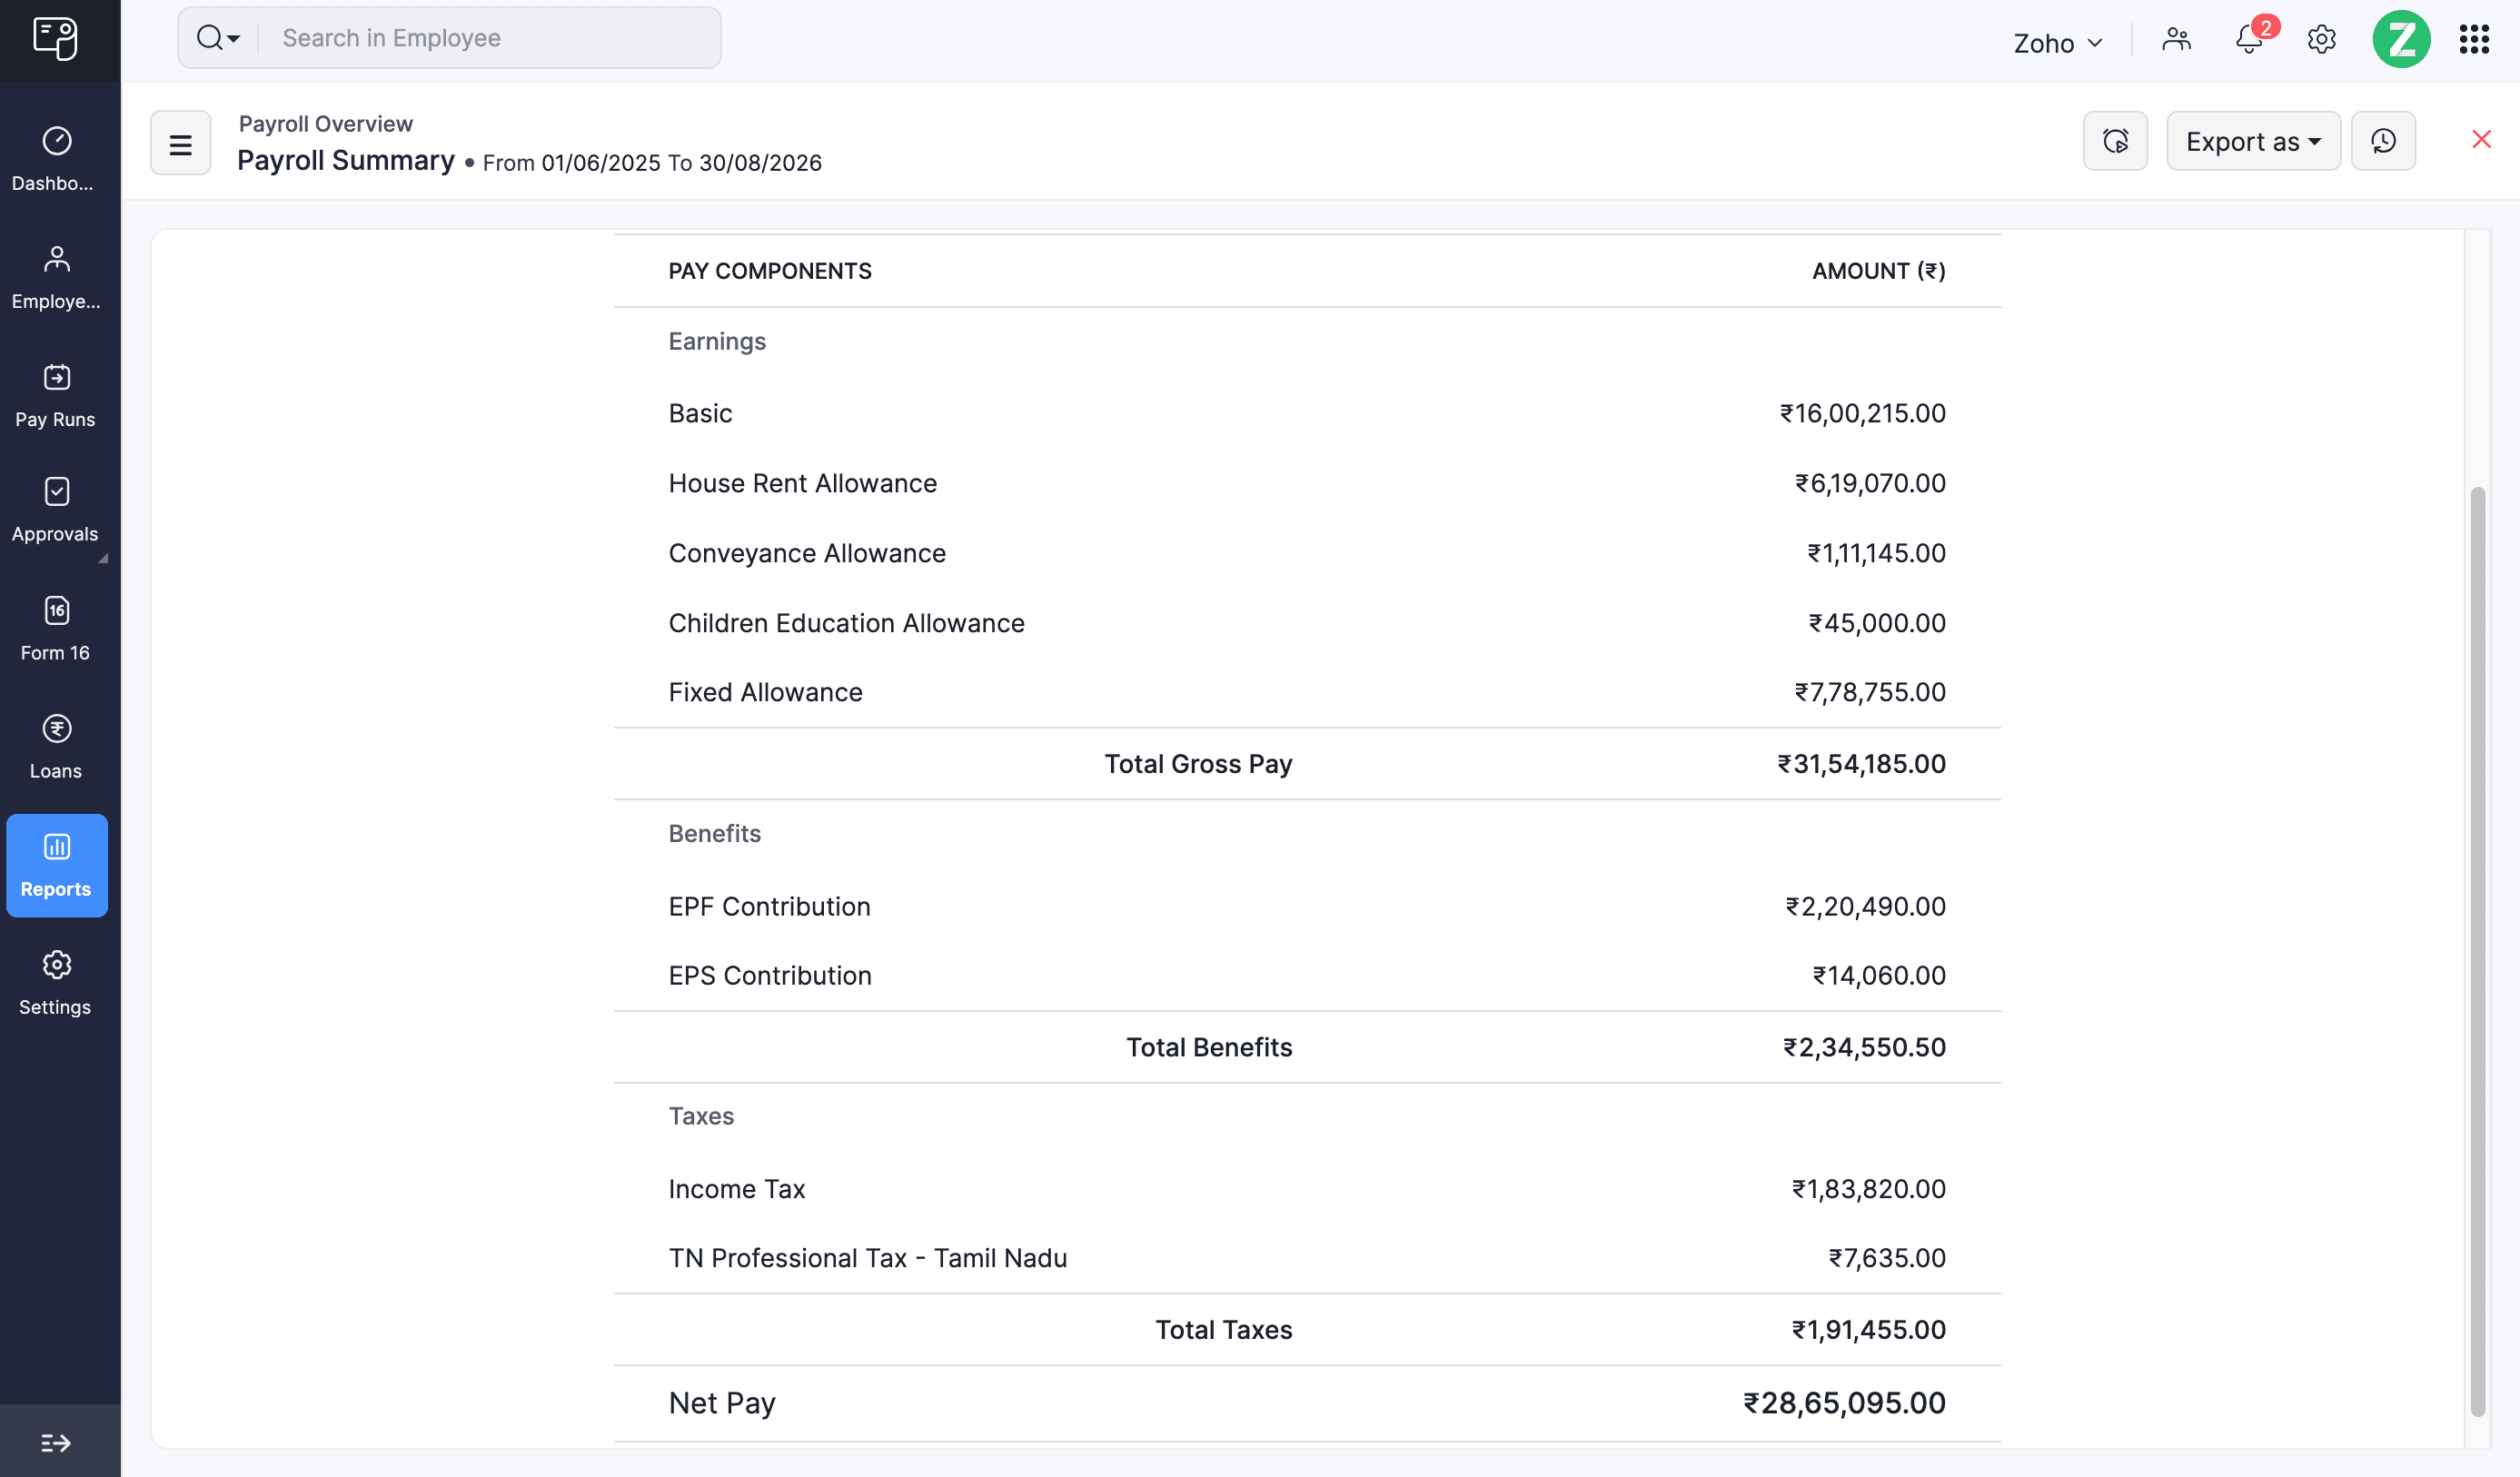
In Zoho Payroll: Zoho Payroll > Reports > Payroll Summary Report shows gross payroll cost per cycle broken down by component: basic, HRA, employer PF, employer ESI, all earnings. The component breakdown is the reconciliation against the CTC register. When this report matches the CTC register within 2%, the cost measurement is complete.
Metric 2 - Net payroll disbursed
What it measures: The actual amount transferred to employee bank accounts, and how much it changed from the previous cycle.
Formula: Net disbursed = Gross payroll cost - Employee deductions
Employee deductions = Employee EPF (12% of PF wages) + Employee ESI (0.75% of gross for eligible employees) + TDS on salary + LOP deduction + Advance recovery + all other employee-side deductions
Delta flag = (Net disbursed this cycle - Net disbursed last cycle) ÷ Net disbursed last cycle × 100
Delta flag rule: If net disbursed varies by more than 5% from the previous cycle without a documented headcount change or declared salary revision, review the variance before releasing the bank file.
Three causes of net salary volatility that are unique to the Indian payroll context:
Variable TDS: Changes when an employee switches tax regime, submits a revised investment declaration, or crosses a slab boundary mid-year.
LOP variations: Monthly attendance fluctuations, especially at companies with biometric clock-in and loss-of-pay policies.
One-off deductions: Advance recovery, salary revision arrear adjustments, reimbursement carry-forward reversals.
Each of these can shift the bank file by 3% to 8% without being an error. Each still needs documentation before the file goes out.
Benchmark: Net-to-gross ratio for a typical employee at Rs. 8L to 15L CTC sits between 72% and 80%. Below 70%: check for over-deduction. Above 85%: check for TDS under-deduction.
Worked example
| Gross payroll | ₹35 lakhs in both cycles |
| Net disbursed last cycle | ₹29 lakhs |
| Net disbursed this cycle | ₹27 lakhs |
| Unexplained delta | ₹2 lakh (6.9% - above the 5% flag threshold) |
On digging in, you find that three senior employees had switched to the old tax regime in January, which increased their monthly TDS by ₹15,000 to ₹25,000 each. It was completely legitimate and documented, but you wouldn’t have spotted it unless the delta flag was triggered.
Metric 3 - Cost of payroll per employee
Pain signal it catches: HR struggles to justify the value of payroll software because the current cost of running payroll per employee isn't clearly measured.
What it measures: The total monthly cost of running the payroll function, divided by headcount, giving you a clear view of payroll cost per employee.
Formula:
Cost of payroll per employee = (Monthly payroll software subscription + Payroll executive salaries apportioned to payroll hours + CA or consultant fees for statutory filing + Bank transaction charges for salary transfers) divided by Headcount
India-specific cost components most finance teams exclude
Bank transaction charges (NEFT or RTGS per salary credit, typically Rs. 5 to Rs. 15 per transaction).
CA or CS fees disaggregated from the general compliance retainer (the statutory filing component specifically).
The cost of off-cycle runs: each full and final settlement and off-cycle run consumes 4 to 8 hours of payroll executive time, which at fully-loaded executive cost translates to Rs. 3,000 to Rs. 7,500 per run, and rarely appears anywhere as a named line item.
Worked example (CFO-facing format):
Cost component | Monthly amount |
2 payroll executives at Rs. 6L CTC each; 70% time on payroll (₹35,000 x 2) | ₹70,000 |
Payroll software subscription | ₹15,000 |
CA filing fees (statutory filings) | ₹20,000 |
Bank charges (₹10 x 300 employees) | ₹3,000 |
Total monthly payroll cost | ₹1,08,000 |
Divided by 300 employees | ₹360 per employee per month |
This company is in the efficient band. A company running the same headcount on spreadsheets with higher manual hours and more off-cycle rework would likely land at Rs. 600 to Rs. 900 — the same work, at twice the unit cost.
In Zoho Payroll: CPE is not computed directly inside the system. It requires cost inputs the payroll system does not hold. Pull the software subscription from the invoice. Estimate executive hours from payroll run timestamps in Run History. Zoho Payroll removes the largest CPE variable — manual processing hours — by automating the payroll run itself, pushing the CPE floor toward the software subscription cost rather than executive time.
Metric 4 - TDS deducted per employee
Pain signal it catches: Wrong tax deduction regime applied for three months in a row, not caught until the employee found a Form 26AS mismatch at ITR filing time.
What it measures: The monthly TDS amount deducted from each employee, tracked as a change signal rather than a fixed target, because TDS is a prospective, recalculating figure that changes with income, declarations, and regime choices.
Formula:
TDS per employee per month = Estimated annual tax liability (per employee's regime, declarations, and YTD income) ÷ Remaining months in the financial year
Why remaining months, not 12: TDS computation recalculates every month based on actual income earned to date and actual declarations submitted.
India-specific critical window - January to March
TDS per employee is most volatile in Q4. Three things converge: final investment declaration revisions, tax regime switches (last chance for the financial year), and FY salary revision catchups in the March payroll. A single employee switching from the new regime to the old regime in January can change their monthly TDS by Rs. 3,000 to Rs. 15,000. Tracking TDS per employee catches this before the employee files their ITR and discovers a TDS mismatch in Form 26AS.
Benchmark: TDS per employee is not a stable target. Track it as a change signal. Flag any employee whose monthly TDS changes more than 20% without a corresponding declaration update in the system. This flag catches regime switches applied without documentation and salary revisions whose TDS impact was not recalculated.
Metric 5 - On-time statutory deposit rate
Pain signal it catches: A ₹3.2L late-TDS interest charge shows up on the P&L. The CA discovers TDS has been going out on the 8th or 9th for three months. Nobody was tracking deposit dates.
What it measures: The percentage of statutory payment obligations met on or before their statutory due date, tracked as a binary per obligation per month and as a rate across the year.
Formula:
On-time rate = (Statutory payments made on or before due date ÷ Total statutory payments due in the period) x 100
Target: 100%. No acceptable miss on any of the following.
India statutory deadlines
Obligation | Due date |
EPF challan payment | 15th of following month |
ESI challan payment | 15th of following month |
TDS payment | 7th of following month |
TDS payment for March | 30th April |
Form 24Q (Form 138) - Q1 (April to June) | 31st July |
Form 24Q (Form 138) - Q2 | 31st October |
Form 24Q (Form 138) - Q3 | 31st January |
Form 24Q (Form 138) - Q4 | 31st May |
EPF return (ECR) | 25th of following month |
ESI return - half-yearly | 11th April and 11th October |
Quick note: Verify all dates for FY 2025-26 against CBDT and EPFO notifications before building your tracking calendar.
Metric 6 - Payroll cycle time
Pain signal it catches: A 10-working-day payroll cycle that everyone has accepted as normal, where nobody knows which stage is consuming the time.
What it measures: The total elapsed working days from attendance data lock to salary bank credit, and the time consumed at each processing stage.
Formula:
Cycle time = Date of salary bank credit − Date of attendance data lock (in working days)
If cycle time is already within benchmark, decompose into stages:
Stage | What it covers |
Stage 1 | Attendance data collection to payroll input lock |
Stage 2 | LOP approval loop (manager approvals for absences) |
Stage 3 | Salary structure changes and revision inputs |
Stage 4 | Compliance verification (PF, ESI, TDS review) |
Stage 5 | Senior management or finance approval |
Stage 6 | Bank file generation and disbursement |
The time is almost always Stage 2 (the LOP approval loop waiting on managers who do not treat attendance confirmation as a payroll dependency) or Stage 3 (salary revision inputs arriving after the processing window has opened). Stage measurement finds the bottleneck within one cycle. For teams measuring cycle time after migrating from a spreadsheet to payroll software, the baseline cycle time often drops by 30 to 50% in the first three cycles as manual data-gathering steps are eliminated.
Metric 7 - Payroll error rate
What it measures: The percentage of payslips that required a post-disbursement correction in a given cycle.
Formula:
Error rate = (Payslips corrected post-disbursement ÷ Total employees paid) × 100
Track by error type, not just volume. The error type is where the systemic fix lives:
Wrong LOP deduction (attendance data error upstream)
Missed variable component (bonus or incentive not in the input)
Wrong TDS regime applied (declaration not updated before processing)
EPF calculation error (especially post salary structure restructure)
Reimbursement carried forward erroneously
Salary revision missed or double-applied
49% of employees begin looking for a new job after two consecutive payroll errors. Error rate is the leading indicator of attrition risk in the payroll function, not just an operational metric.
India-specific spike months: Error rate rises predictably in March and April (salary revision month), January (tax regime switch month), and the month following a large new hire batch. Track these months separately; a 4% rate in April is a different problem from a 4% rate in July.
Metric 8 - Off-cycle payroll run count
Pain signal it catches: Five off-cycle runs in one quarter. HR never thought of it as a metric before.
What it measures: The number of payroll runs beyond the scheduled main cycle in a given quarter, classified by type.
Formula:
Off-cycle run count = Total payroll runs in the quarter −
Scheduled main cycle runs (typically 3, for monthly payroll)
Classify every off-cycle run by type before counting:
Off-cycle type | Count against target? |
F&F settlement (exit payroll) | No - count separately; benchmark: 1 to 3 per month |
Missed salary | Yes, unacceptable |
Correction run | Yes, unacceptable |
Salary revision catchup | Yes, unacceptable |
Bonus omission | Yes, unacceptable |
Target: 0 to 1 non-F&F off-cycle runs per quarter. Above 3: the main cycle has a structural failure point. Identify it before the next cycle.
The cost of an off-cycle run: Each non-F&F off-cycle run consumes 4 to 8 hours of payroll executive time: data input, verification, approval loop, bank file generation, disbursement confirmation. Five non-F&F runs per quarter equals 20 to 40 hours of avoidable rework. At a payroll executive fully-loaded cost of Rs. 4,000 to Rs. 6,000 per working day: Rs. 10,000 to Rs. 30,000 per quarter in rework overhead that appears on no report unless someone counts the runs.
Metric 9 - Post-disbursement query rate
What it measures: The number of payroll-related queries received within 48 hours of salary credit, as a percentage of total employees paid.
Formula:
Query rate = (Payroll queries received within 48 hours of salary credit
÷ Total employees paid) × 100
India benchmarks:
Query rate | Interpretation |
Below 2% | Healthy - payslips are clear and accuracy is high |
2% to 5% | Investigate the dominant query type; one type usually accounts for the majority |
Above 5% | Payslip clarity or accuracy needs immediate attention |
Above 10% | Active employee trust problem; escalate to HR leadership |
India-specific query types worth separating
PF balance queries (most common among new joiners in their first 3 months)
Form 130/Form 16 and TDS queries (peak: April to June)
Tax regime switch queries (peak: January to March)
LOP disputes (employee disagrees with the attendance record)
Reimbursement status queries
Salary revision not yet reflected in the payslip
Why the query type matters more than the rate: a 6% query rate where 80% of queries are Form 16 questions in April and May is a seasonal communication problem. Send a proactive email with Form 16 access instructions and the rate drops next cycle. A 6% rate dominated by LOP disputes year-round is a systemic attendance data accuracy problem. Same query rate. Completely different fix.
The post-disbursement query rate is the one metric on this list employees produce for you, unprompted, every cycle. You've been collecting it for years without realizing it was data.
In Zoho Payroll: The Employee Self-Service Portal reduces query volume structurally; employees access their own payslips, TDS computation, PF balance, and leave records without contacting HR. Zia, Zoho Payroll's built-in AI assistant, goes a step further and answers from their own payroll data rather than routing the question to HR.
The way forward
Tracking 10 metrics every payroll cycle can quickly become another task on your team’s plate.
Zoho Payroll brings most of this into one place. The Payroll Summary helps you reconcile payroll costs against your CTC register, while the Payroll Liability Summary brings EPF, ESI, PT, and LWF dues together instead of making you track them across separate payment records. And with Zia handling common payslip and TDS questions, you can reduce the number of queries reaching HR instead of simply tracking them.
If you want to see these metrics without building and maintaining another spreadsheet, try Zoho Payroll for free. Set up your salary structure, run a test payroll, and start exploring the reports from your first payroll cycle.
