Logs
Table of Contents:
Introduction
Catalyst Logs display the logs of all Catalyst function executions. You can view the logs to check for errors in function executions, along with other necessary execution information of the execution. Logs enable you to access the records of all successful and failed function executions instantly after they are executed, including the functions that were executed internally. This helps you identify bugs in your code easily and resolve problem areas during the testing phase of your Catalyst application.
Catalyst offers native support for logging function executions of both Java and Node.js platforms. Logs display the execution history of all five types of Catalyst functions: Basic I/O, Advanced I/O, Event, Cron, and Integration functions.
You can manually push specific events or data to logs while writing a Catalyst function of any function type or for any platform. You can do this to push exceptions and errors that you anticipate in the function's execution. This is usually done by including a single statement in the function definition. You can also define the severity level of each error that is pushed to the logs.
Catalyst Logs are fundamentally of two types:
- Access Logs: These contain the log details of an external access layer of a function's execution. The functions that are usually invoked manually by the users are logged in this layer.
- Application Logs: These contain the log details of an internal application layer of a function's execution. These include the functions that are invoked manually by the users, or executed internally by the application.
Catalyst retains the logs of function executions for seven days in the Development environment, and fourteen days in the Production environment. You will be able to access the logs of all executions in these time periods in the Development and Production environments respectively.
Catalyst also provides you with the flexibility to create application alerts for logs directly from the Logs section in the console, instead of navigating to the Application Alerts component.
Pushing to Logs
You can push events and data to logs while writing a Catalyst function by including a statement in the function definition. This statement differs based on the function stack and the function type.
Catalyst enables you to write upto 1500 characters to the logs. You can therefore pass data in this range and include messages that require to be pushed.
You can also include the error level of a certain statement to indicate its severity. The log levels are only relevant to Application logs and are will not be displayed in Access logs. The log levels differ for Java and Node.js functions. Refer to the Application Logs section to view the different log levels supported by both platforms.
The methods to include in your function code to push the response data of each function stack and type are mentioned below:
Java Functions
You must include the following method in your function definition to push to logs for all function types:
LOGGER.log()You can include the log level for a Java function along with this statement. For example, to push a certain response obtained to the INFO level in a Java function, you can write:
LOGGER.log(Level.INFO, "Hello "+name);Refer to the Application Logs section to view the log levels supported by Java functions.
Node.js Functions
The Basic I/O functions support a different method to write data to Logs from the other function types in the Node.js platform.
You must include the following method in your function definition to push to logs in a Basic I/O function:
context.log()For example, to push a certain response obtained to logs, you can write:
context.log("Value : " + result);Similar to Java functions, you can include the log level supported by Node.js functions along with this statement. Refer to the Application Logs section to view the log levels supported by Node.js functions.
For functions of the other types (Advanced I/O, Cron, Event, and Integration functions), you must include the following method in your function definition to push to logs:
console.log()This is a native Node.js method to write to logs that is supported by Catalyst. The following example contains a push to logs statement of the ERROR log level in a catch block:
catch (err) {
		console.log(err);
		res.status(500).send({ message: 'Internal Server Error. Please try again after sometime.', error: err })
	}
Access Logs
As mentioned in the Introduction, Access logs include the log details of an external access layer of a function's execution.
Consider a gateway with two layers that need to be passed, to access and execute a Catalyst function. Access logs show relevant details of the function's invocation and execution pertaining to the external access layer in this gateway. These details include the User ID of the user invoking the function, the HTTP request method used to invoke the function, and more. The details of the response in this external layer are also shown in these logs, such as the response status, response time, etc.
The functions that can be manually invoked by a user are the ones that pass through this external access layer. This includes only Basic I/O, Advanced I/O, and Integration function executions in your application, as they can be invoked manually by the users. Integration functions are not invoked through a Function URL like Basic or Advanced I/O functions, but they are still accessed through external means by the users that call upon the integration service. Therefore, these function types are included in Access logs.
Event and Cron functions cannot be accessed through an endpoint and do not pass through this layer. They directly pass through the Application layer. Therefore, Event and Cron function executions will not be included in the Access logs. They will only be included in the Application logs.
To open the logs for your Catalyst project, navigate to the Host and Manage section in the Catalyst console, then click Logs.

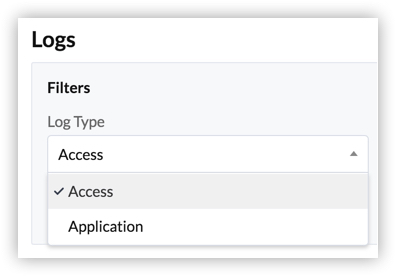
Note: You can either view Access logs or Application logs. You will not be able to view the combined results of both log types. You must select the log type from the dropdown in the Filters section.
Access Log Filters
The Access logs and Application logs contain different sets of filters that you can use to filter the log data that are displayed.
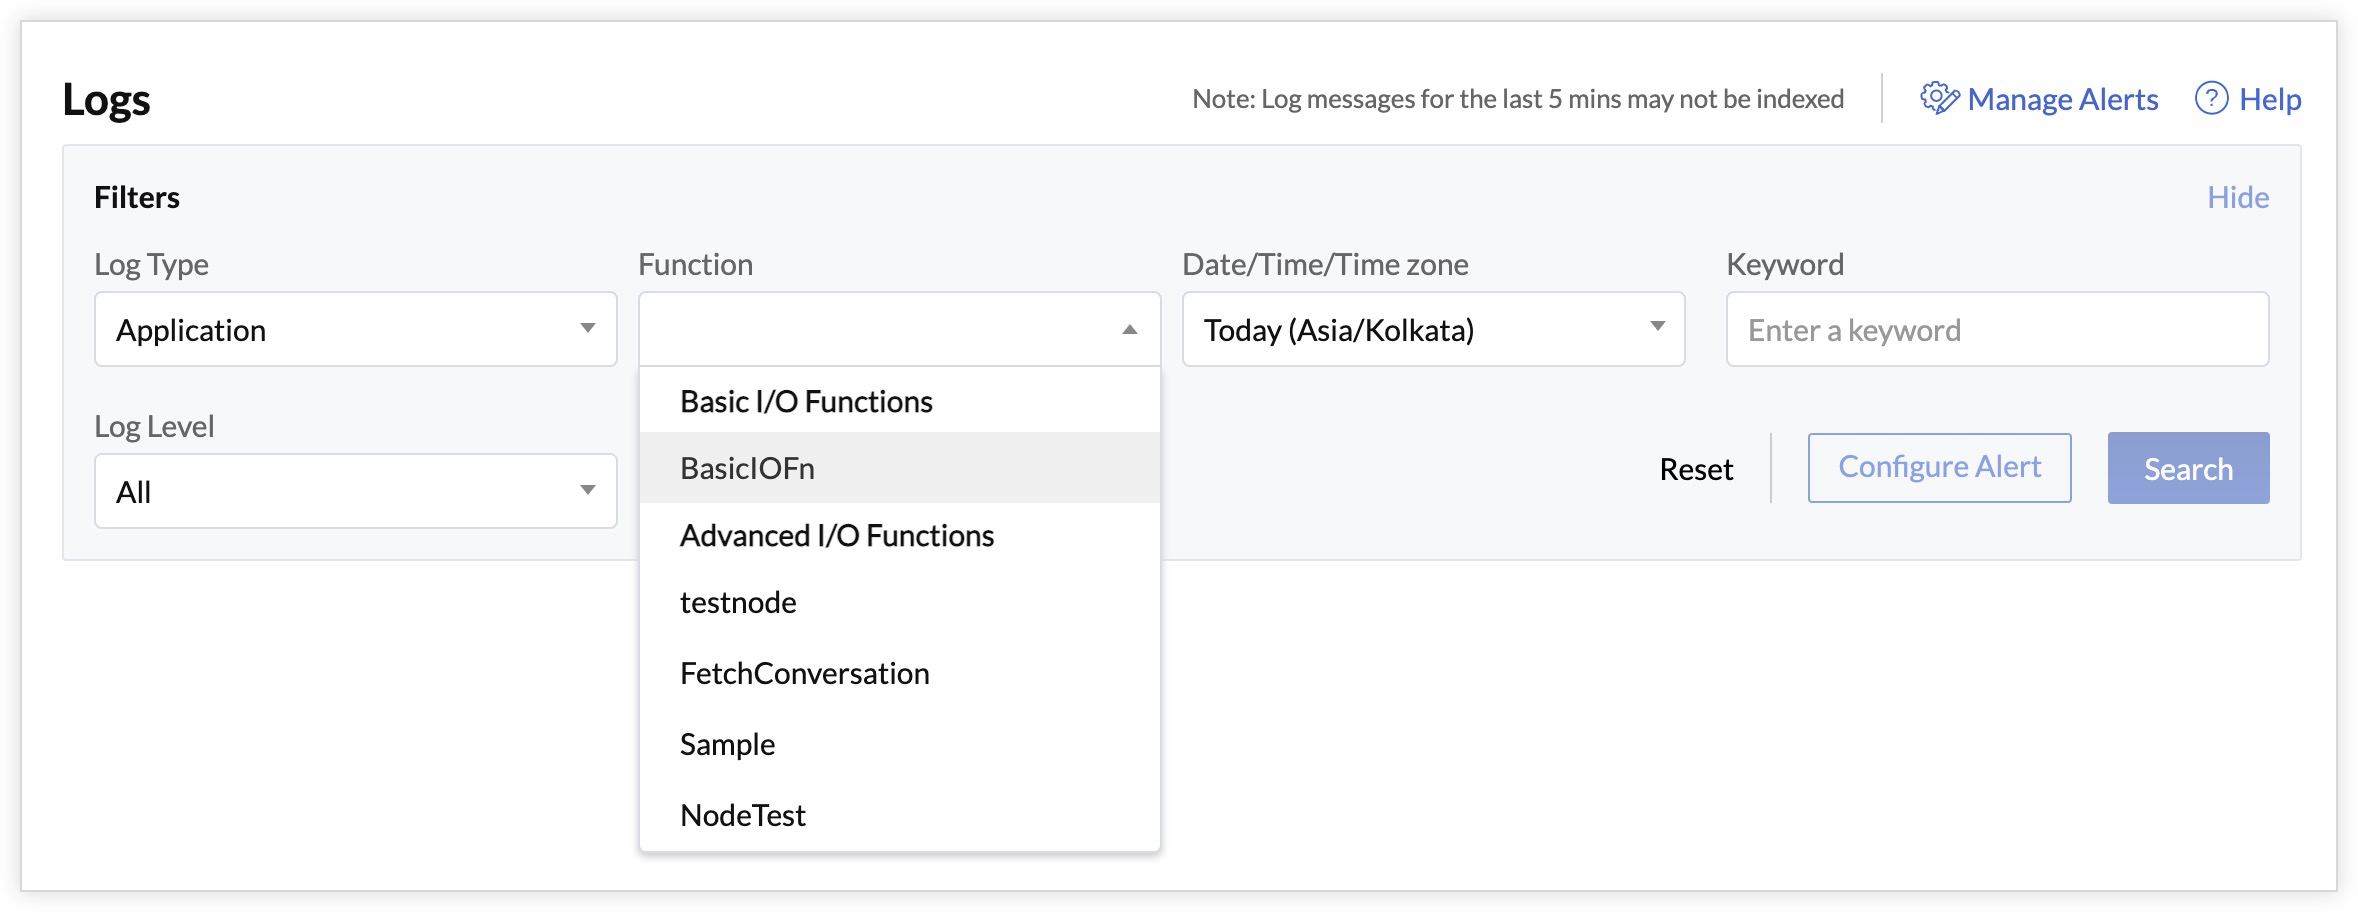
The filters available for Access logs are shown below.

- Log Type: You must select Access or Application log type to view the respective logs. The other filters will change slightly based on the type you select.
- Date/Time/Time zone: You can select a time period of logs to show from the variety of options in the Date/Time dropdown list.
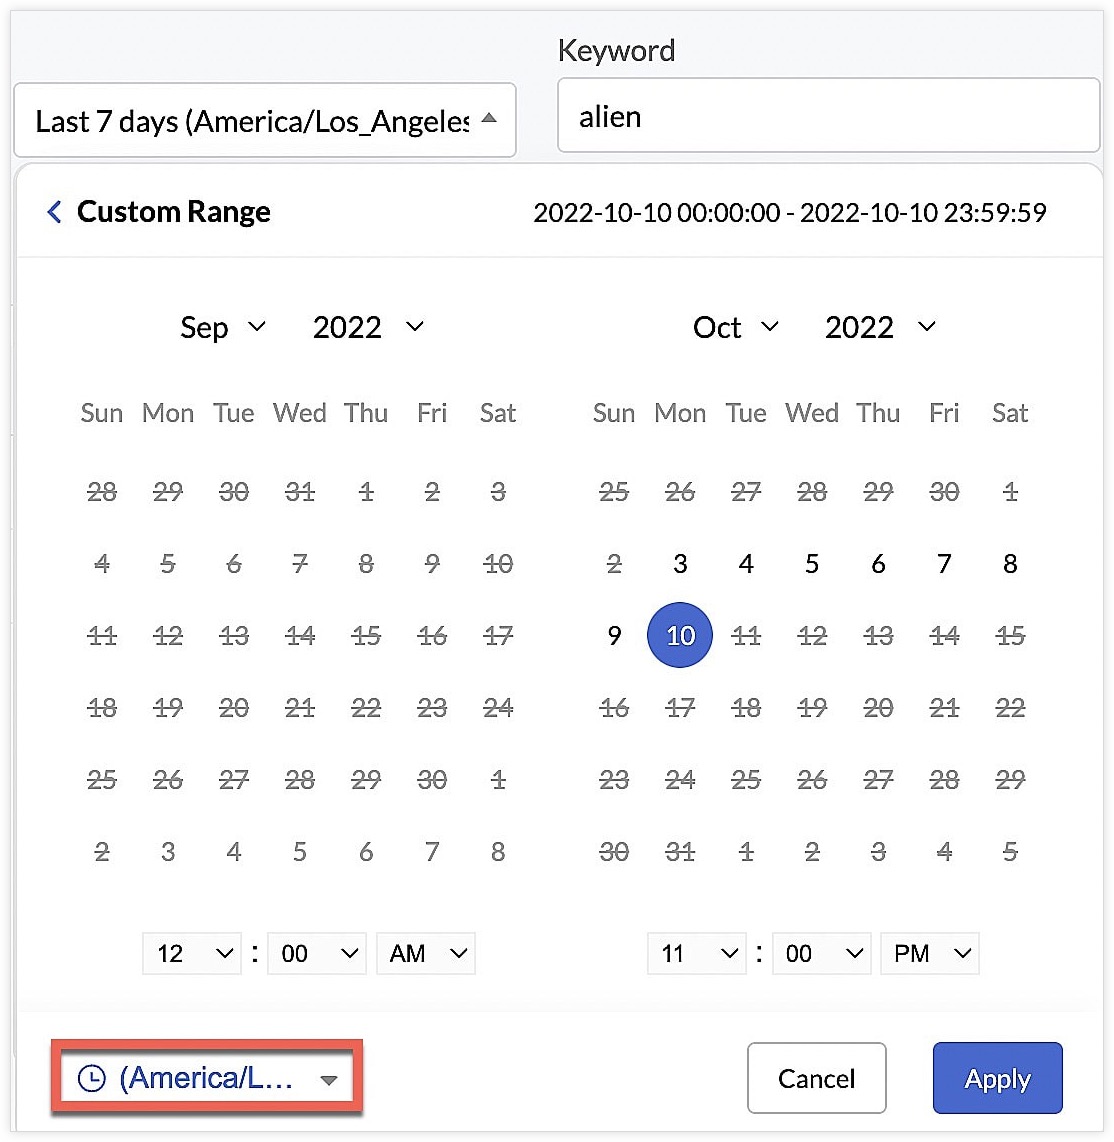
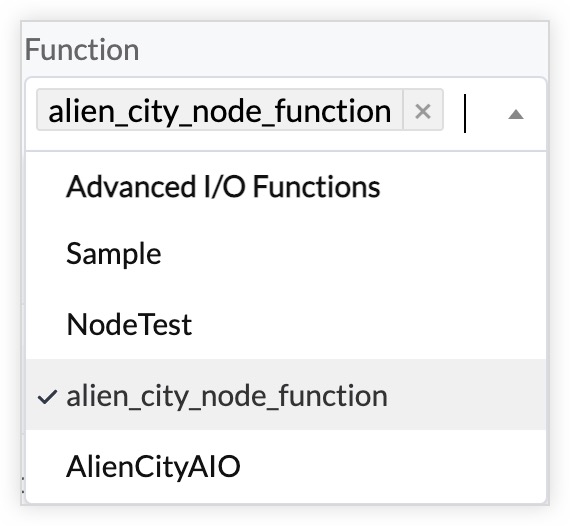
You can also select a custom time range from a calendar, by clicking on the dates that you require and entering the time. You can also select the preferred timezone. Click Apply after the selection.Note: You can change the default timezone of your Catalyst project in the General Settings. However if you wish to switch the timezone for viewing function logs here, you can use the filter specified above. - Function: You must select one or more functions from this dropdown list to view their logs. The Access logs only list Basic I/O, Advanced I/O, and Integration functions.
- Keyword: You can also search for a specific keyword that you might have included in your log message while writing the function, to view logs that include this keyword.
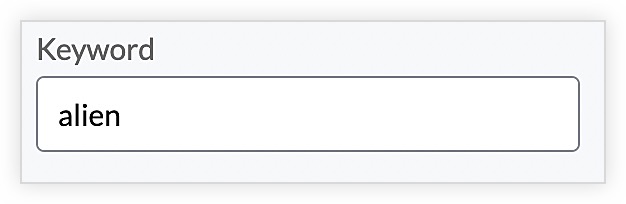
For example, to access the execution logs of a function that contains a specific path in its request URL, you can enter that path as the keyword and search for the logs.


Click Search after you set the filters.
Access Log Results
The results of Access logs will contain information relating to the external access layer such as the function name, User ID of the user who invoked it, the invocation URL, time of execution, request method, the host address, and response details such as the HTTP response status and response time.

The logs are generally indexed instantly, but there could be a 5 minute delay in indexing in some cases. When the filter section is hidden, the results page shows a Refresh Logs button. You can click this to obtain the latest log results.

Application Logs
Application logs display the log details of the internal application layer in the gateway of a function's execution. The internal layer of the gateway, as explained in the Access Logs section, logs application-level details. This includes details related to the processing of the function, such as the messages passed to the logs at particular instances, log severity levels, etc.
This internal application-level logging is applicable to both functions that were invoked manually by a user or executed internally by the application. An example of an internal function execution is, a daily Cron execution that triggers the invocation of a Cron function automatically every day. Log details of such functions are also included in the Application logs.
Application logs therefore contain execution logs of all function types, including Event and Cron functions.
Log Levels of Java and Node.js Functions
Application logs include log levels that indicate the severity of an error faced in a function execution. As mentioned in the Pushing to Logs section, you can assign an appropriate log level to an event or an error when you code the function. The log levels differ based on the function stack, i.e., Java or Node.js functions.
The log levels of Java platform supported by Catalyst that you can use in your functions are:
- Severe: Indicates a serious failure
- Warning: Indicates a potential problem
- Info: Indicates an informational message
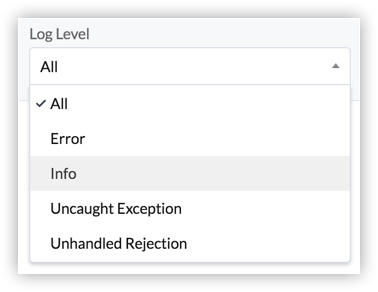
The log levels that you can use in Node.js functions are:
- Error: Indicates an unexpected error
- Info: Indicates an informational message
- Uncaught Exception: Indicates an exception that was left uncaught by the compiler, but caught by the exception handler
- Unhandled Rejection: Indicates a rejected promise, which is the failure of an asynchronous operation
You can use select one of these log levels in the filters to fetch execution results of that level alone.
Application Log Filters
Application logs include some more filters in addition to the Access log filters. The filters available for Application logs are shown below.

The Log Type, Date/Time/Time zone, and Keyword filters are the same as the Access log filters.
- Function: The Function filter in Application logs lists functions of all types. You must select one or more functions from this dropdown list to view their logs.
- Log Level: Log Level: Based on the functions that you select, the log levels of Java or Node.js functions are shown. If you select functions of both Java and Node.js in the Function dropdown, a mixture of both Java and Node.js log levels will be available in this dropdown. Relevant details of each function will be shown in the results.
- Execution ID: When a Cron or an Event function executes, a unique Execution ID is associated with each execution. You can filter the logs by providing this Execution ID, and fetch that particular execution alone.
The execution history section of an Event Listener or a Cron also contains a direct access to Logs. You can select a particular execution, and click on the View Logs button to open Logs from there.


Click Search after you set the filters.
Application Log Results
The results of Application logs will contain information relating to the internal application layer, such as the function name, time of execution, log level, and the messages pushed by the developers when specific events or errors occur.

When the filter section is hidden, the results page shows a Refresh Logs button. You can click this to obtain the latest log results.

Managing Alerts in Logs
As mentioned earlier, you can create application alerts for logs directly from the Logs section without having to navigate to that component.
Application alerts enable you to configure automated log searches to be executed in a recurring schedule, by specifying the search query and the frequency of execution. Catalyst will send automated emails with the results of the log search each time.
You can configure alerts by clicking the Manage Alerts option available in the top right-hand side of the console.

Catalyst will open a pop-up to configure the alert. You must enter the alert name and details, such as the type of log, the criteria to trigger the alert, the frequency, and the email address to notify. You can learn more about these from the Application Alerts help page.

Click Confirm after you configure the alert. Catalyst will now send emails whenever alerts are triggered for these specifications.