
- HOME
- Financial Management
- Reading between the lines: How to analyze financial statements for smarter business decisions
Reading between the lines: How to analyze financial statements for smarter business decisions
Key Takeaways
- Financial statements are decision-making tools, not just compliance documents.
- Each financial statement serves a distinct purpose.
- Common-size analysis simplifies complex data
- Ratio analysis provides deeper financial insights.
- Trend analysis reveals direction, not just position
- Comparative analysis adds context to performance.
- No single method is sufficient on its own.
- Accurate financial data is the foundation of effective analysis.
Financial statements are a valuable source of insight for a business. By looking beyond the numbers, one can understand key aspects of profitability, risk, and efficiency that drive sound business decisions. Interpreting them correctly helps management assess current performance, prepare effective budgets, forecast future requirements, and plan strategically.
Apart from being a compliance requirement, financial statements serve as a powerful tool to streamline business planning and decision-making. Understanding the key financial statements and their nuances forms the foundation for effective financial statement analysis. The balance sheet, profit and loss statement, and cash flow statement are the three primary financial reports that offer distinct perspectives on a business’s financial health.
Types of Financial statements
Balance sheet
A balance sheet provides a snapshot of a business’s financial position at a particular point in time. It is structured based on the fundamental accounting equation:
Assets = Liabilities + Equity
One side of the balance sheet lists the assets owned by the business, while the other side presents liabilities and equity, showing how those assets are financed. When both sides are equal, the accounts are said to be balanced.
Key components
Assets: Current (cash, receivables, inventory) and non-current (property, equipment)
Liabilities: Short-term obligations and long-term debt
Equity: Owner’s capital and retained earnings
A key insight from the balance sheet is the source of financing—whether the business relies more on the owner’s capital or debt. A deeper analysis of individual components helps uncover liquidity position, financial stability, and capital structure.
Quick tip
Always compare current assets with current liabilities to assess short-term financial health, and observe how debt levels change over time.
Profit and loss statement
The profit and loss (P&L) statement presents the financial performance of a business over a specific period. It shows how revenue is converted into profit after accounting for expenses, interest, and taxes.
Key components
Revenue
Cost of goods sold (COGS)
Operating expenses
Interest and taxes
Net profit
The P&L helps evaluate:
Profitability
Cost structure
Operational efficiency
A consistent increase in revenue with controlled expenses indicates a healthy business, while rising costs may signal inefficiencies.
Quick tip
Focus on profit margins rather than absolute profit to understand how efficiently the business converts revenue into earnings.
Cash flow statement
While the balance sheet and P&L provide position and performance, they are accrual-based and do not fully reflect actual cash movement. The cash flow statement tracks real cash inflows and outflows.
A business can be profitable but still face liquidity issues if cash is not managed properly.
Types of cash flows
Operating activities: Cash generated from core business operations.
Investing activities: Purchase and sale of long-term assets.
Financing activities: Borrowing, repayment, and equity transactions.
The cash flow statement helps businesses understand their
Ability to meet obligations
Cash sustainability
Financial flexibility
Quick tip
Pay close attention to operating cash flow; it should ideally be positive and aligned with profitability.
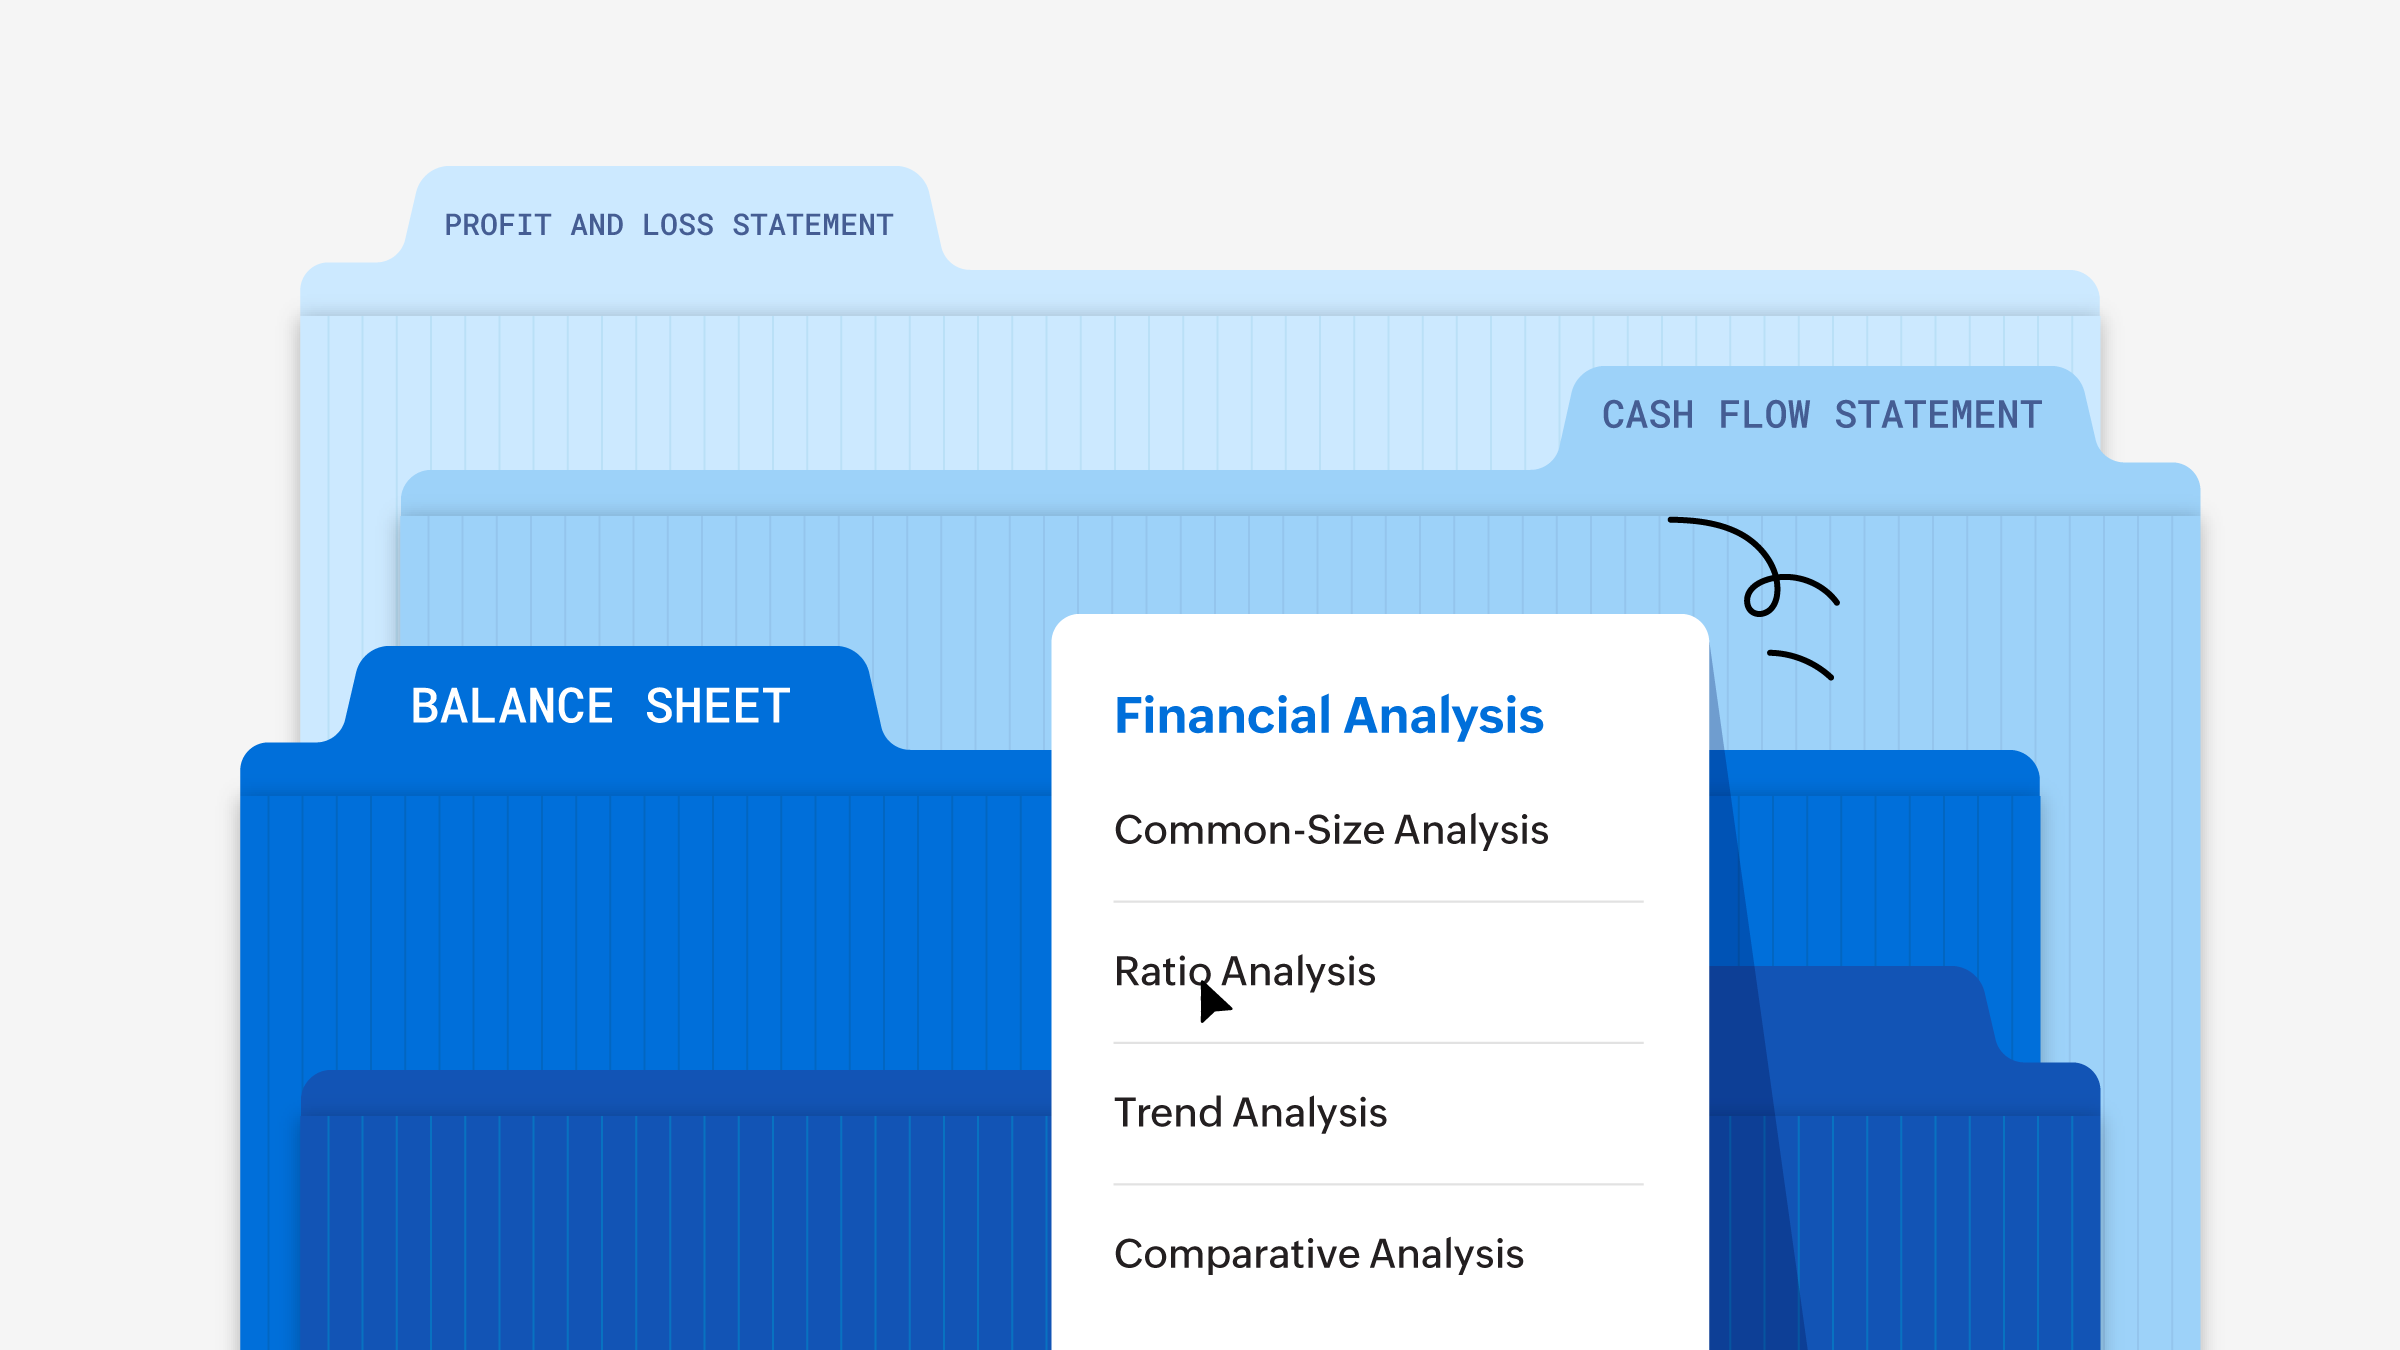
Financial statement analysis
Common-size analysis
Common-size analysis presents financial statement line items as a percentage of total assets (balance sheet) or revenue (P&L). It helps management in the following ways:
Enables easy comparison across companies of different sizes
Provides clarity on cost and asset structure
Highlights inefficiencies
Supports trend tracking
Simplifies interpretation
Quick tip
Track changes in expense percentages over time—rising costs as a percentage of revenue can signal declining efficiency.
Ratio analysis
Ratio analysis involves calculating relationships between financial statement items to gain deeper insights into performance and position.
Key ratios
Liquidity ratios: Assess short-term obligations.
Example: Current ratioSolvency ratios: Measure long-term financial stability.
Example: Debt-to-equity ratioEfficiency ratios: Evaluate resource utilization.
Example: Inventory turnoverProfitability ratios: Measure earnings performance.
Example: Net profit margin, ROA, ROE
Ratios do not just measure performance; they help identify strengths, weaknesses, and risks within the business.
Quick tip
Avoid relying on a single ratio. Always interpret ratios together for a complete picture.
Trend analysis
Trend analysis evaluates financial data over multiple periods to identify patterns and direction. It helps identify:
Growth patterns
Consistency of performance
Early warning signals
A steady increase in revenue indicates sustainable growth, while fluctuating profits may point to instability or inefficiencies. Trend analysis also helps detect early warning signs such as rising expenses, declining margins, and increasing debt levels.
Quick tip
Analyze at least three to five years of data to identify meaningful trends rather than relying on a single period.
Comparative analysis
Comparative analysis places financial data in context by comparing it with:
Competitors
Industry benchmarks
Past performance
Numbers and ratios can be misleading when viewed in isolation. A high profit margin may appear strong, but only comparison reveals whether it is competitive. Comparisons should be made with businesses of similar size, industry, and operating conditions.
Quick tip
Always benchmark your performance against industry averages to understand where you truly stand.
From numbers to meaningful decisions
No single method of analysis provides a complete picture. Each method addresses a different aspect—structure, performance, direction, and context—and together they offer a complete view for better decision-making.
Financial statement analysis is more than a technical exercise—it is a critical business skill that enables informed and strategic decisions. The interpretation of financial statements allows businesses to move beyond raw data, uncover deeper insights, and understand their true financial position.
However, the effectiveness of any analysis depends on the accuracy and reliability of the underlying data. Maintaining clean and well-structured financial records is therefore essential.
Accounting software like Zoho Books can support this process by providing accurate, real-time financial data and customizable reports, enabling businesses to analyze performance efficiently and make better decisions.