More Powerful Reporting with Query over Query feature

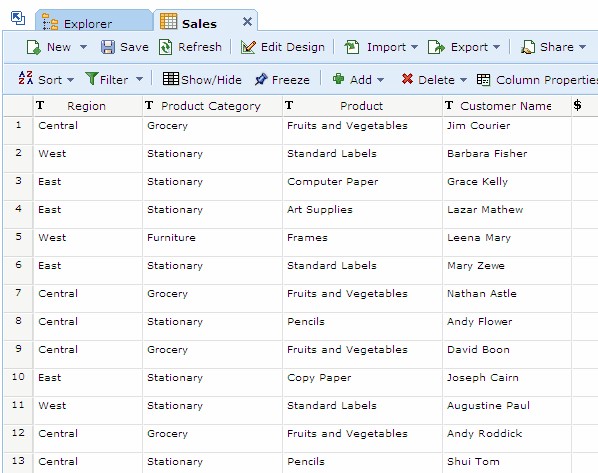
The latest Zoho Analytics update brings in the ‘Query over Query’ functionality, which has been one of the top request from our users. You can now have SELECT queries that combine already existing Query Tables. Let’s see an example of how this comes in handy. Say you have a Sales table with sales figures for various customers, products, regions etc across years.
Say you would like to know who your Top 10 customers with respect to sales value were in 2006. Your query table would look like,

The above Query Table in ‘View Mode’ with the top 10 customers arranged in alphabetical order.

And now you want to
know how much you sold to those top customers of 2006 in 2008. This is
where the new functionality will come in handy. You will arrive with
the required data by joining the base Sales table with the above top 10
customers of 2006 Query Table. The new Query Table will look like,

The above Query Table in ‘View Mode’ with the customer names in alphabetical order.

You can save the resultant query table and create the necessary reports over it.
With this new “Query over Query” feature of our reporting software, you can create very powerful
reporting queries on your data and use it for your report generation
and analytics. It also helps in organizing your queries into reusable
functional units. To know more about how to create a Query Table,
checkout this video.
Other Enhancements
Previously, direct import was restricted to CSV files. And you had to do a copy-paste from Microft Excel (XLS) files. From now on, you can directly import XLS files too.
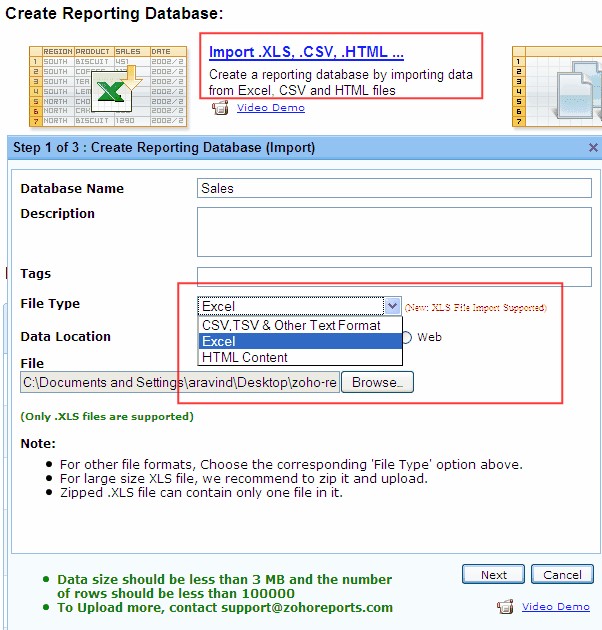
Also, for xls, html files larger than 3 MB, you can now zip them and import into Zoho Analytics.
Try these new features in Zoho Analytics and let us know your feedback comments.
Related Posts


Comments
4 Replies to More Powerful Reporting with Query over Query feature
@Drazick,We are working to enhance the Chart/Graphing capability in Zoho Analytics. Recently we have given a face lift to the visual presentation of Pie and 2D Bar charts. More to come in this aspect in the very near future.Also we will continue to provide more customization options in each charts that we provide. Stay tuned....If you have any specific feedback, please do post them to support at zohoreports dot com as it would be really helpful to us.Clarence
Zoho Analytics - Online Reporting and Business Intelligence
Now all we need is a better Chart / Graphs system :-).
Now all we need is a better Chart / Graphs system :-).