What will I learn?
- What is a KPI Dashboard? A Complete Guide
- What is a KPI dashboard?
- What is a KPI & why is it important to track your KPIs?
- What are the benefits of having a KPI dashboard?
- KPI dashboards examples
- Executive KPI dashboard
- Inbound marketing KPI dashboard
- Outbound marketing KPI dashboard
- Social media KPI dashboard
- How to create a KPI dashboard tailored to your needs?
- Best practices for creating KPI dashboards
- Powerful KPI dashboard tool by Zoho Analytics
What is KPI dashboard? Examples, Benefits & Best Practices
As an executive, making key decisions without a comprehensive overview can be overwhelming. However, this is almost impossible because the data to stay informed is available in different places.
What if you could collate all the key information in one place and access it anytime, anywhere? Yes, with a KPI dashboard, you can easily do all of these.
Let's learn and understand the nitty-gritty of KPI dashboards in detail.
What is a KPI dashboard?
A KPI dashboard is a collection of key performance indicators (KPIs) in one place, giving you a bird’s-eye view of your business performance. Making decisions to reach your goals is made easier with the help of a KPI dashboard, which allows you to compare and analyze all the KPIs in one place.
What is a KPI & why is it important to track your KPIs?
KPIs are measurable indicators of your goals. A KPI can be evaluated both qualitatively and quantitatively. For instance, your company's sales and order totals are quantitative KPIs, whereas product reviews and customer satisfaction levels can be qualitative.
With KPIs, you can assess whether your company is developing as expected, anticipate issues earlier, and make the best choices possible.
What are the benefits of having a KPI dashboard?
As we see, there are many benefits to using a KPI dashboard, and we'll see some key benefits that businesses get.
Access all metrics in one place:
When you have all the relevant metrics in one place, you can save time switching between apps and data analysis.
Get insights from data in real-time:
As the data gets updated in real-time, you can derive insights on the fly. In addition, you can also choose to set data alerts for critical metrics.
Uncover trends and outliers:
With data visualization, you can transform your data into visualizations and identify trends and patterns from them. After uncovering trends, businesses can come up with new ideas and opportunities.
Predict problems early:
With the assistance of artificial intelligence in data analytics software, businesses predict their growth and performance and take necessary actions on time.
Make better decisions:
The core purpose of creating a KPI dashboard is to derive meaningful insights. After gathering required insights from the dashboard, businesses can make informed decisions, create or re-evaluate strategies, and improve business performance.
KPI dashboards examples
KPI dashboards are different based on the business type and industry as they choose the metrics to monitor. A universal KPI dashboard template does not exist, as each business has distinct needs that require a customized dashboard to facilitate effortless progress tracking.
However, below are some KPI dashboard examples that will help you get started.
Executive KPI dashboard
The management or leadership team needs to track the critical KPIs of the organization without spending much time and make decisions based on trends. A KPI business dashboard for the organization will help them monitor the key metrics in real time without much effort.
Here’s a KPI dashboard example for the CEO of a software or SaaS company. We’ve blended data from Zoho CRM, Zoho Books, and Zoho Desk for this KPI dashboard. However, you can choose to blend data from any of your preferred data sources.

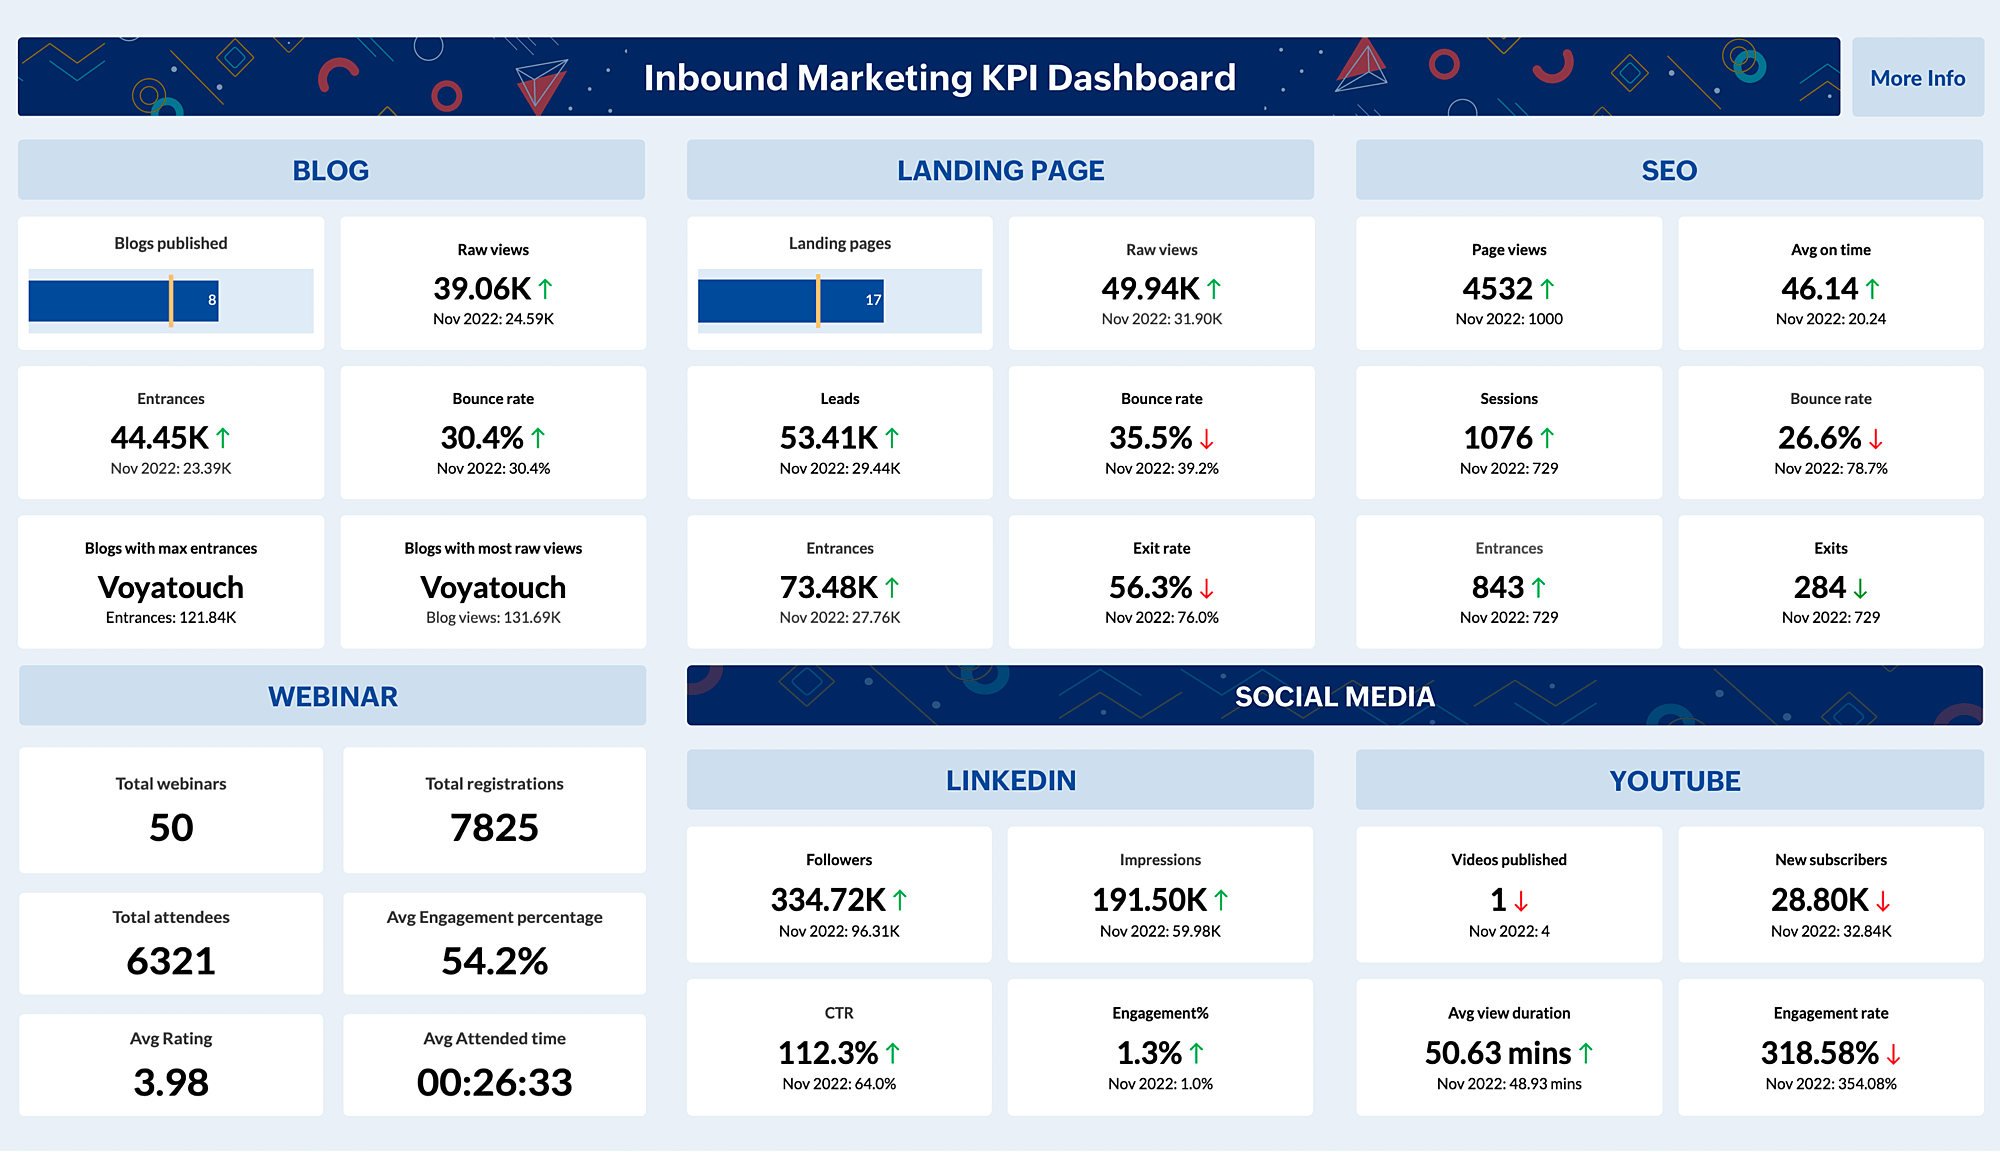
Inbound marketing KPI dashboard
If you want to track the performance of all your key inbound marketing efforts in less time, an inbound marketing can help. You can create a KPI dashboard by selecting key metrics that you want to track regularly.
Below is an inbound marketing KPI dashboard that contains critical metrics that you might want to track.
Outbound marketing KPI dashboard
Like for inbound marketing, you can also create a dashboard to track your outbound marketing efforts. Below is an outbound marketing KPI dashboard that contains critical metrics that you might want to track.

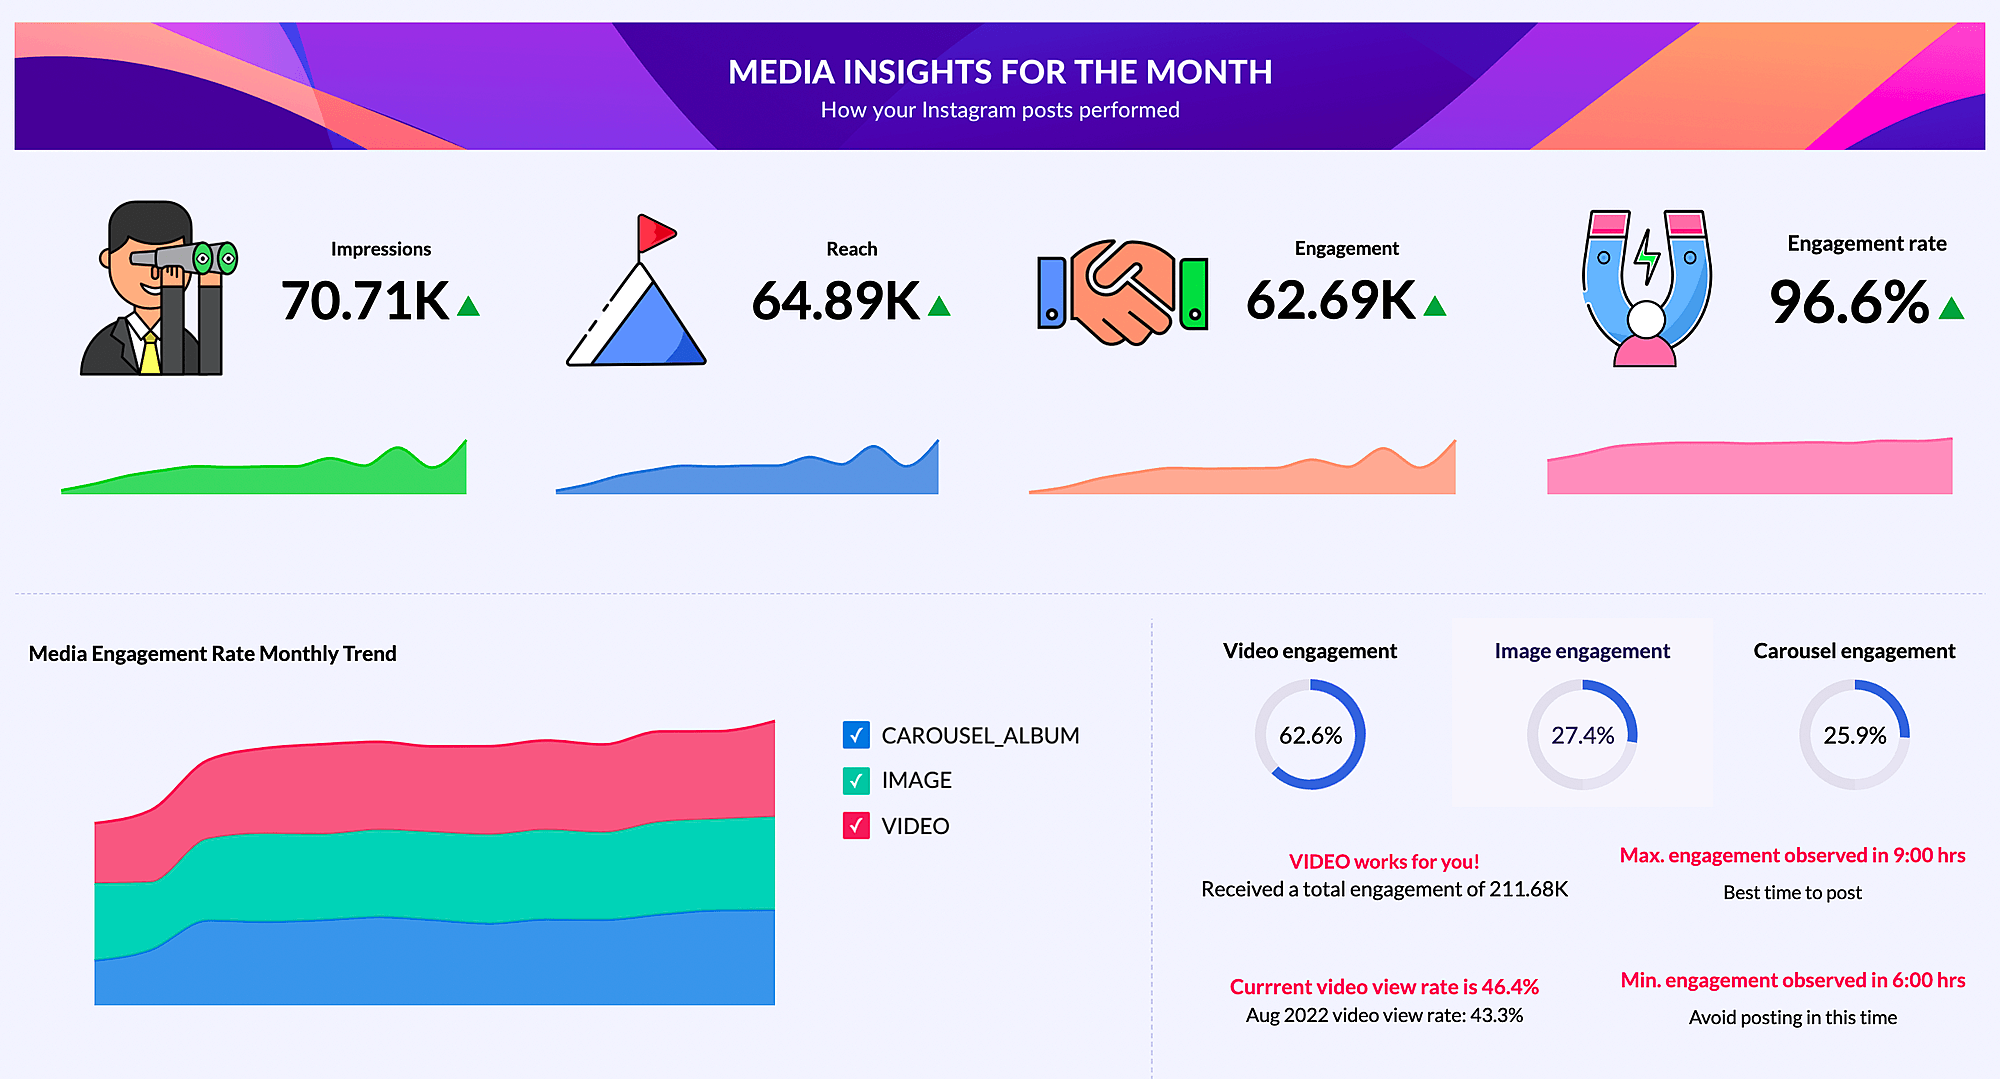
Social media KPI dashboard
Social media managers and agencies need to track the performance of social media handles in real time to understand the performance of their team's marketing efforts. With social media KPI dashboards, they can track all their key metrics in one place and share the dashboards with their managers and clients.
Below is an example KPI dashboard created for Instagram:
How to create a KPI dashboard tailored to your needs?
Follow the steps below to create a KPI dashboard.
Step 1. Gather the metrics you want to track:
Identify the key performance indicators (KPIs) that are most relevant to your business goals and objectives.
Step 2. Ensure you have all the required data:
Make sure you have access to all the data necessary to track your chosen KPIs.
Step 3. Discuss with your team and stakeholders:
Get input and feedback from your team and stakeholders to ensure the KPIs you've chosen are relevant and meaningful to everyone.
Step 4. Choose a KPI dashboard tool:
Select a dashboard tool that fits your needs and is capable of visualizing the data you want to track.
Step 5. Import required data and prepare it for analysis:
Import the data into the KPI dashboard software and clean, organize, and structure it to ensure it is ready for analysis.
Step 6. Create visualizations from the data:
Create graphs, charts, and other visualizations that accurately convey the data in a meaningful way.
Step 7. Put the visualizations together on a dashboard:
Arrange the visualizations on a dashboard in a logical and intuitive way that allows you to quickly and easily assess the performance of your KPIs.
Best practices for creating KPI dashboards
Here are some tips you can follow to create your first KPI dashboard:
Keep it simple and select KPIs based only on your goals:
Focus on the KPIs that are most relevant to your business goals and objectives, and avoid cluttering your BI dashboard with unnecessary metrics.
Ensure your data is clean and accurate:
Make sure your data is accurate, up-to-date, and free from errors or duplicates before starting to create your dashboard.
Pick appropriate visualizations:
Choose the best visualization types (such as line charts, bar charts, or pie charts) for your data to make it easier to interpret and understand. You can also refer to our chart picker guide to learn how to choose the appropriate visualizations for your reports.
Use data storytelling:
Tell a story with your data to help your audience understand the trends, patterns, and insights you want to convey.
Avoid widgets that don’t add value:
Eliminate any widgets or visualizations that do not add value or distract from the main message of your dashboard.
Powerful KPI dashboard software by Zoho Analytics
To create an effective KPI dashboard, you can use a powerful KPI tracking software like Zoho Analytics. With Zoho Analytics, you can import and blend data from 250+ sources, try out multiple data visualizations, access auto-generated reports and dashboards, get automated insights, and much more.
Here’s how to create a KPI tracking dashboard using Zoho Analytics:
- Sign up with Zoho Analytics.
- Import data from your preferred data source. A set of reports and dashboards will be automatically generated.
- Click the +Create button at the top-left corner and select Dashboard.
- Drag and drop the required KPIs from the left pane.
- Click the Widget button to add a custom widget. You can add as many widgets as you need.
- Add a title to the dashboard and save it.
Sign up with Zoho Analytics for a free 15-day trial and start creating your KPI dashboards today.
SIGN UP FOR FREE