Harness the full potential of your data with free data analytics software
Data-driven decisions fuel growth. If you are a startup or a small business, understanding your data is the key to staying ahead. With free data analytics software, you can track performance, uncover trends, and turn raw data into meaningful insights.
Sign up for free
- 16K
Customers
- 3M
Users
Why do you need free data analytics software?
A free data analytics tool helps you gain valuable insights by transforming raw data into clear, actionable information. Instead of relying on guesswork, you can track trends, measure performance, and make data-driven decisions with confidence.
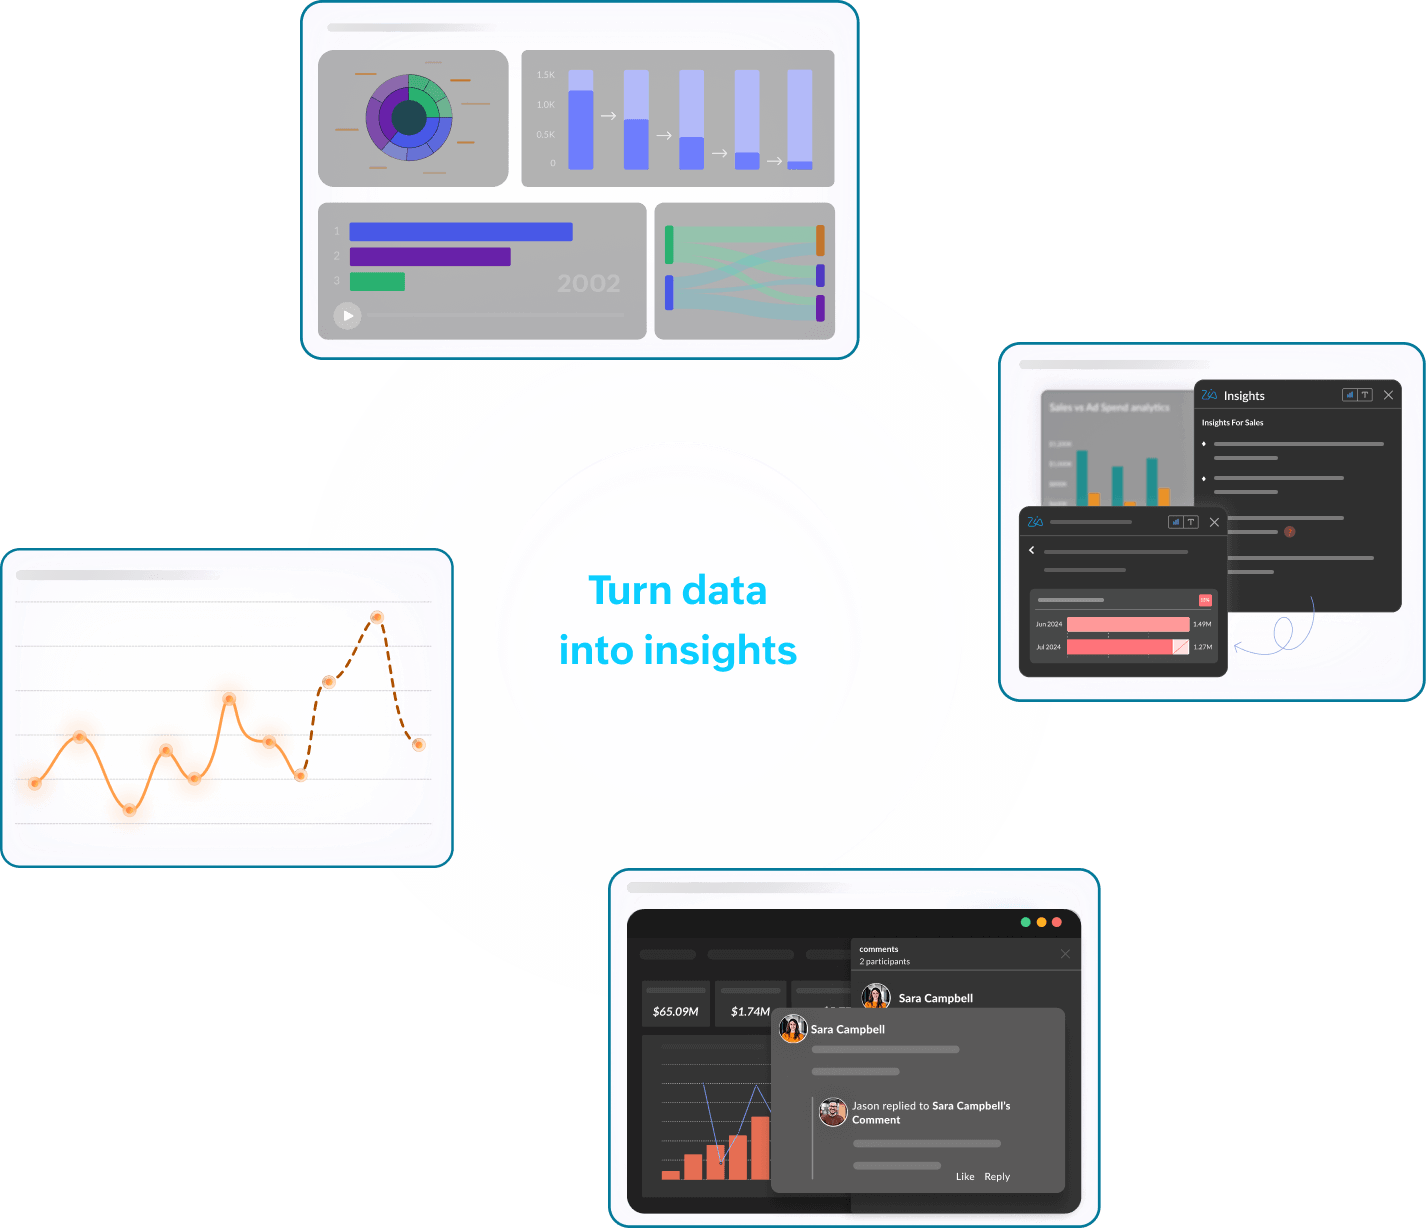
By using Zoho Analytics as your data analytics software, you can create real-time reports and interactive dashboards and analyze key business metrics.
Get powerful insights and make smarter business decisions in just three simple steps—all for free!
Connect your data
Easily import data from 100+ sources, including cloud drives, files, feeds, databases, data warehouses, data lakes, and relational databases. Seamlessly integrate with your existing tools for real-time updates.

Create reports and dashboards
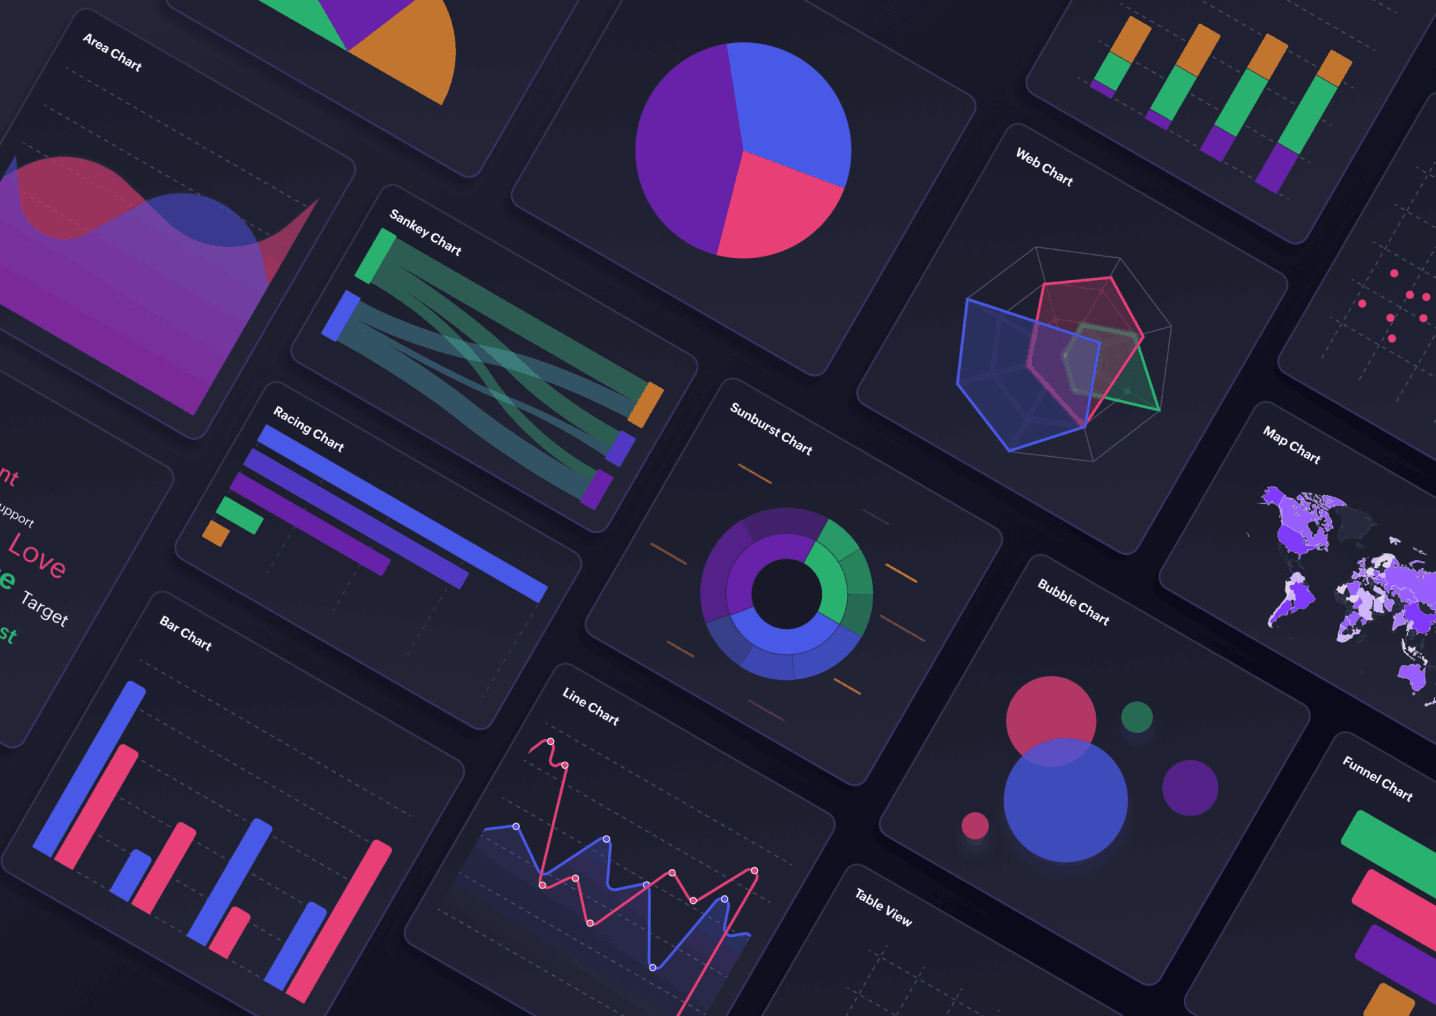
Transform raw data into meaningful insights with interactive reports and dashboards. With 75+ chart types available, you can visualize your data in the most impactful way.
Leverage AI-powered analytics
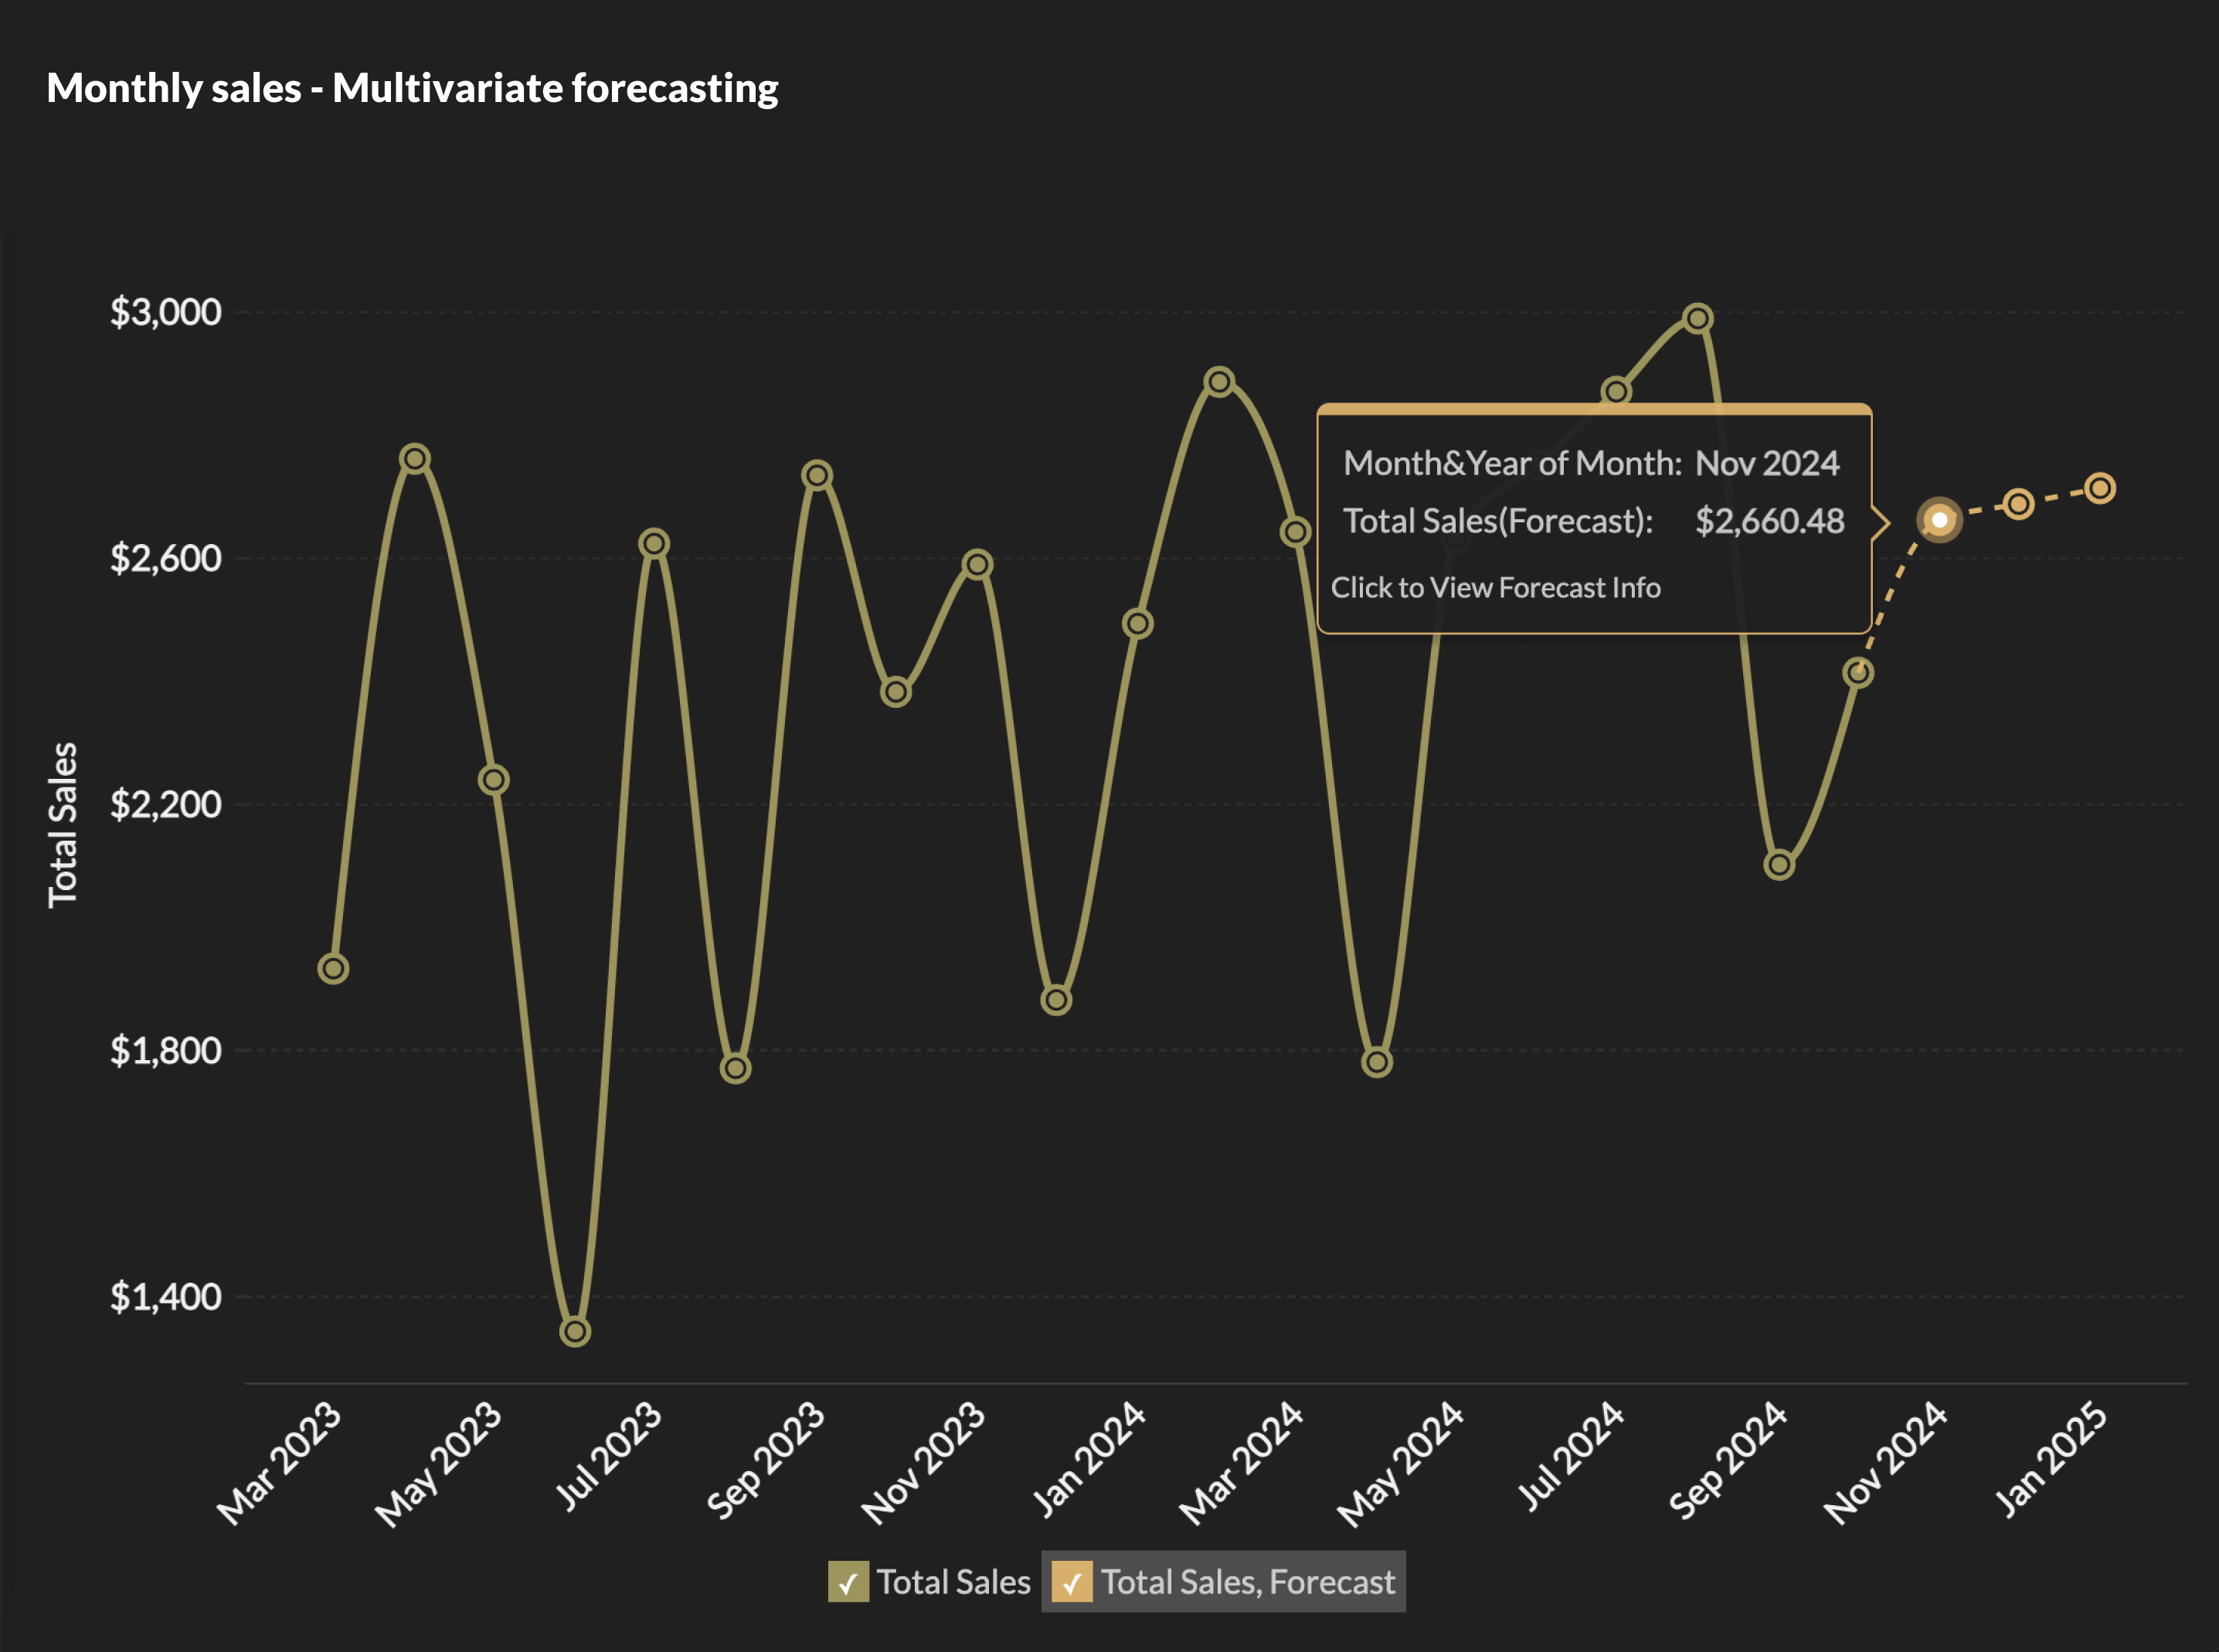
Use the full potential of your data with advanced AI-driven features. Detect trends, identify anomalies, and make data-backed decisions using predictive analytics, auto-analysis, and more.
Key features available in the Zoho Analytics' free plan
For startups and small businesses(data analytics for small business) looking to harness the power of their data, our free data analytics software offers a feature-rich solution. Designed to accelerate insights at scale, it empowers you to make data-driven decisions.
Seamless data integration
Connect, import, and integrate data from spreadsheets, cloud storage, databases, and more.
Automated data sync
Keep your data up to date with scheduled daily imports, so your reports and dashboards always reflect the latest information.
Unlimited reports and dashboards
Create reports and dashboards without limitations. Choose from 75+ visualization types to present your data effectively.
AI-powered advanced analytics
Use AI features like predictive analytics, what-if analysis, auto-analysis, and anomaly detection to uncover trends and gain deeper insights.
Easy collaboration
Easily share reports and dashboards with team members, up to two users. Collaborate and make informed decisions together.
Mobile app
Stay connected to your data anytime, anywhere with dedicated mobile apps for Android and iOS, so you never miss a critical insight.


Your analysts get...
- Advanced data visualization tools
- Automated data update
- Customizable dashboards
- Easy-to-share reports
- AI-powered insights
Your managers get...
- Performance tracking & KPIs
- Automated reporting
- Trend analysis & forecasting
- Data-driven decision-making
- Seamless team collaboration
Your business becomes...
- More efficient
- Impactful
- Collaborative
- Scalable
- Data-driven
Hear from our happy customers
See all testimonials
Connor Nobert
Director of Analytics and Technology, Pulse LLC"Zoho Analytics gives us a superior edge over Power BI and Tableau, when it comes to the aesthetics of visualization. We're very happy with Zoho’s capability."

Steve Dubane
Founder & CEO, Wingman Media"Zoho Analytics created a tremendous amount of value for the agency and takes our relationship with clients to the next level. The preparedness to integrate the data, build alluring visualizations, and its shrewdness have given us the ability to retain clients.

Korvi Rakshand
Founder, JAAGO Foundation"Our main intent was to make data-driven decisions. We use Zoho CRM and Zoho Books and we wanted to precisely analyze every single data point from these apps. So we fell back on Zoho Analytics. The visualization with data precision is impeccable and we are extremely happy with the Zoho suite of products."

ED Levis
Head of IT, NYC Navigator"Data visualization is important for any BI tool. It's great to present data in a way that is meaningful to the audience, helping them quickly grasp the content. That’s where Zoho Analytics is very strong. We now analyze our sales, operations, and finance using Zoho Analytics."

Daniel Franey
Director & Shareholder, Courier logistics limited"With Zoho Analytics, the ability to visualize things became easy. Most of my managers now use Zoho dashboards and quickly create reports themselves. Its usability features, like easy drag and drop filters and drill down options, are top-notch."
Ben Smith
Advisor and former COO of Sugarfina"Zoho Analytics is the only product with the right mix of cost and value—with features like data visualization, integration, data blending, collaboration, user filters, drag and drop, geomaps, and much more at an affordable price"
Maurizio Pisana
IT Manager, Caffe Moak“Zoho Analytics—being fast, simple, yet compelling BI software—made our lives easier for importing, integrating, and analyzing data. Visualization is another plus in this product, and dashboards are very appealing"
Connor Nobert
Director of Analytics and Technology, Pulse LLC"Zoho Analytics gives us a superior edge over Power BI and Tableau, when it comes to the aesthetics of visualization. We're very happy with Zoho’s capability."
Steve Dubane
Founder & CEO, Wingman Media"Zoho Analytics created a tremendous amount of value for the agency and takes our relationship with clients to the next level. The preparedness to integrate the data, build alluring visualizations, and its shrewdness have given us the ability to retain clients.
Korvi Rakshand
Founder, JAAGO Foundation"Our main intent was to make data-driven decisions. We use Zoho CRM and Zoho Books and we wanted to precisely analyze every single data point from these apps. So we fell back on Zoho Analytics. The visualization with data precision is impeccable and we are extremely happy with the Zoho suite of products."
ED Levis
Head of IT, NYC Navigator"Data visualization is important for any BI tool. It's great to present data in a way that is meaningful to the audience, helping them quickly grasp the content. That’s where Zoho Analytics is very strong. We now analyze our sales, operations, and finance using Zoho Analytics."
Daniel Franey
Director & Shareholder, Courier logistics limited"With Zoho Analytics, the ability to visualize things became easy. Most of my managers now use Zoho dashboards and quickly create reports themselves. Its usability features, like easy drag and drop filters and drill down options, are top-notch."
Ben Smith
Advisor and former COO of Sugarfina"Zoho Analytics is the only product with the right mix of cost and value—with features like data visualization, integration, data blending, collaboration, user filters, drag and drop, geomaps, and much more at an affordable price"
Maurizio Pisana
IT Manager, Caffe Moak“Zoho Analytics—being fast, simple, yet compelling BI software—made our lives easier for importing, integrating, and analyzing data. Visualization is another plus in this product, and dashboards are very appealing"