
Trusted by Over 200,000+ Businesses Worldwide


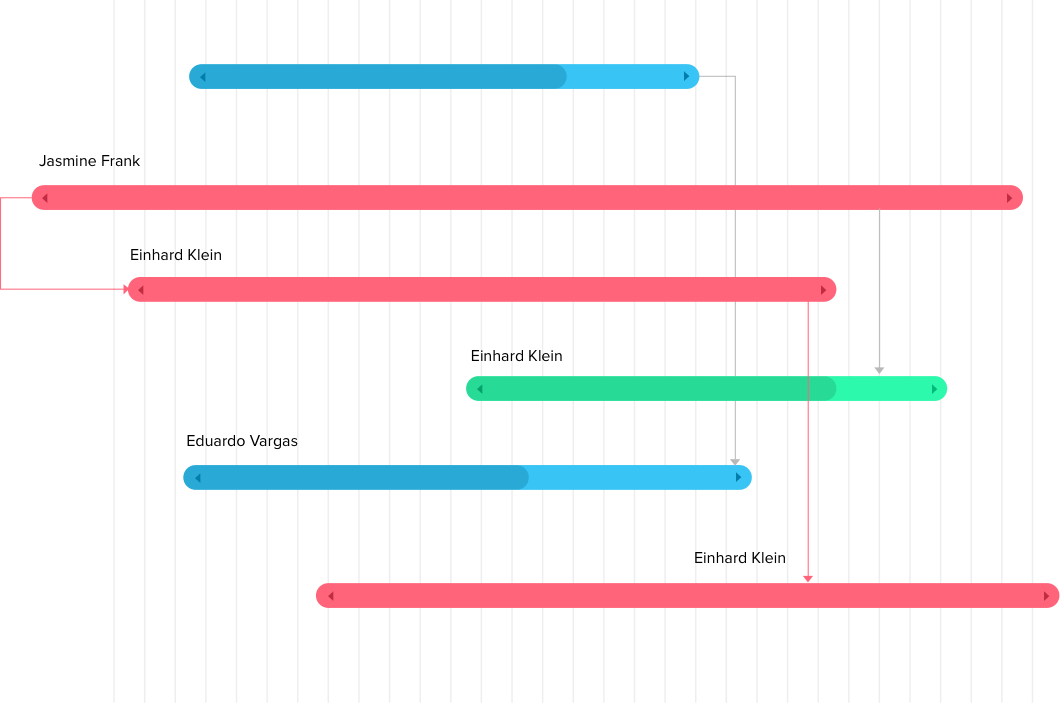
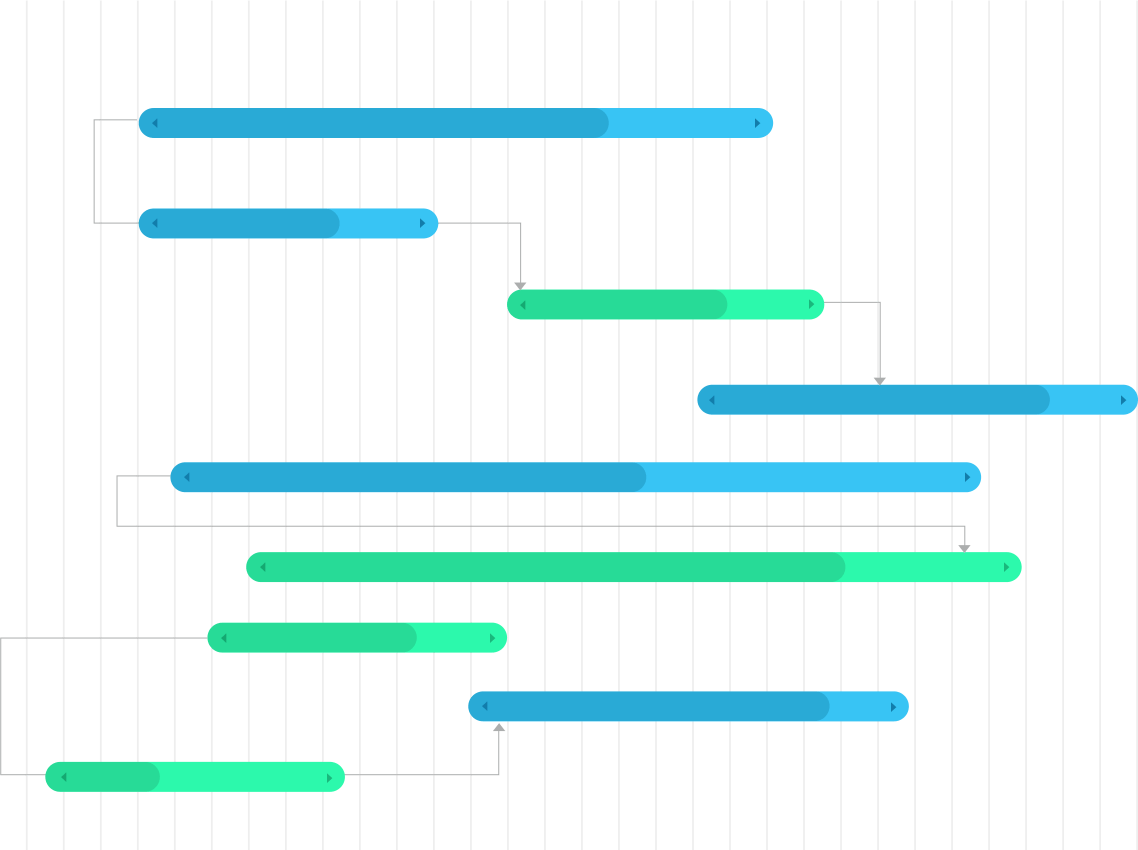
Create and edit dependencies
Sometimes there may be tasks that are related to one another and must follow a specific sequence. The online Gantt chart maker empowers you to establish four types of dependencies for such tasks, enabling you to edit, delete, or modify the time lag between dependent tasks as required.
Identify critical tasks
The critical tasks in a project are those tasks that, if delayed, would have a cascading effect on the entire project. When you are working under tight project deadlines, errors are not an option. Utilize our online Gantt chart maker to pinpoint these essential tasks, enabling you to plan meticulously and allocate resources to ensure project success.
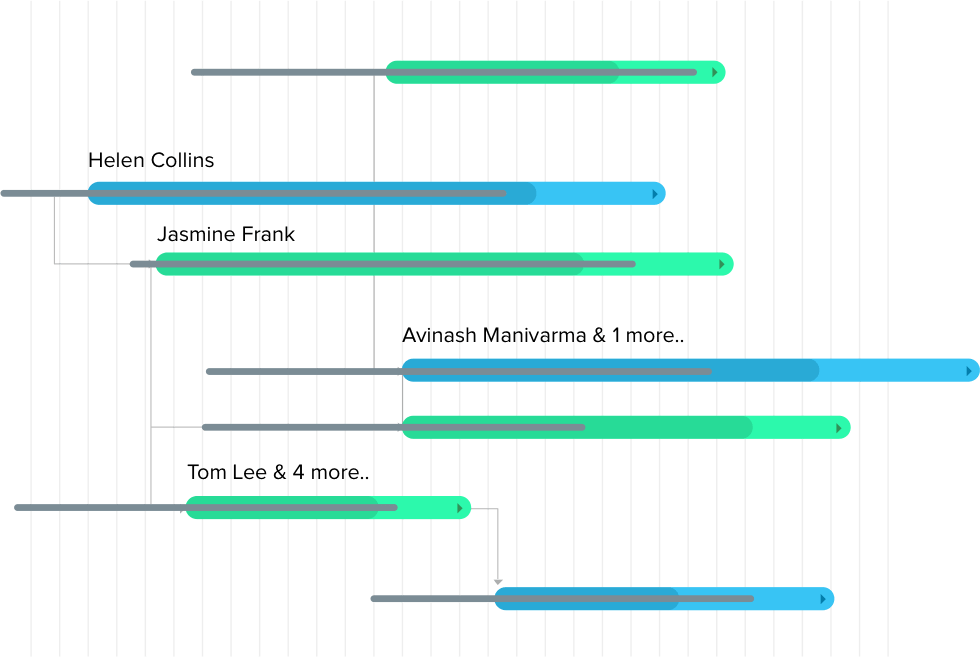
Stay on schedule
Configure baselines in the online Gantt chart maker to assess project progress across various timeframes. In addition to comparing your baseline with actual progress, you can simultaneously compare two distinct baselines. The End Variance feature assists in identifying delayed tasks requiring immediate attention, while Slippage tracks tasks that have yet to commence but have already exceeded the baseline's end date.
Save time with templates
Depending on your work, you might need to execute similar projects periodically. But building projects from scratch each time can be quite cumbersome. With Zoho Projects, you can create new project or tasklist templates, transform existing projects into templates, or even choose from 20+ predefined industry templates that we've designed for you!
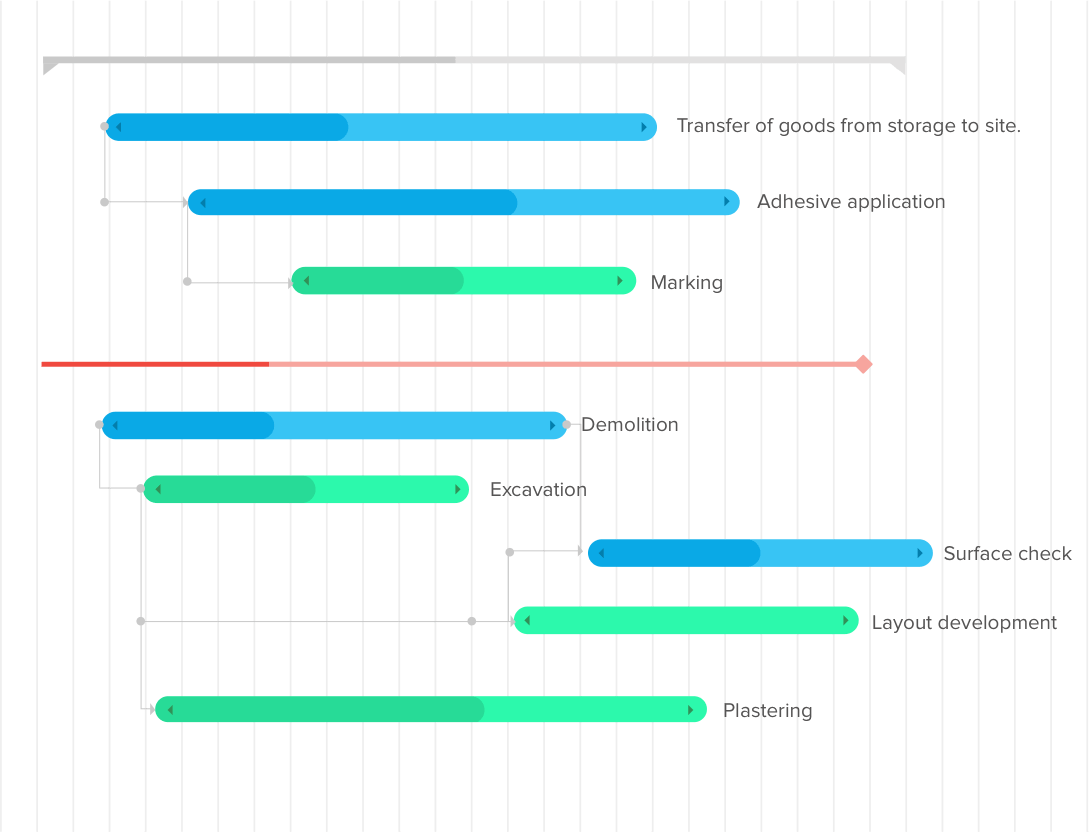
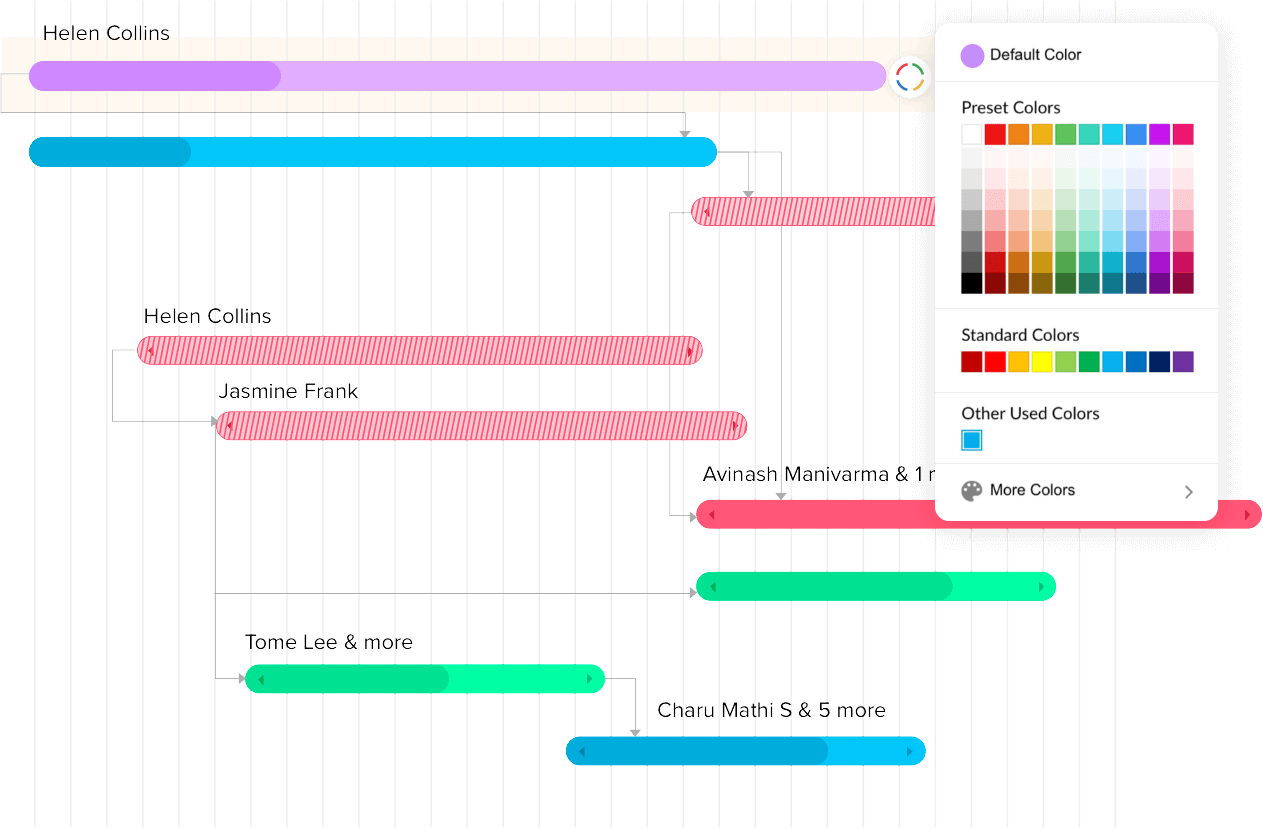
Get the details right
From milestones and tasks to dependencies and progress percentage, every minute detail is color-coded, leaving nothing unnoticed. You can also personalize each task bar with your preferred colors. Additionally, overdue work items are prominently highlighted in red. Moreover, when you create a Gantt chart, holidays and weekends are distinctly marked for your convenience.
I believe that Zoho Projects is the kind of tool that every company needs to get, because its cloud services and multi-platform support makes it the best management tool ever.
Victor Navarro MVA Engineering
Why do project teams need online Gantt chart maker?
Better planning
A robust project plan is essential to mitigate scope creep and maintain adherence to the project schedule. Our free online Gantt chart maker, empowers you to gain a comprehensive project overview. Proactively visualize your entire project, plan and prioritize tasks well in advance, and allocate resources with precision.
Enhanced visibility
No matter how prompt individuals are in completing their assigned tasks, having visibility into the overall project progress is crucial. Transparency in work assigned to each other enhances the team's comprehension of workload distribution, individual contributions, and how each team member can actively contribute to make the project a success using our online Gantt chart.
Improved communication
With increased visibility comes improved communication. Most errors in a project arise due to communication gaps, whether because of teams working remotely or an unavailable team lead. Such errors can, at the very least, lead to project delays. However, when all the necessary information is readily available in the online Gantt chart maker, everyone remains on the same page.
Increased flexibility
However well thought out a project schedule you have in place, unforeseen circumstances or unavailability of resources may necessitate revisions to your project plans. When all your project information is visible and accessible on a single page, and adjusting tasks is as straightforward as using the drag-and-drop functionality within the online Gantt chart, there's no need for concern.
What is a Gantt chart?
A Gantt chart serves as an essential project management tool designed to visually illustrate the schedule , timeline, and task dependencies within a project. Gantt charts also incorporate additional project specifics, including milestones, the critical path, and baselines, all of which provide a comprehensive overview of the project's progress. Teams employ Gantt charts to maintain project schedules, pinpoint bottlenecks, and monitor task overlaps.
History of Gantt chart
Gantt charts have played a pivotal role in managing numerous significant projects throughout history. They not only facilitated the control of weapon production during World War I but also contributed to the construction of the world-renowned Hoover Dam. In their initial introduction, Gantt charts had to be meticulously crafted on paper. They were often redrawn multiple times to accommodate even minor adjustments. Project managers then transitioned to using pieces of paper or blocks to represent Gantt charts, allowing for flexibility in adjustments. Fast-forward to the present, and we now have a multitude of dedicated software options, including free online Gantt chart makers, that simplify the creation and management of Gantt charts.
Who uses a Gantt chart?
The original purpose of Gantt charts was to facilitate the planning of production activities within factories. Today, they are utilized by organizations of all sizes and across diverse industries. Online Gantt charts have become an indispensable component of project management, much like how project management is employed in numerous verticals. Regarding those who use Gantt charts regularly, there is a prevailing misconception that these tools are solely beneficial for managers. However, the reality is that every stakeholder involved can derive value from Gantt charts. From department heads who employ them to allocate and monitor work to mid-level or entry-level employees who utilize them for progress tracking and updates, Gantt charts prove to be an asset for all roles.
Importance of Gantt charts
Here are some important reasons why Gantt charts are an important part of your project management process:
Planning powerhouse
During the planning stage, every facet of your project can appear daunting. This is precisely where a free Gantt chart maker proves invaluable. It effortlessly enables you to allocate time to all components of your project while ensuring adherence to the established timeline.
Visual aid
A visual representation of your project as a unit of time, such as a Gantt chart, helps you to get an overview of your entire project at a glance. This is incredibly useful for making adjustments and tracking real-time progress.
Relationship manager
The dependencies between your various work items can significantly affect the deadlines and progress of your entire project. It's not possible to track these inter-dependencies manually. Online Gantt charts are a huge help here.
How to make a Gantt chart
Gantt charts can be easily created using any online project management software available in the market today. Here's how to make a Gantt chart:
Define your work
In order to create a Gantt chart online, the initial step is to clearly define the scope and objectives of your project. This process also involves setting up resource limits.
Break it down
Once the objective has been established, you can break it down into task lists, tasks and sub tasks required to achieve the set goal.
Assign work
Allocate the broken down work items to the most capable resources based on their skill set and availability.
Allocate time
This is where you estimate and allocate the time for all your tasks, keeping in mind the start and end dates of your project.
Define dependencies
Once you set time for your work, the Gantt chart can be visualized. Now you can define the dependencies between the various work items so that the timeline gets adjusted accordingly.
Gantt chart templates
In various Gantt chart software, you can easily access a plethora of Gantt chart templates. These templates are adaptable to your organization's type, project scope, objectives, and industry vertical, and many of them can be found online. Additionally, you have the option to create a Gantt chart in Excel for free which provides several free Gantt chart templates. Among these templates, the most common ones are industry-specific, offering pre-populated sample work items tailored to a particular field.
What is a Gantt chart maker?
A Gantt chart maker is a valuable online tool that assists you in crafting and tailoring Gantt charts for your projects. This tool provides the functionality for users to input their project timeline, schedule, and task dependencies. Beyond project tracking, Gantt charts also prove beneficial for task and resource management. Furthermore, users can conveniently download the Gantt chart in a readable format.
Benefits of using Gantt Chart Creator
- A quick overview of project status
- Performs real-time progress tracking
- Aids in optimum resource allocation
- Can be used to avoid schedule clashes by working with interdependencies
- Helps in identifying bottlenecks and delays
- Accommodate risks and changes in real-time
Disadvantages of a Gantt chart
- Scaling may become complicated when it comes to larger projects
- Physical Gantt charts are quite impossible to work with as they cannot accommodate any changes
- May require a lot of time to set up
- Regular updating is required to reflect progress
- Bars do not represent the effort put into the task
Advantages of using online Gantt charts
Effortless Collaboration: A Gantt chart tool comes equipped with features that support the modern 'work from anywhere' model, making collaboration a breeze.
- Adaptable to Change: An online Gantt chart maker is adept at smartly analyzing changes and seamlessly editing the plan as needed.
- Managing Dependencies: Representing and working with the interdependencies among various work items in an online Gantt chart is a straightforward process.
- Task Management: An online Gantt chart is not just a planner but also functions as an efficient everyday task management tool.
- Identifying and Addressing Delays: With a free Gantt chart maker, it's easy to spot bottlenecks that may be impeding your project progress and take corrective actions.
Alternatives of Gantt charts
- 01
PERT chart
The Program Evaluation Review Technique involves a PERT chart where the dependencies between various activities are represented using a network diagram. The scope of a project is mapped and the critical path is calculated using this chart.
- 02
Kanban boards
These are virtual boards that track lifecycle of your work items from start to finish. It's easy to track and work with, and helps identify bottlenecks by tracking the number of tasks under each status.
- 03
Checklists
For simple projects, you can create check lists to simply track the open and closed tasks in your project. This can also be used to record the start and end dates, although updating them can be a hassle. This may not work so well for more complex projects.
- 04
Flowcharts
A flowchart that can be easily drawn to map the workflow of your tasks is another way to manage your project timeline and progress. From start to finish, the various stages and activities involved can be planned and tracked using this.
- 05
Calendar
A shared calendar is another efficient tool that can help. It provides an accurate representation of your project as a unit of time—similar to how you use a Gantt chart online. Deadlines, resources and meetings can also be tracked using them.
What is the price of an online Gantt chart maker?
Online Gantt chart makers come in a variety of price points, catering to different needs and business requirements. To choose the right one for your organization, consider key factors such as essential features, software type, user-friendliness, onboarding process, customer reviews, market presence, support quality, integration capabilities, and per-user pricing.
Among the affordable options is Zoho Projects, which offers a starting price of just $5/user/month. This budget-friendly choice doesn't compromise on features and provides a robust set of tools. To get a feel of the platform, take advantage of the 10-day free trial. For more details on Zoho Projects' pricing plans, you can refer to the dedicated page outlining the pricing breakdown of different available plans.
Learn moreWhy is Zoho Projects the best free Gantt chart maker?
Zoho Projects offers an intuitive online Gantt chart maker that's not only user-friendly but also packed with essential features for project managers. With critical path analysis, baseline comparison, chart scaling, and support for four types of task dependencies, it's a must-have tool for efficient project management. What sets Zoho Projects apart is its free Gantt chart maker, which doubles as a comprehensive task management module. From planning to task editing, it seamlessly integrates with the Gantt chart viewer. Additionally, Zoho Projects provides two Gantt chart types: chronological and milestone, along with a global project timeline Gantt. Are you ready to explore Zoho Projects? Sign up now to experience our feature-rich free Gantt chart online tool!
Watch Video