Rated by the finest
Leading project management software among customers and critics.
Leading project management software among customers and critics.
Zoho Projects offers an online Gantt chart tool that makes project scheduling easier with a visual representation of milestones, task lists, tasks, and the dependencies between them. You can either view the tasks sorted by the milestones as the Milestone Gantt or by the order of occurrence as the Chronology Gantt. You can also add new tasks, set dependencies, and adjust start and finish dates all within the Gantt chart software online, making your project planning experience visual and effortless. Here are some of our key features:
With Zoho Projects, create Gantt charts that support all the four types of task dependencies like Finish to Start, Start to Start, Start to Finish, and Finish to Finish. In our online Gantt software, just drag and drop between task bars to define relationships between them. The clear color distinction helps you quickly get an idea of tasks that are overdue, the status of a task, completed tasks, dependency type, and so on.

You can now quickly add a new task right from within the Gantt chart tool. More details like the task description, owner, start, and dates can be defined in the pop up that appears. The inserted tasks get added at the same level as tasks or subtasks in our online Gantt.
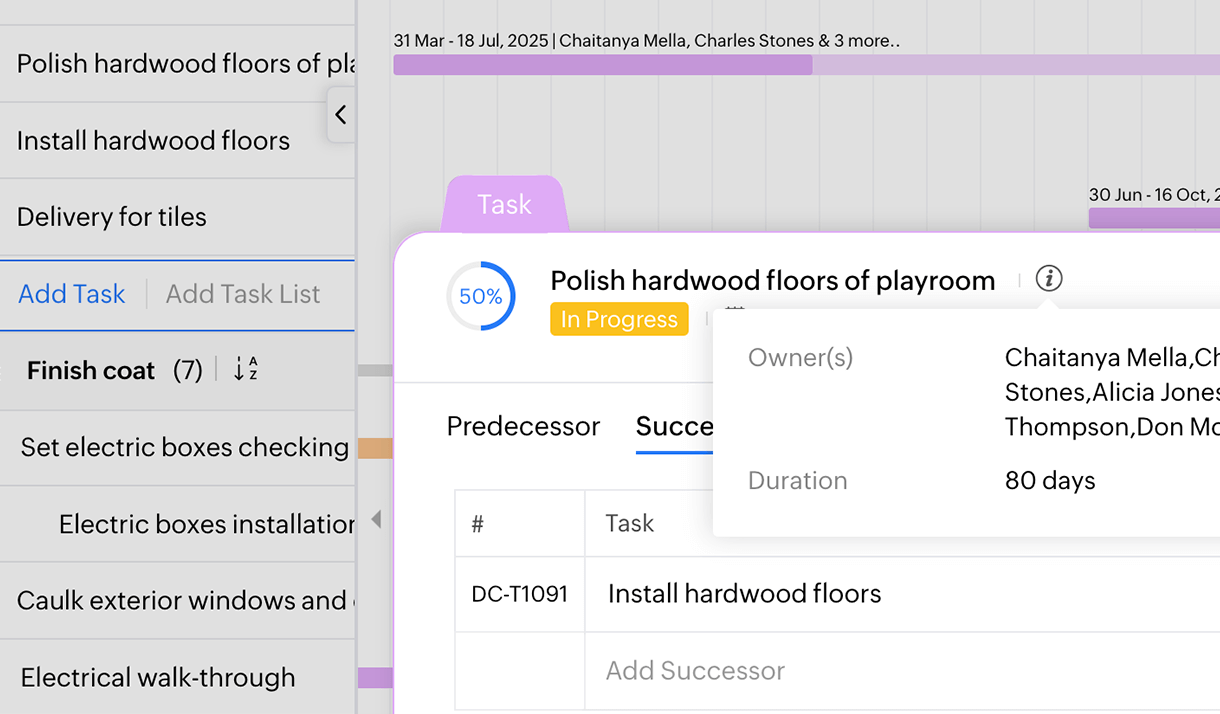
Hovering over the task name displays all additional information like the owner, completion percentage, start and end dates, and a list of all predecessors and successors. You can directly create new dependencies in our online Gantt chart tool or edit existing dependencies.
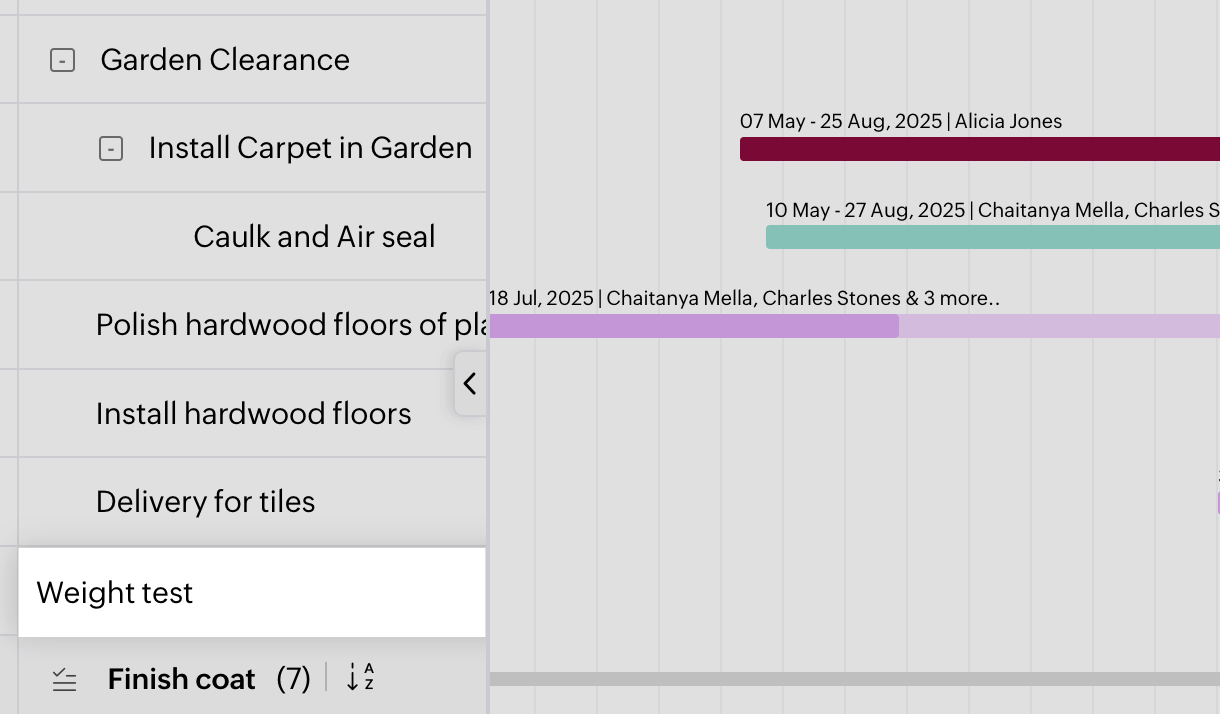
If you’d like a copy of the Gantt chart to be sent via mail or used in presentations, you can do so by exporting the chart as a PDF. You can also print the chart as a hard copy. The Expand/Collapse task lists option lets you choose between an exhaustive view of tasks under each task list or a view of only the task list names.

The chart can be rescaled to accommodate more Gantt bars or maximized to have a clear view of your online Gantt chart software. Rescale the Gantt chart with the Zoom in (+) and out (-) icons.

Gantt chart software is a visual representation of the project timeline or schedule with emphasis given to depicting the relationship between your various work items. A Gantt chart displays these relationships or dependencies, making it easier to plan your project as well as to implement changes and track progress in real-time. The best Gantt software will facilitate you to manage and work with different types of dependencies.
Some of the key features present in Gantt software include:
Online Gantt chart software is the primary tool used for project planning and project scheduling. Named after its inventor Henry Gantt, the earlier versions of it were drawn by hand and had to undergo many iterations to accommodate changes. Today there are several Gantt chart tools are available.
Gantt chart software is predominantly of use to anyone practicing the waterfall-based project management model. It has widespread functions across varying industries of different sizes. Here are some of the top industries that use a Gantt chart tool:
To plan, schedule and keep track of building plans and construction work
Learn MoreTo track the progress of software projects in order to meet deadlines and identify risks
Learn MoreTo plan academic projects and lessons, and ensure collaboration between teachers and students
Learn MoreTo schedule and track multiple client projects while ensuring that all the stakeholders are kept in the loop
Learn MoreTo plan marketing campaigns, track their progress and identify pain points
Learn MoreDesktop Gantt chart software is suitable for small projects that don’t involve extensive planning, tracking and collaboration. Project planning involves an extensive amount of documentation that may need to be constantly edited during this stage. Tracking the schedules and keeping within deadlines also involves a lot of effort in terms of recalculating due dates to make up for any delay. Even if some leeway is given for possible risks, the more the number of work items involved, the higher the amount of effort needed to maintain the timeline. Projects that involve remote teams and constant inputs from stakeholders may also involve effective collaboration facilities in place. Hence, online Gantt chart software is a better fit for such projects.
Here's how to make Gantt charts using online Gantt software: