Choosing the right Survey Report that fits your need
If surveys are the exam, reports are the grade cards. They show you the data you collected and help you analyze it, which is obviously the whole point of why you conducted the survey.

Zoho Survey comes with real-time reports that get updated immediately. The minute a survey response is submitted, the responses can be viewed and reports generated.
Reports are designed to help you crunch the complicated survey data in your survey responses and simplify them into easily understandable charts and graphs. Effective reports can help you get to the right conclusion for your surveys.
Every survey builder tool has a dashboard where all the necessary information about the survey you created is visible at a quick glance—these include things like a survey launch date, recent responses, and the survey status. But analysing your survey data as a whole may require you to dig a little deeper. For that, we turn towards survey reports.
Fortunately, there are many kinds of reports that help you sort your data based on your surveying needs. Each one of these reports is designed to help you get a quick understanding of different data.

But before reports: Filters
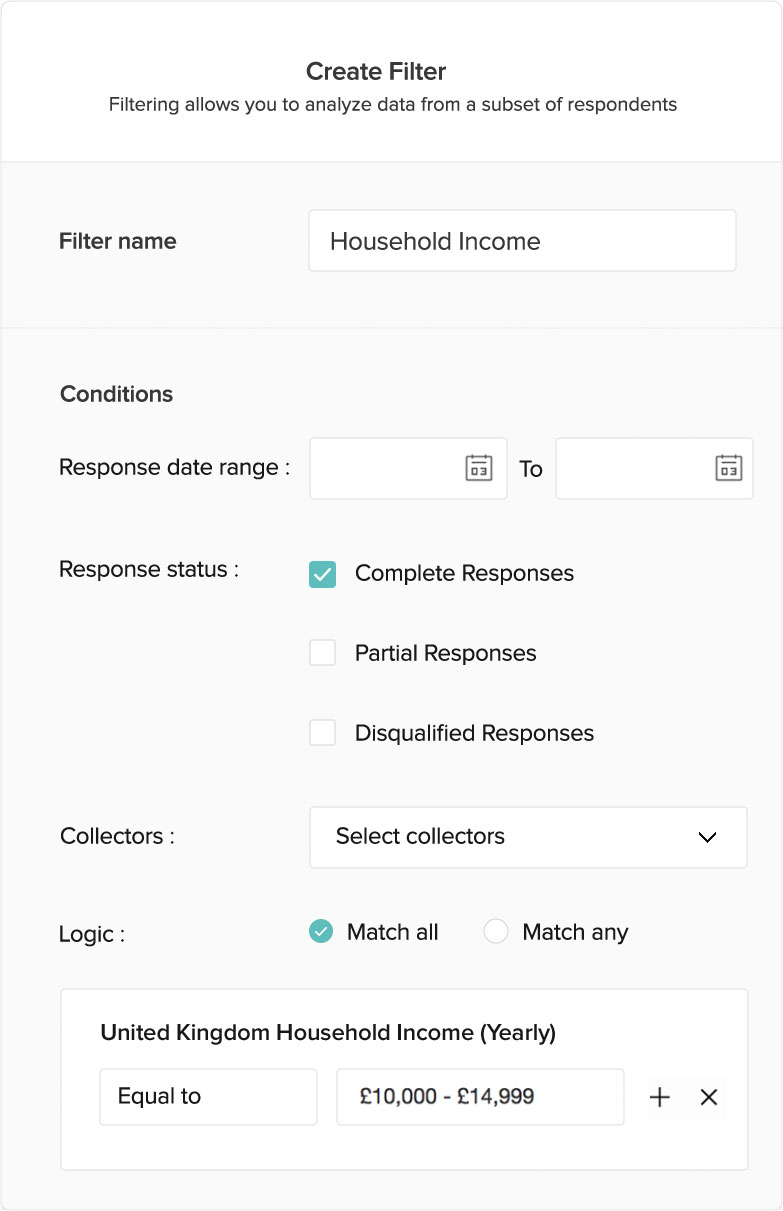
Filtering is a quick and powerful technique you can use in survey reports to sort responses and identify the different parts of your data.
When you apply a filter, you only see survey responses that meet the criteria specified in the filter. You can narrow results by a particular question's answer or custom criteria like time, completed or partial responses, email addresses, name and IP address, and more.
This can give you a good idea of who is answering your questions and whether responses collected across different sets of data were influenced by some other parameter.
You can also add multiple filters at one time for a deeper analysis of factors, such as sub-categories of your respondents.
For example :You can use a filter to see how unmarried men (filter 1) above 45 (filter 2) feel about kids and compare this to how married men of the same age who have or do not have kids feel about them. This will tell you if there is a deep correlation between marriage and how men feel about kids.
You can also add filters to cross tabs or use multiple filter groups in a single report for a deeper analysis of data.
Here's another example:You conduct a survey based on a new eyeliner you launched. While 65% of your survey respondents say they will buy an eyeliner, a deeper look tells us there is a big difference in the opinion of female shoppers who want to buy the product when compared with male shoppers.
One you have filtered people interested in your product, you can use a cross-tab report to see which gender you should target your marketing towards.
Let's say women represent 75% of the people interested in your product, whereas men represent the remaining 25%. So there is some variation in terms of gender when it comes to the people who want to buy your product- because of its nature So a smart surveyor will always target the questions towards the female shoppers, filter the responses and then analyse the data.
Note: To isolate responses using different filters such as gender, age, and income, make sure you have a question on each of these categories in the survey, and then apply filters based on the answers to these questions. Filters and responses go hand in hand: Apply the right filters on your report to get the best data.
Zoho Survey allows you to create as many filters as you like so you can pinpoint your reports and make them focus on data the right way.
Now let's look at the different types of reports available.
Cross-tab reports
A cross-tab report shows the relationship between two or more survey questions. It presents a side-by-side comparison of how people from different groups answered.
While the reports section of your survey builder provides a summary of all data collected, a cross-tab report lets you focus on two specific questions (and answers) so you can determine if there is a correlation between the answers.
Let's consider you survey people based on whether they like dogs or cats. But what you actually want to find out is: Does preferring dog or cat affect the person's other life choices as well? A cross-tab report can help you understand if a person's psychology is related to the animal they choose.
If you know you are going to cross-tab groups of respondents in your survey, make sure you place a forking question like "Do you like dogs or cats?" You can then apply logic on this question and then add the dog-specific or cat-specific questions.
Trend reports
Trend reports are used when you are looking to spot a pattern in data over time.
If you are dissecting responses based on how a person's or a group's opinion changes over time regarding an issue, this is the go-to report for you.
The specialty of a trend report is that you can 'run' them over long periods—this helps display monthly performance data so you can compare rises or dips over a period. These kinds of studies are called longitudinal studies in research circles.
Using trend reports helps you match updates to the way things influence your respondent's opinion. You can also compare the changes in your respondents' answers behavior over time, and compare them to real-world changes.
Custom reports
Custom reports allow you to edit and filter data, giving you the most relevant responses. You can sort through the data by choosing any parameter to filter by, allowing you to analyze the specific data you want.
For example, let's consider your goal is to determine the correlation between people who want to buy villas or apartments and their work city in an attempt to trace real estate buying patterns.
Here, it would be a good idea to come up with custom reports that filter the answers based on the different cities they choose as their work location—and then analyze the real estate they want to invest in, whether a villa or an apartment. Now it will be easier for you to find a correlation between cities and types of real estate that have been most invested in.
With Zoho Survey, you can share all of these reports with your colleagues, friends, or whomever you like, which will make analyzing answers and brainstorming solutions easier. You can also export reports into Excel, CSV, PDF and Zoho Sheets.
Related Articles
Five response bias to avoid in your survey
Humans are rather interesting creatures. (...)
Sangeeta Bose Oct 16, 2019
7 easy steps to create and distribute a survey online
Creating a survey is as much of an art as it is a science. (...)
Sangeeta Bose Oct 16, 2019
Survey sampling errors you can't afford to make
Surveys and people: the former can't work without the latter. (...)
Sangeeta Bose Oct 16, 2019