- HOME
- A beginner's guide to building an interactive spreadsheet dashboard
A beginner's guide to building an interactive spreadsheet dashboard
- Last Updated : July 3, 2025
- 786 Views
- 3 Min Read
Why use spreadsheet dashboards?
Having rows and columns of data in your spreadsheet is of little use if you can't make sense out of it. A spreadsheet dashboard is a visual summary of what really matters—whether your sales performance is increasing, whether your team is hitting sales targets, etc. Building dashboards not only brings clarity but also facilitates improved collaboration, communication, and teamwork.
The dashboard that is being showcased in this blog is built using Zoho Sheet, a cloud-based spreadsheet that supports real-time collaboration, 400+ built-in functions, and AI-powered data cleaning, formatting, and refining suggestions.
Setting up your data
Here, I'll show you the steps to build a simple sales dashboard. If your data is populated in the spreadsheet already, you're good to go. If not, get started by importing data using one of these methods:
- Copy-paste data
- Scan data from printed copies using the Data from picture feature
- Import data from external sources (Excel files, .csv, .tsv and more)
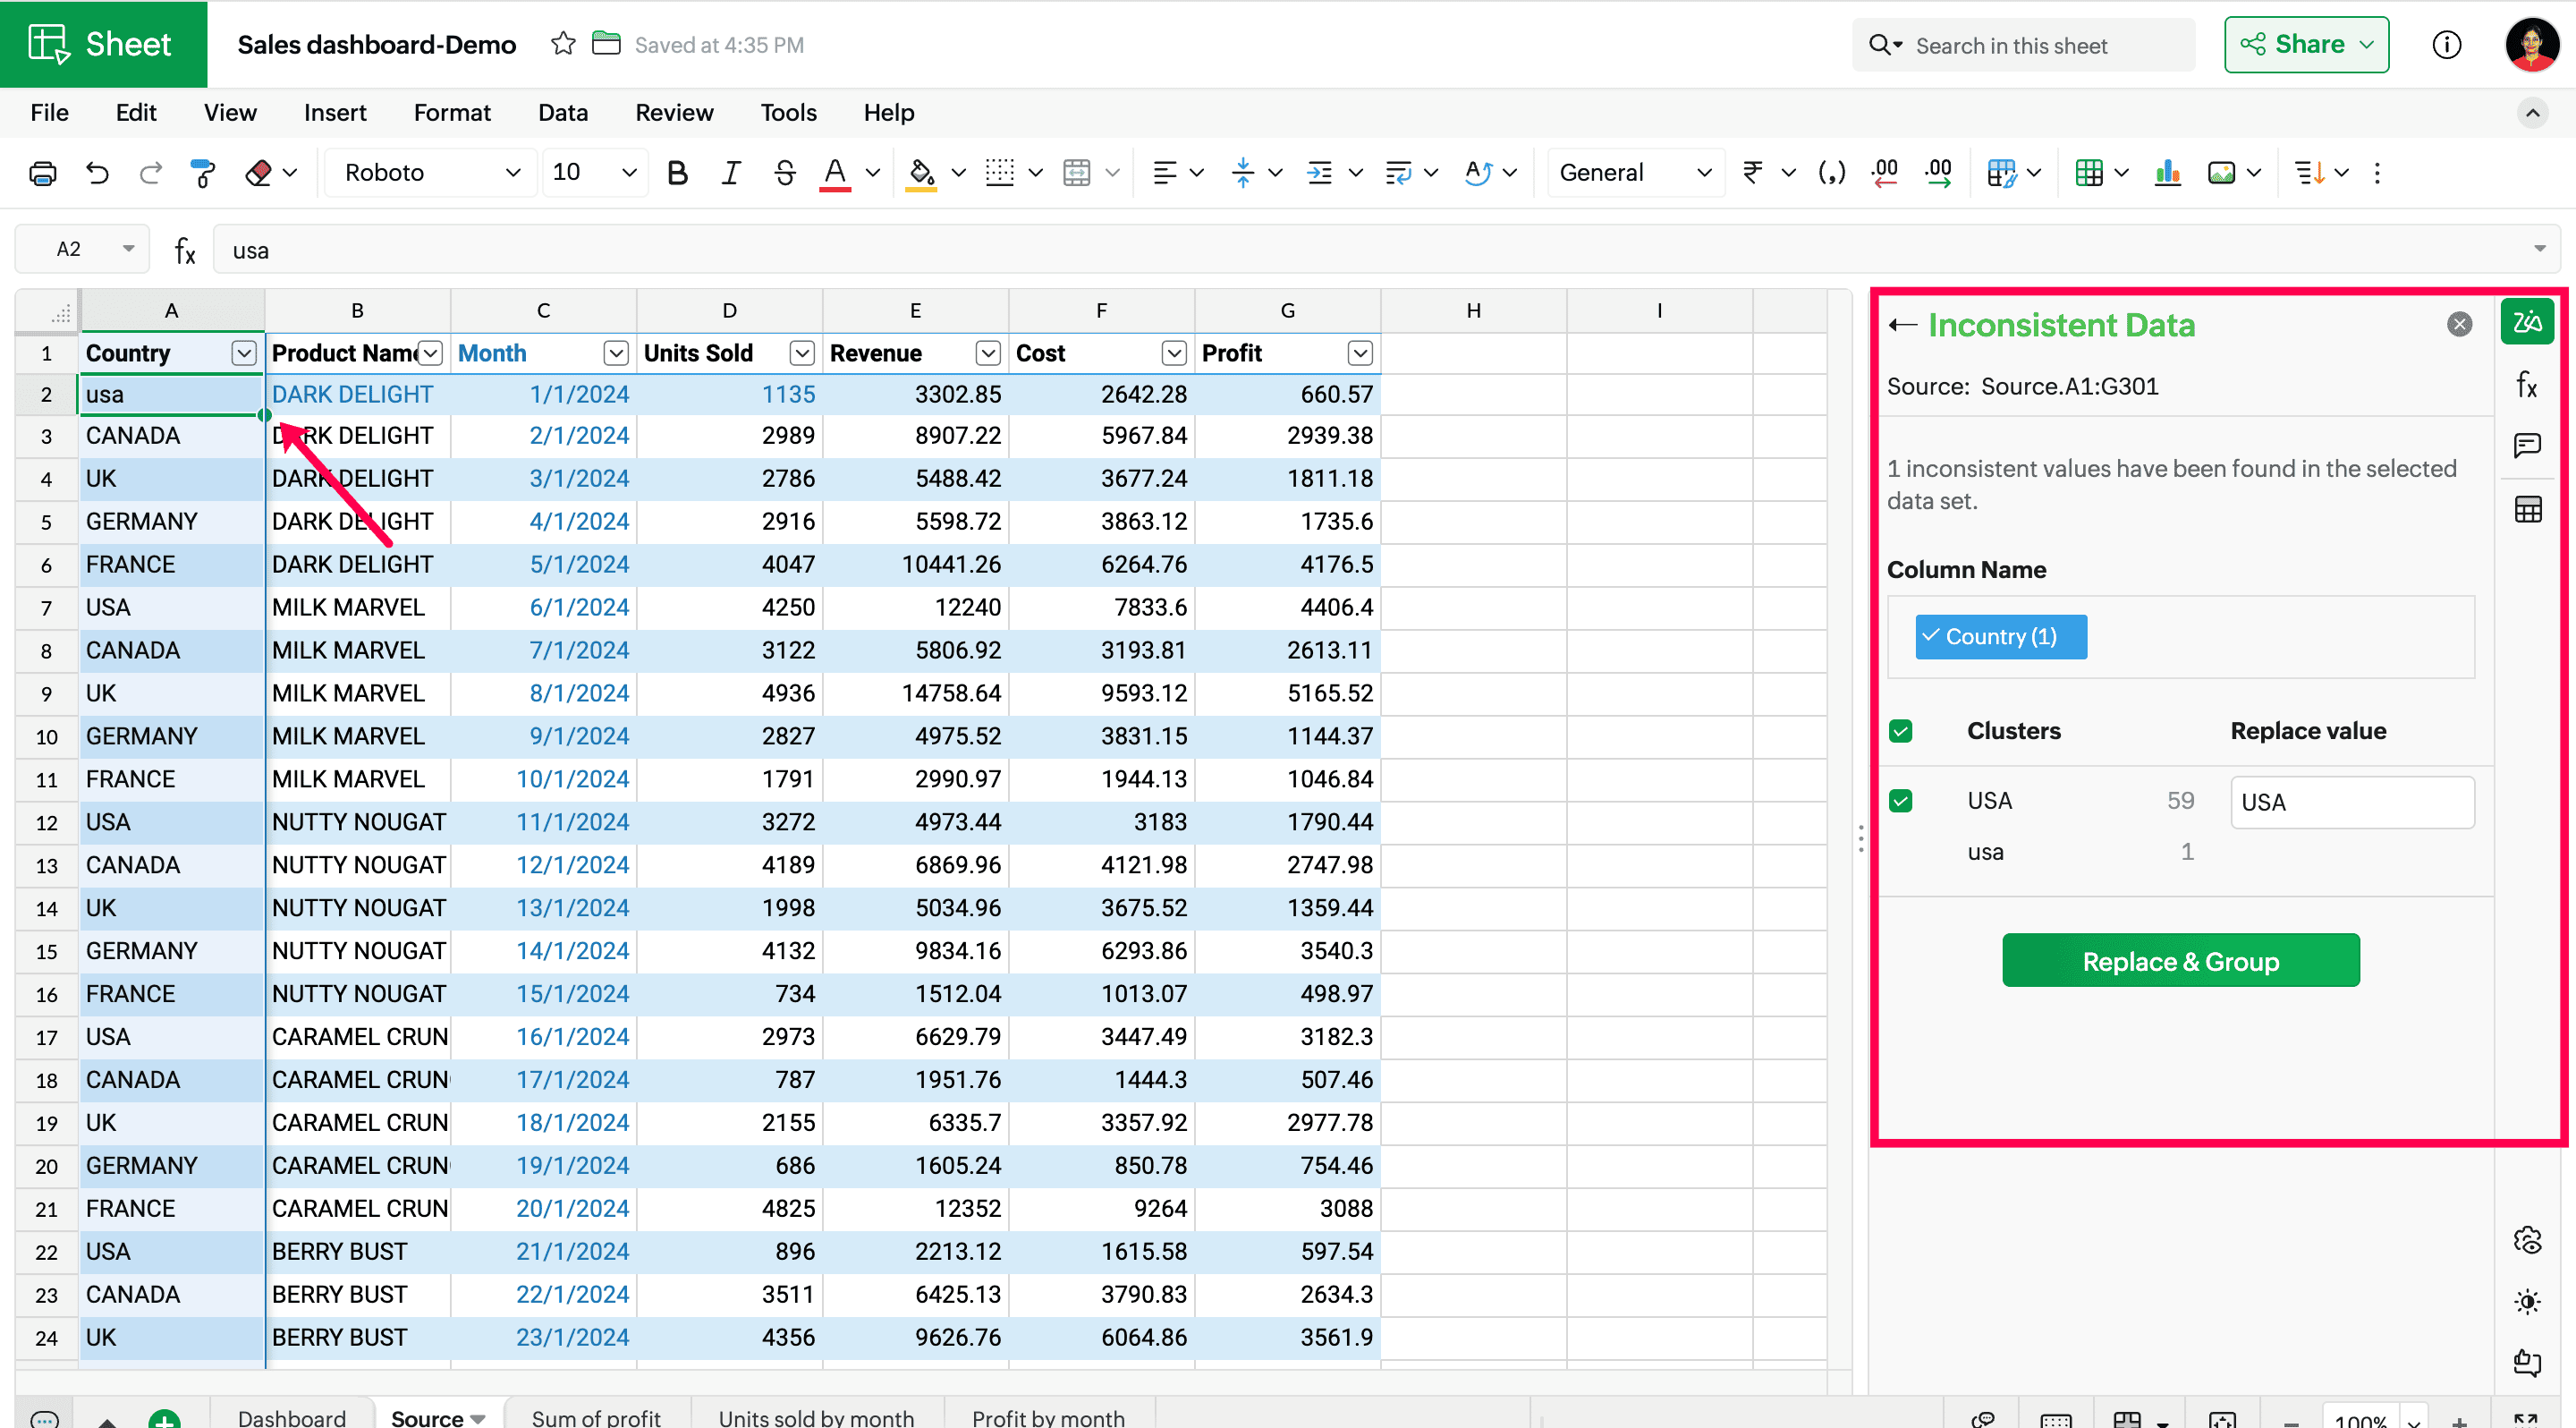
Before we use this data to build the dashboard, it's important to ensure the data is clean and organized.
Tip: AI-powered data cleaning suggestions help you quickly find duplicates, inconsistencies, and fix them.
Setting up your sheet tabs
Now that your data is clean, let's organize it. Keeping all of your data in a single sheet will quickly become overwhelming, especially if your data grows over time. Instead, let's break it up and organize data in separate sheet tabs—one each for the source data, formatted data, and the dashboard. Maintaining dedicated sheet tabs allows you and your collaborators to easily manage, scale, and understand data.
The sales dashboard spreadsheet I'm building will comprise the following sheets:
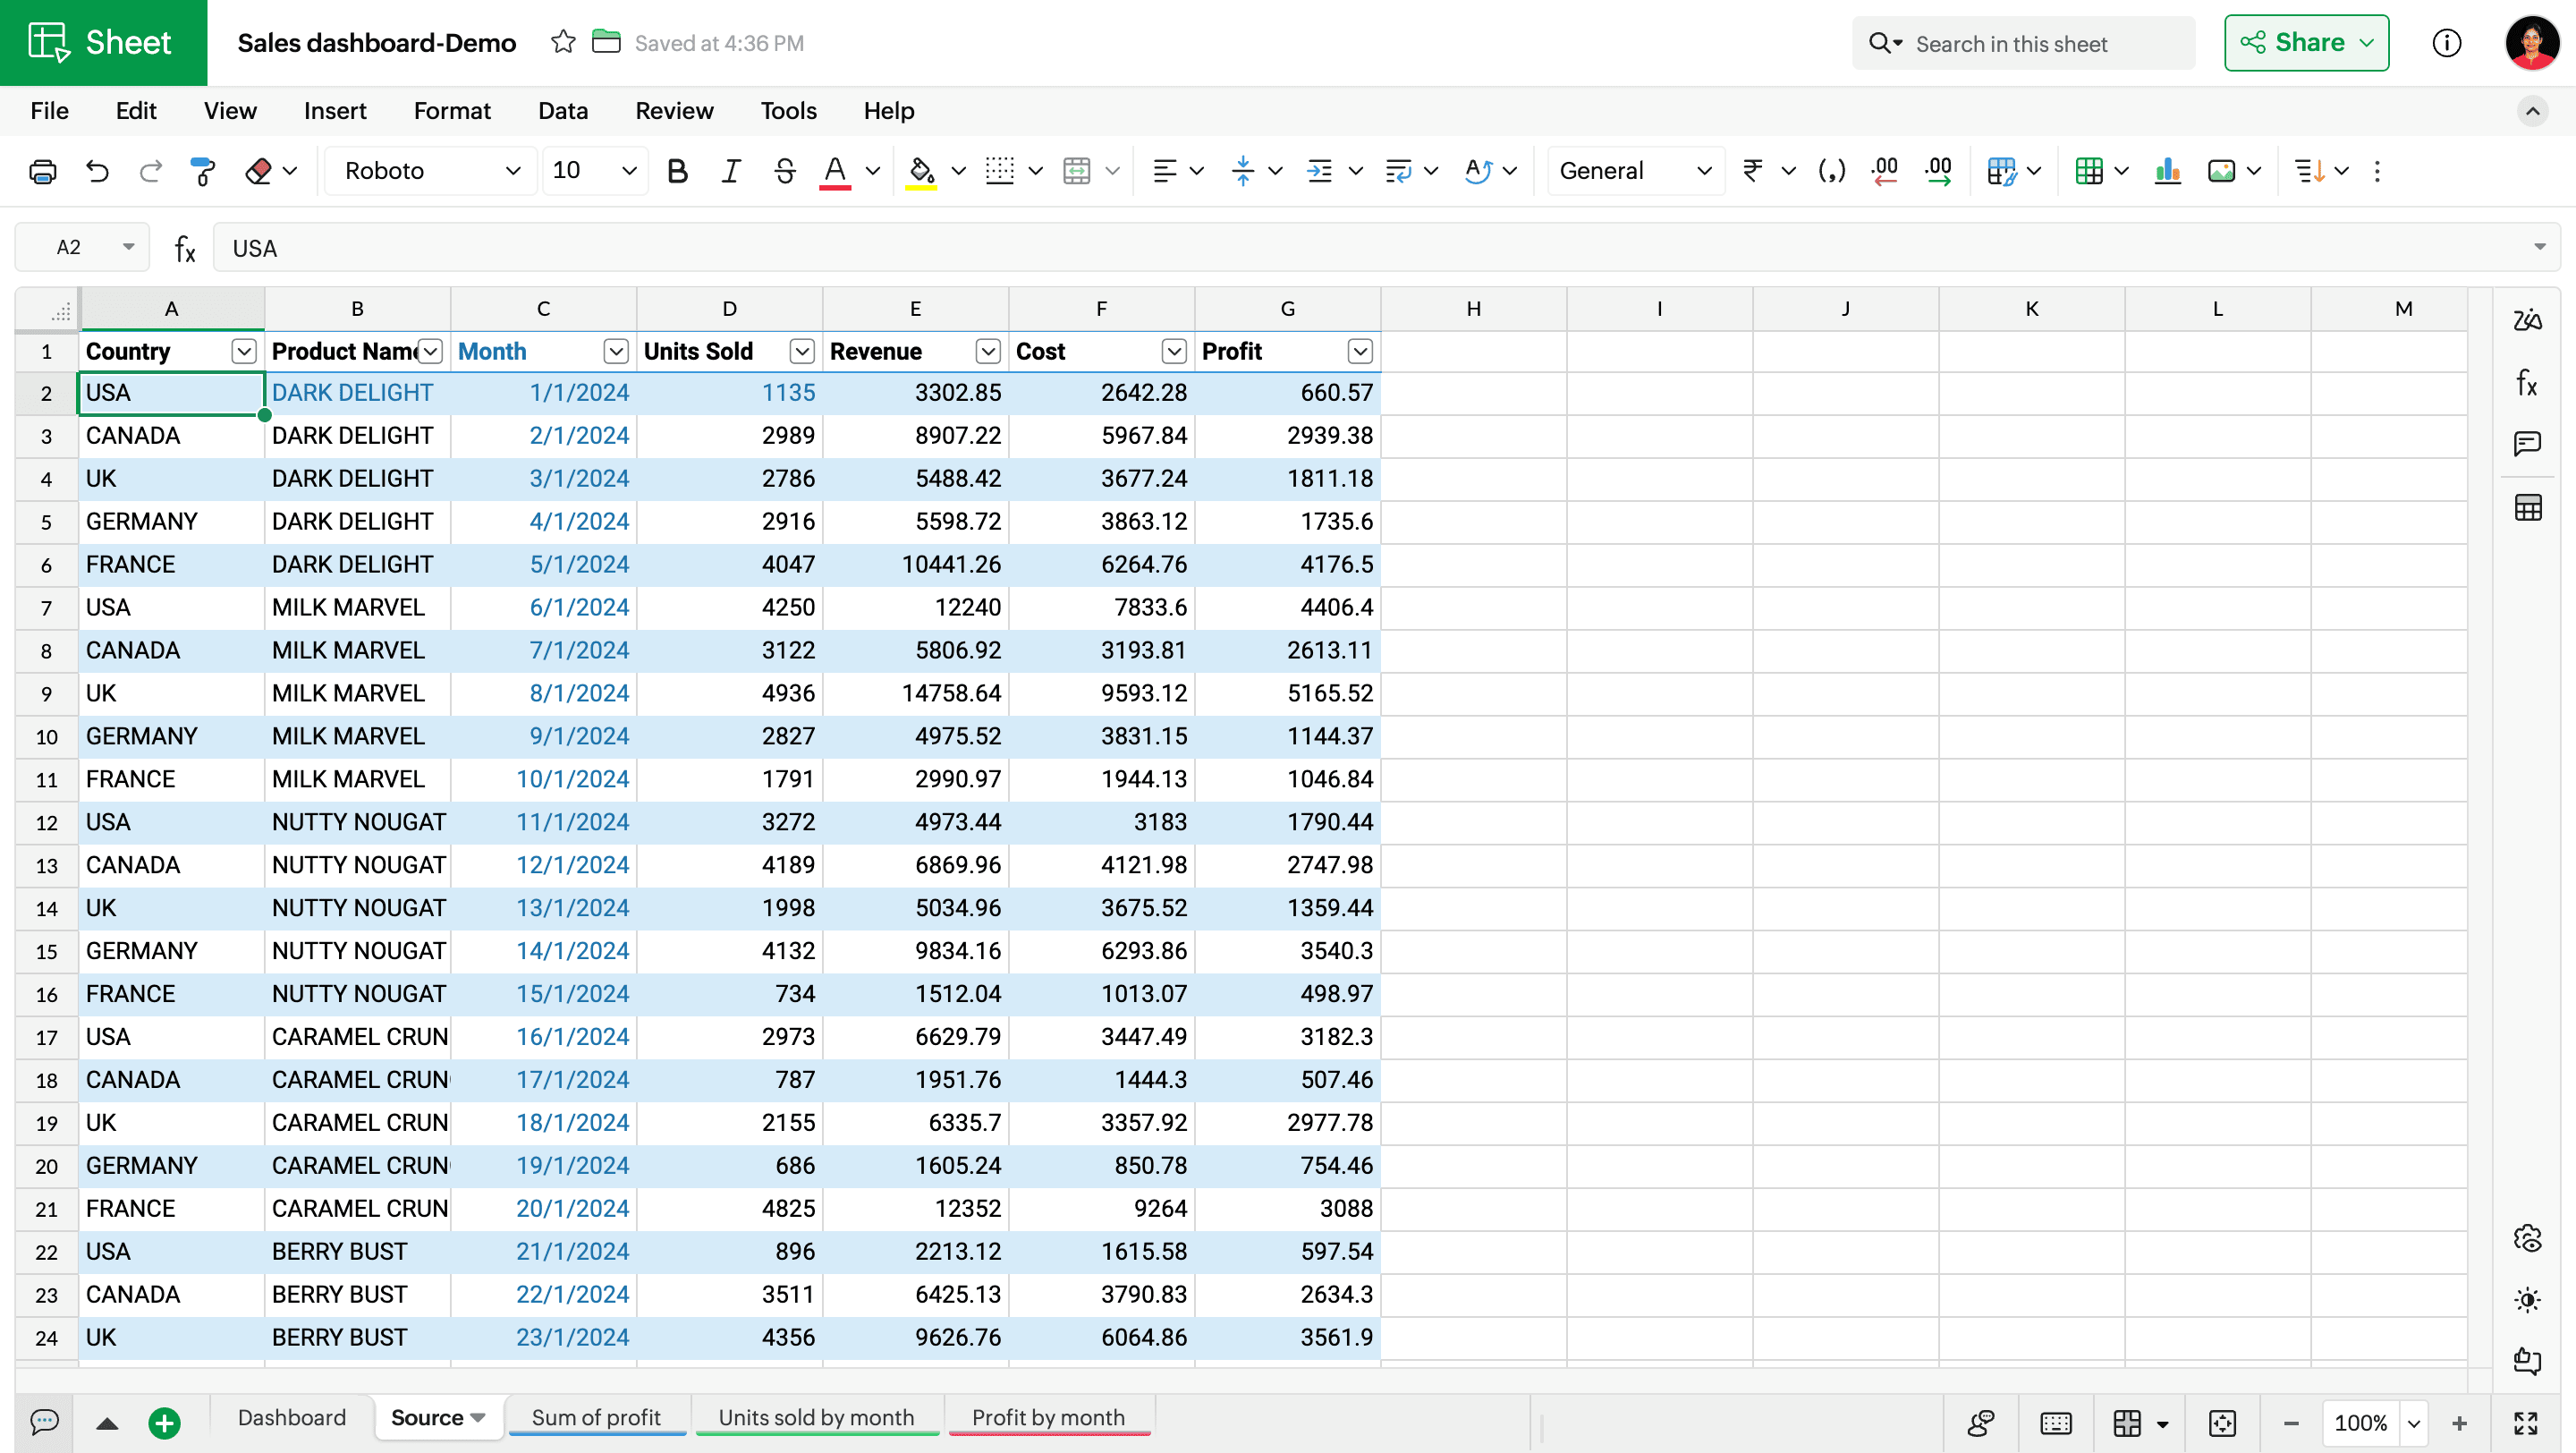
• Source data: Let's keep the overall sales data in a separate sheet, untouched except for any updates.
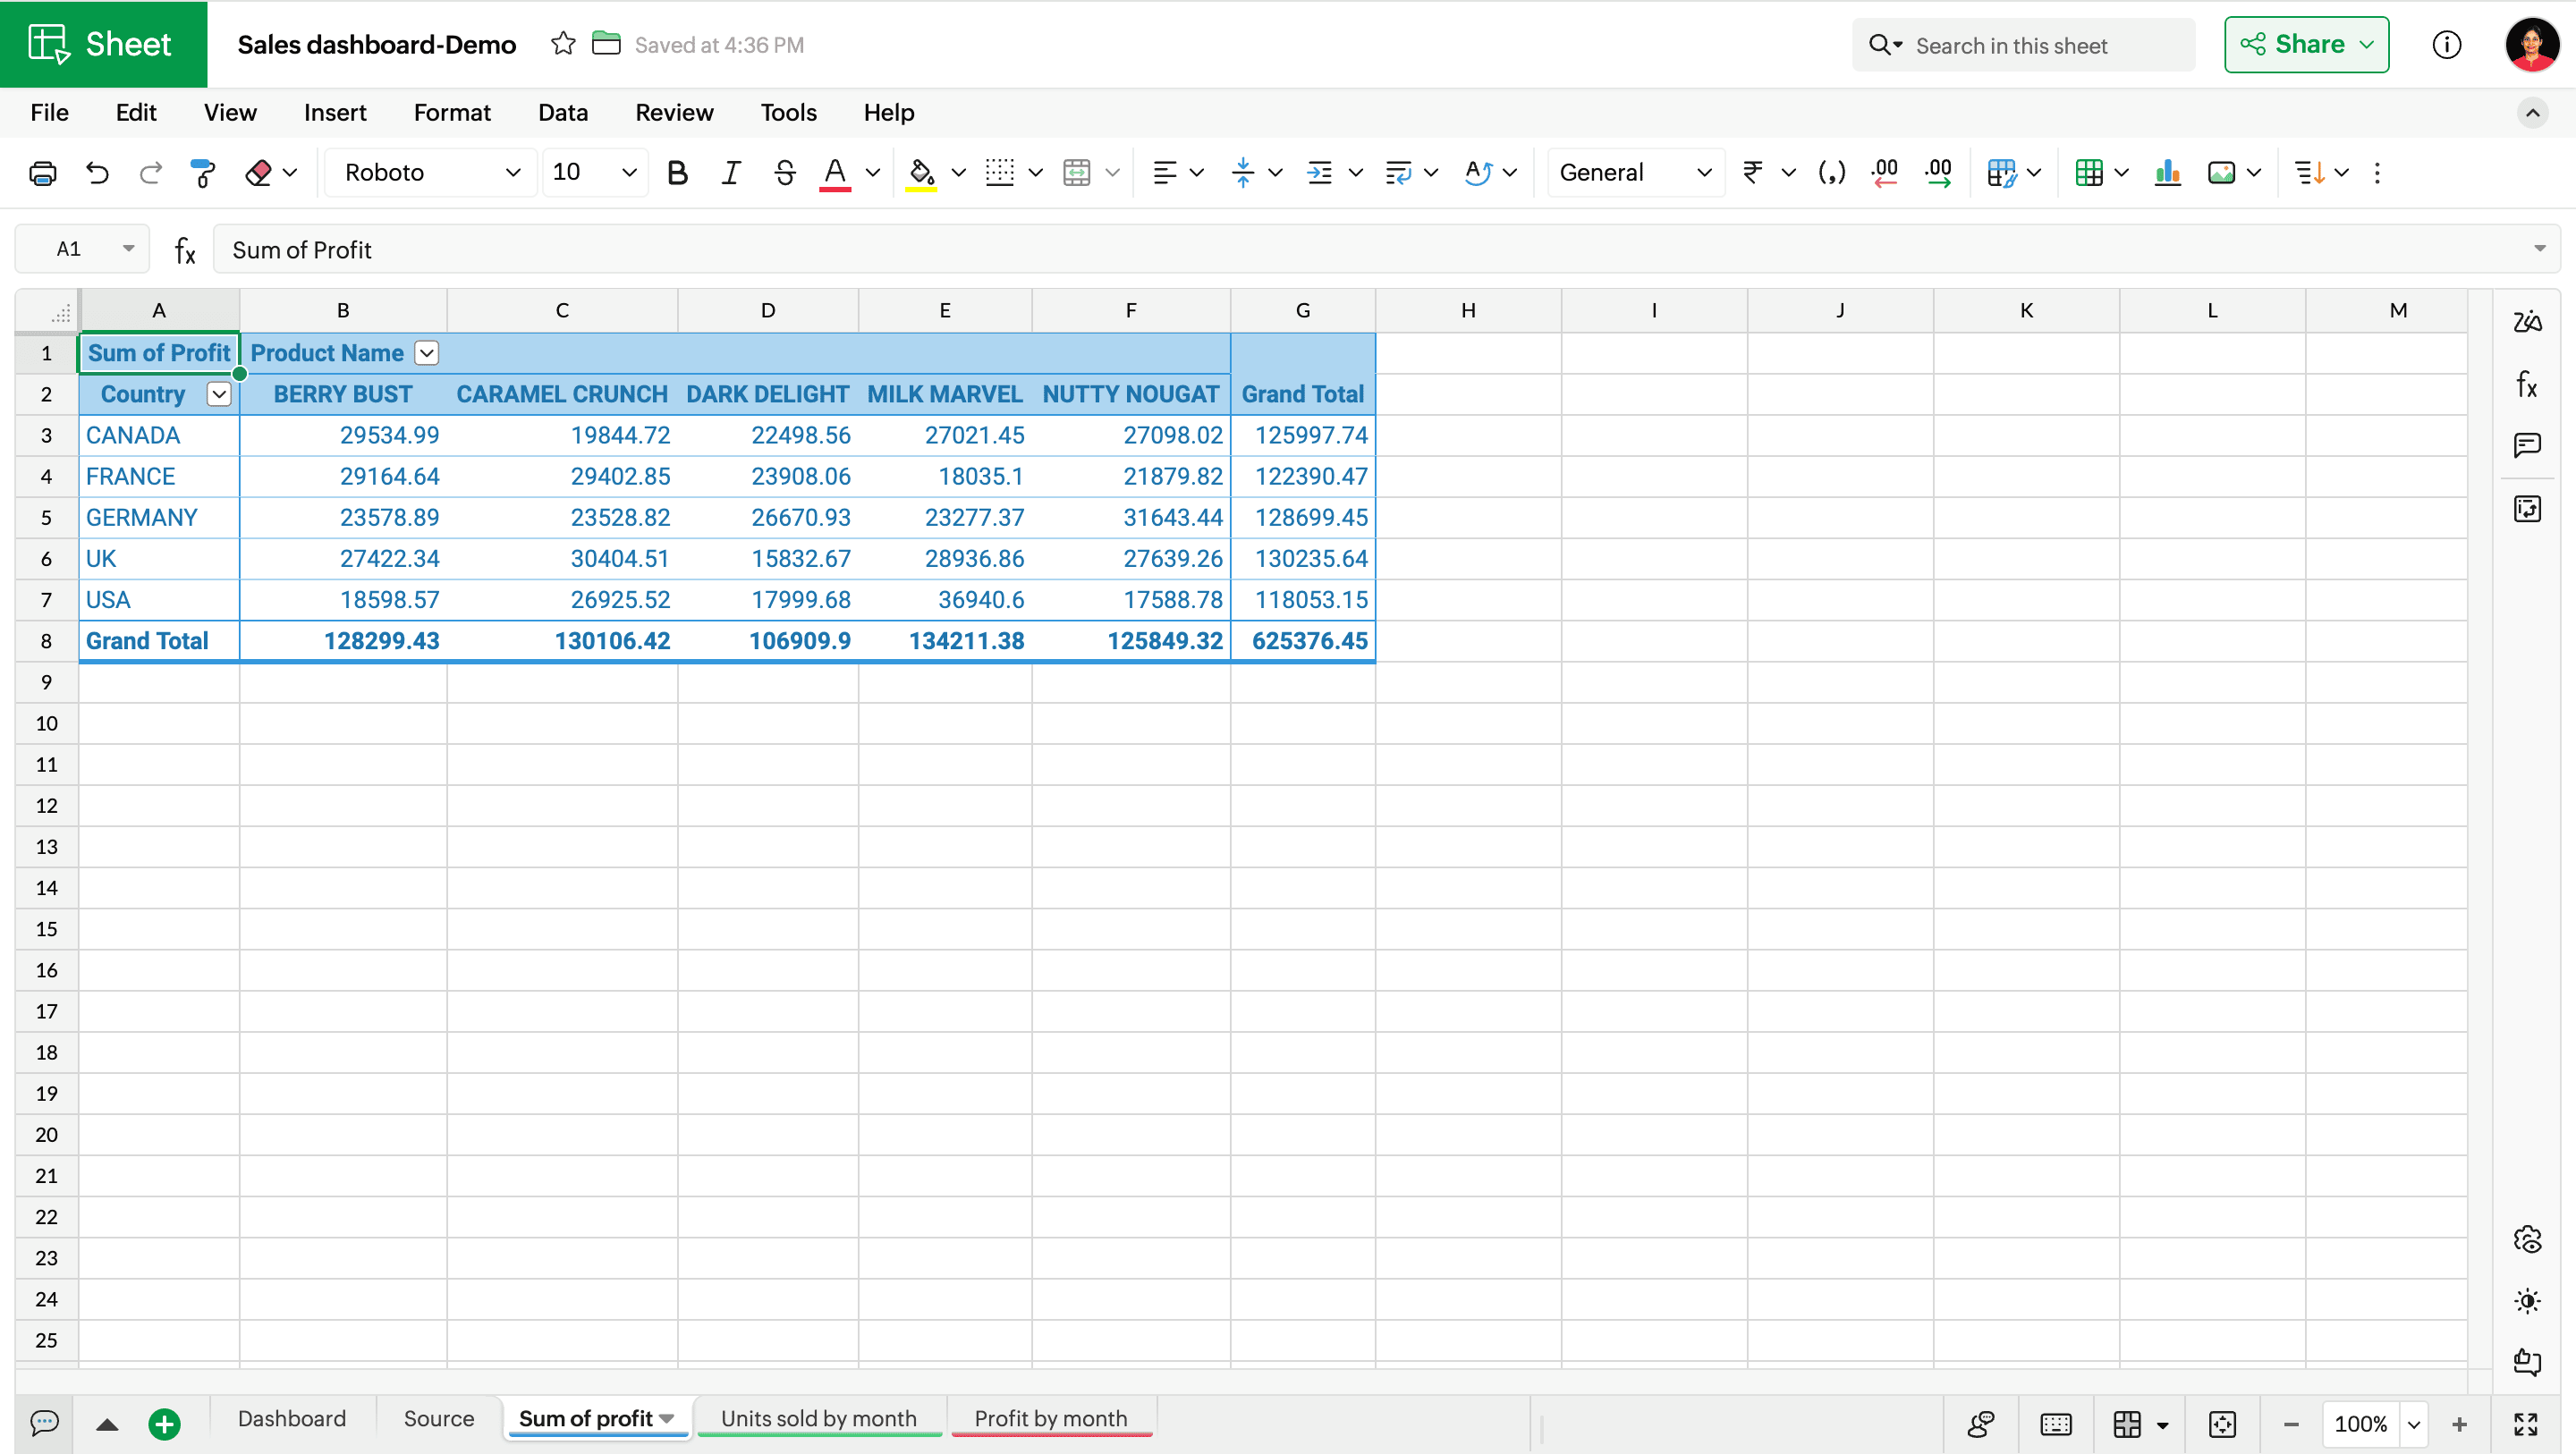
Sum of profit: This sheet contains a pivot table that summarizes the overall profit across each country and chocolate type.
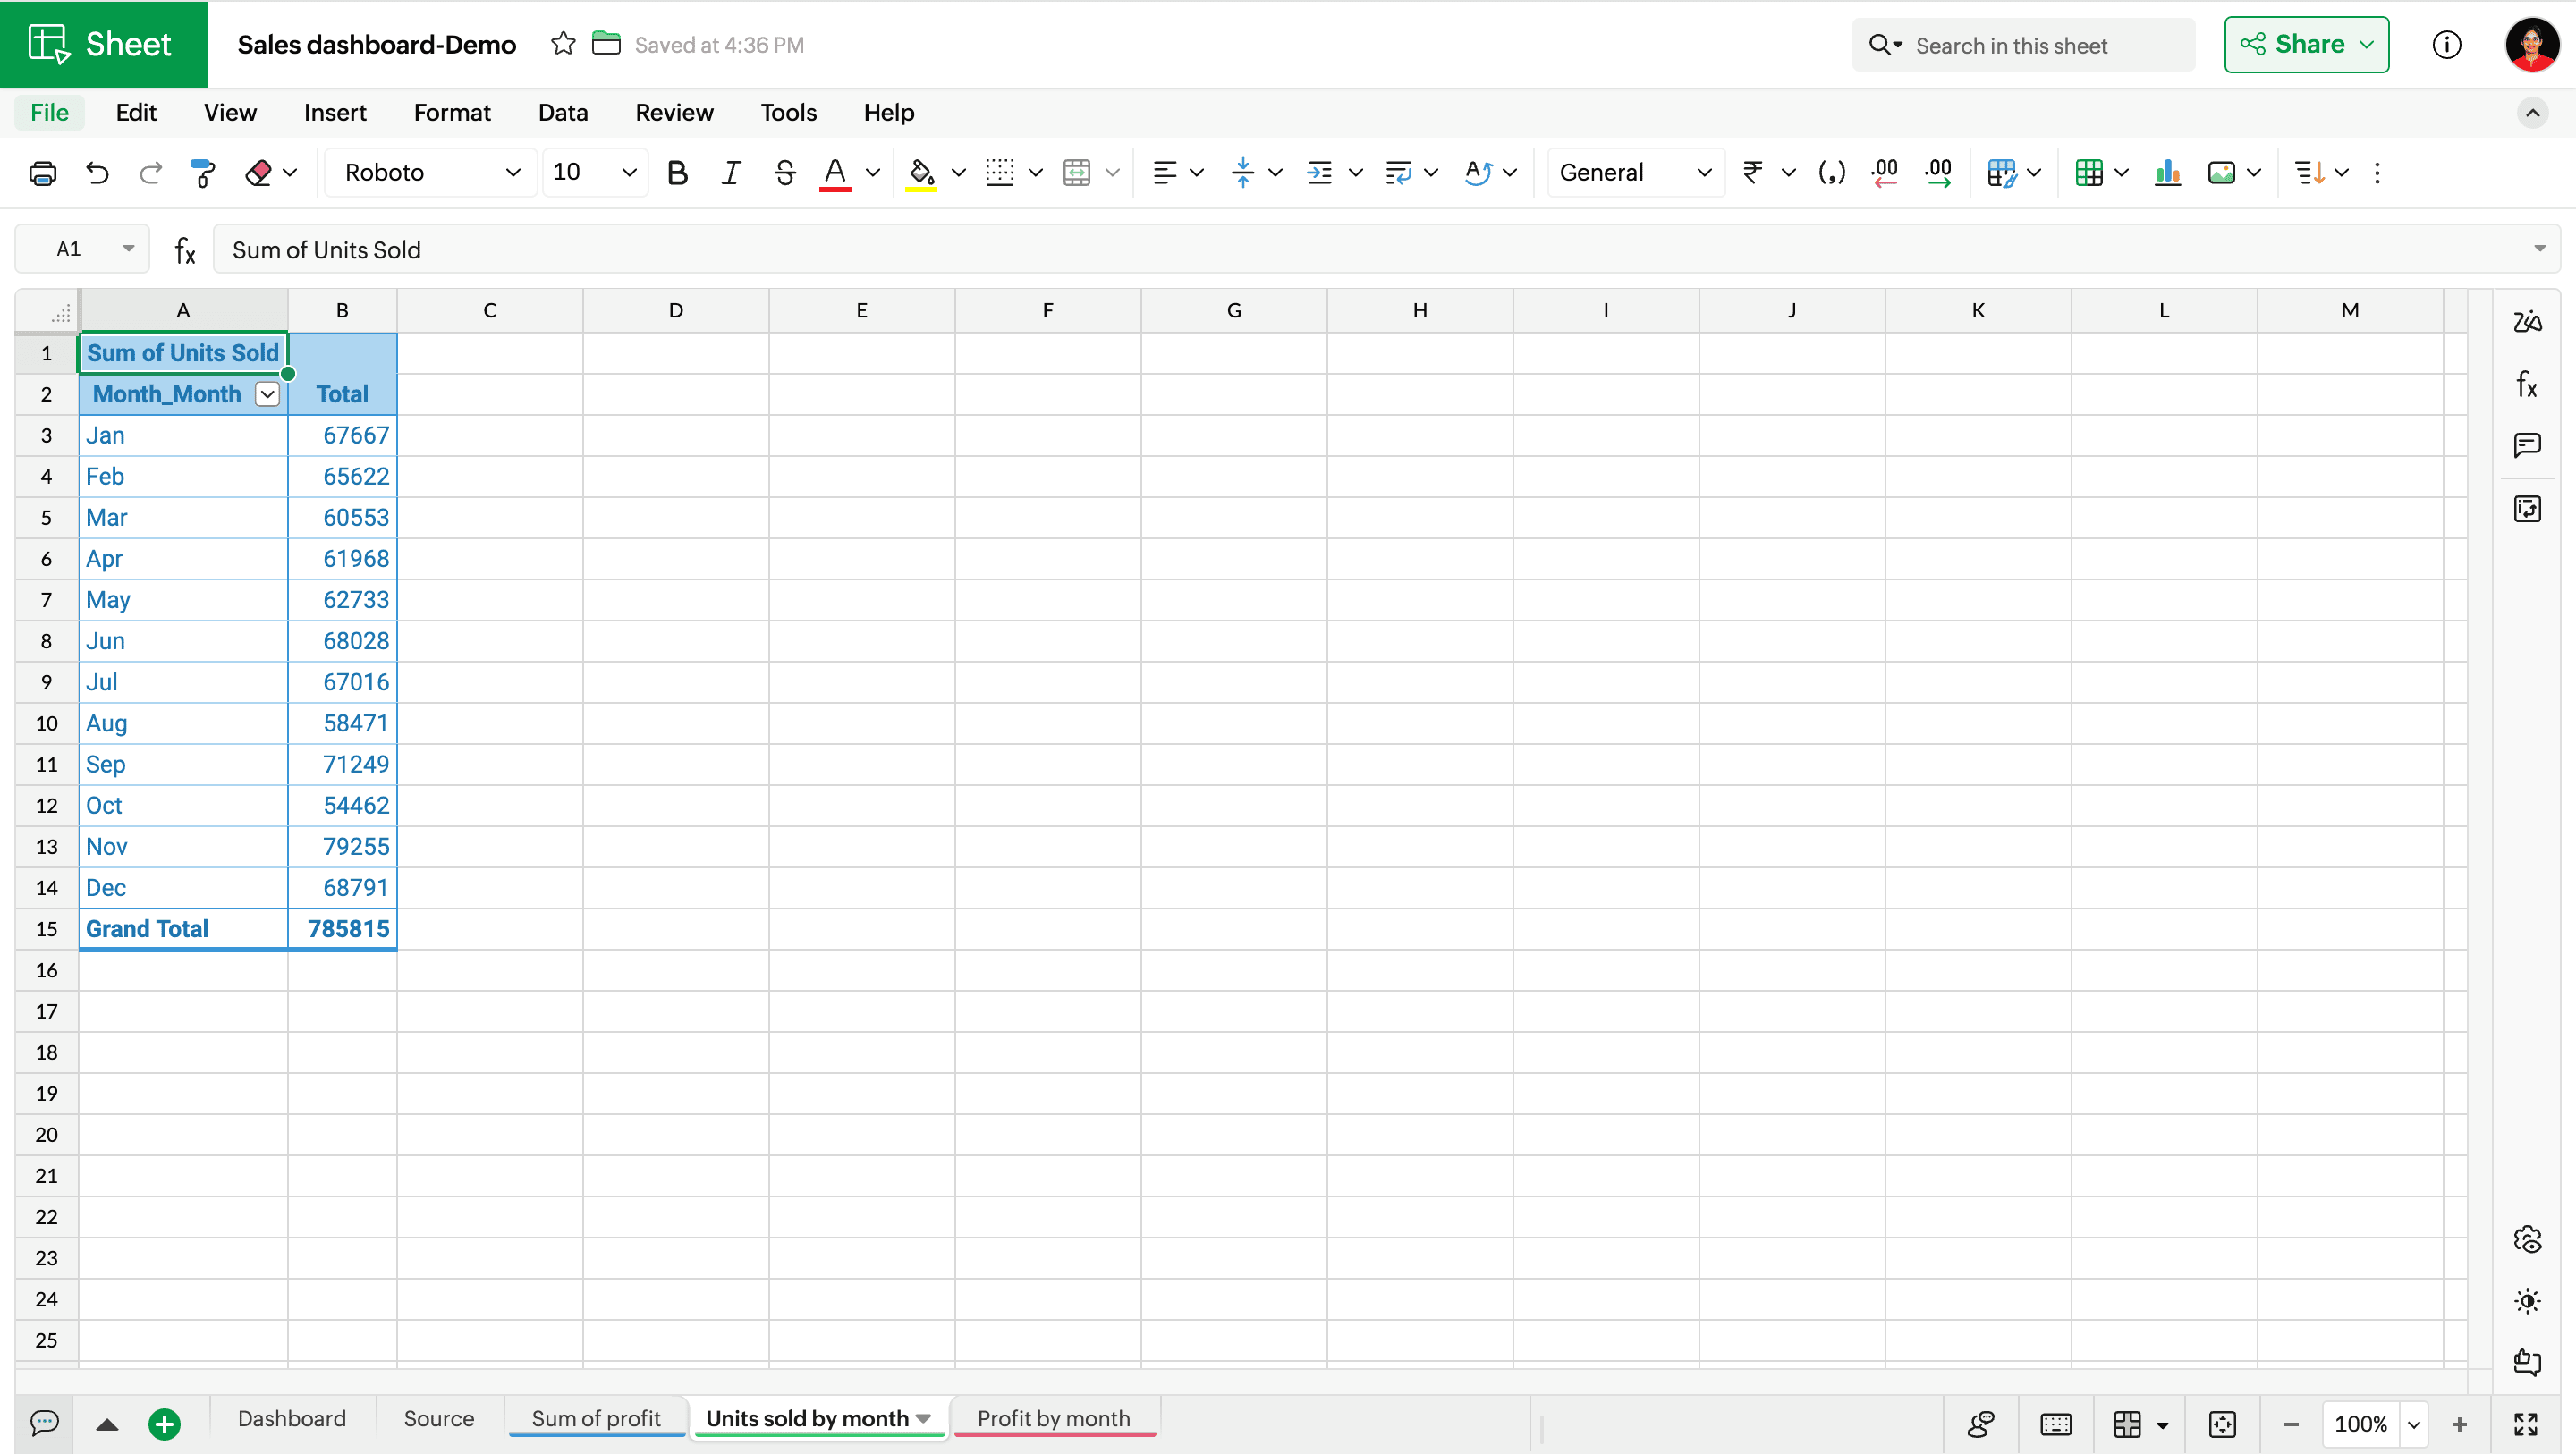
Units sold by month: This sheet contains a pivot table that summarizes the total number of chocolates sold each month.
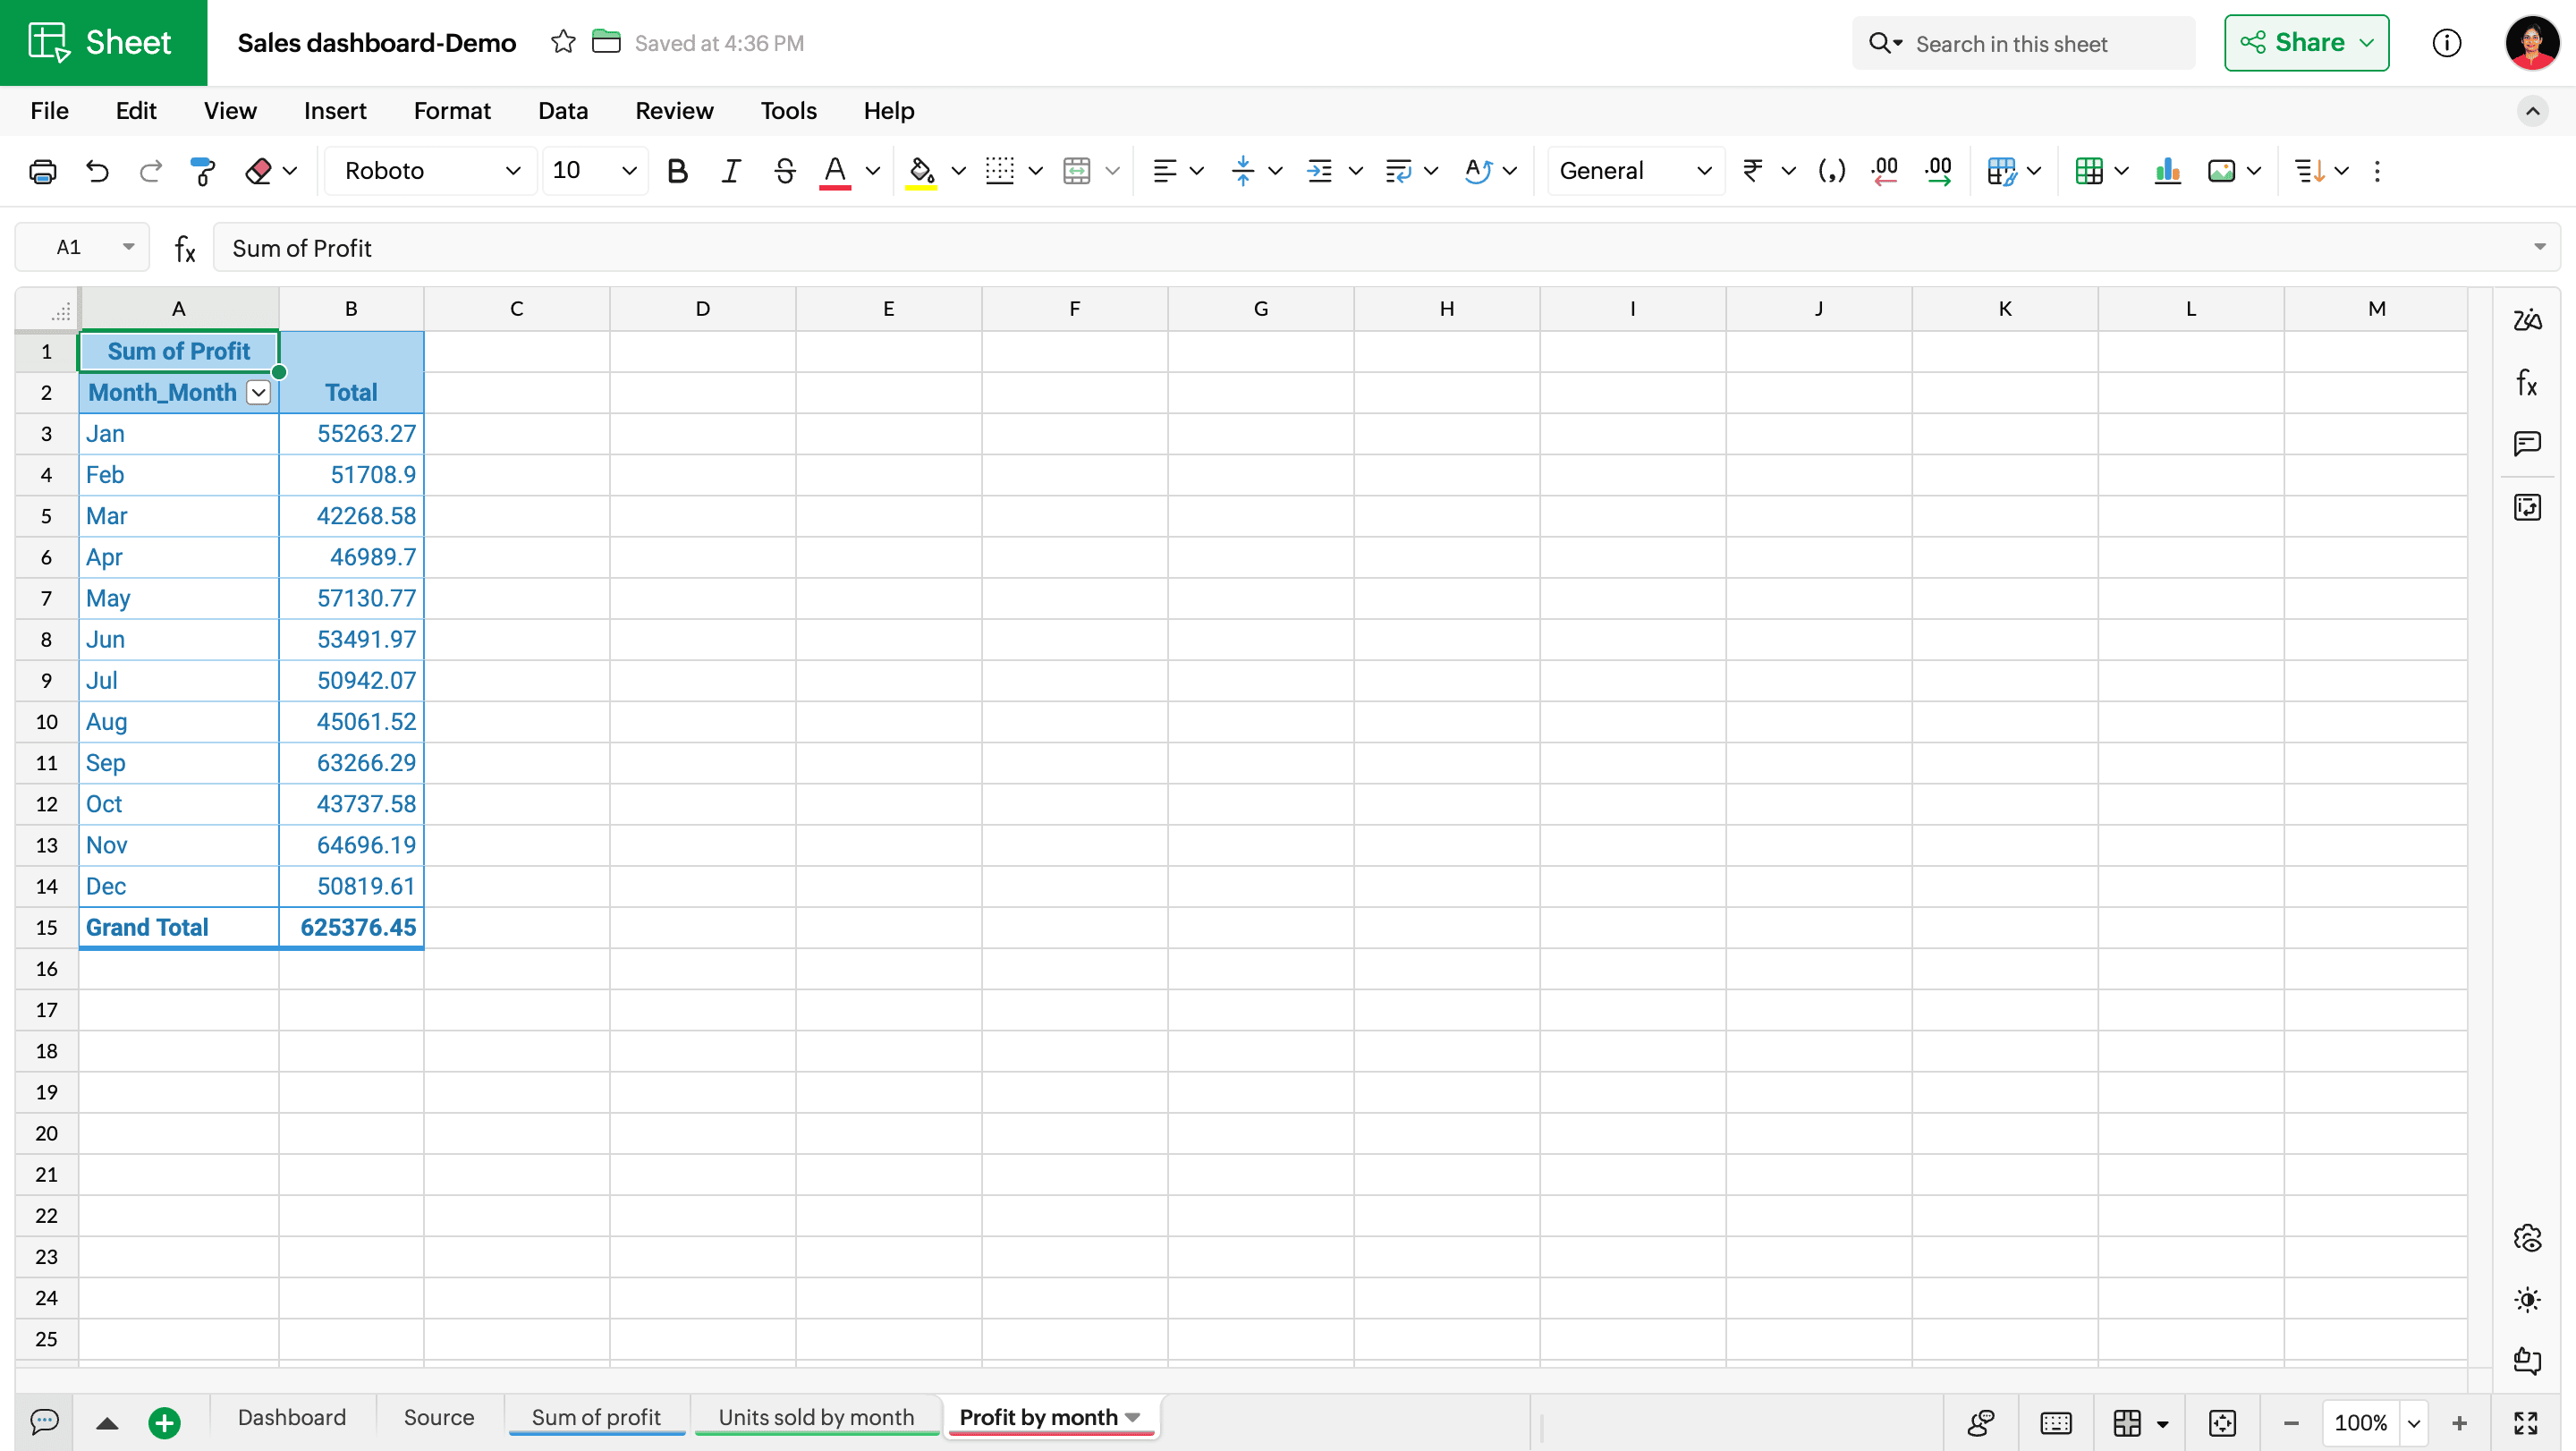
Profit by month: This sheet contains a pivot table that summarizes the total profit made each month.
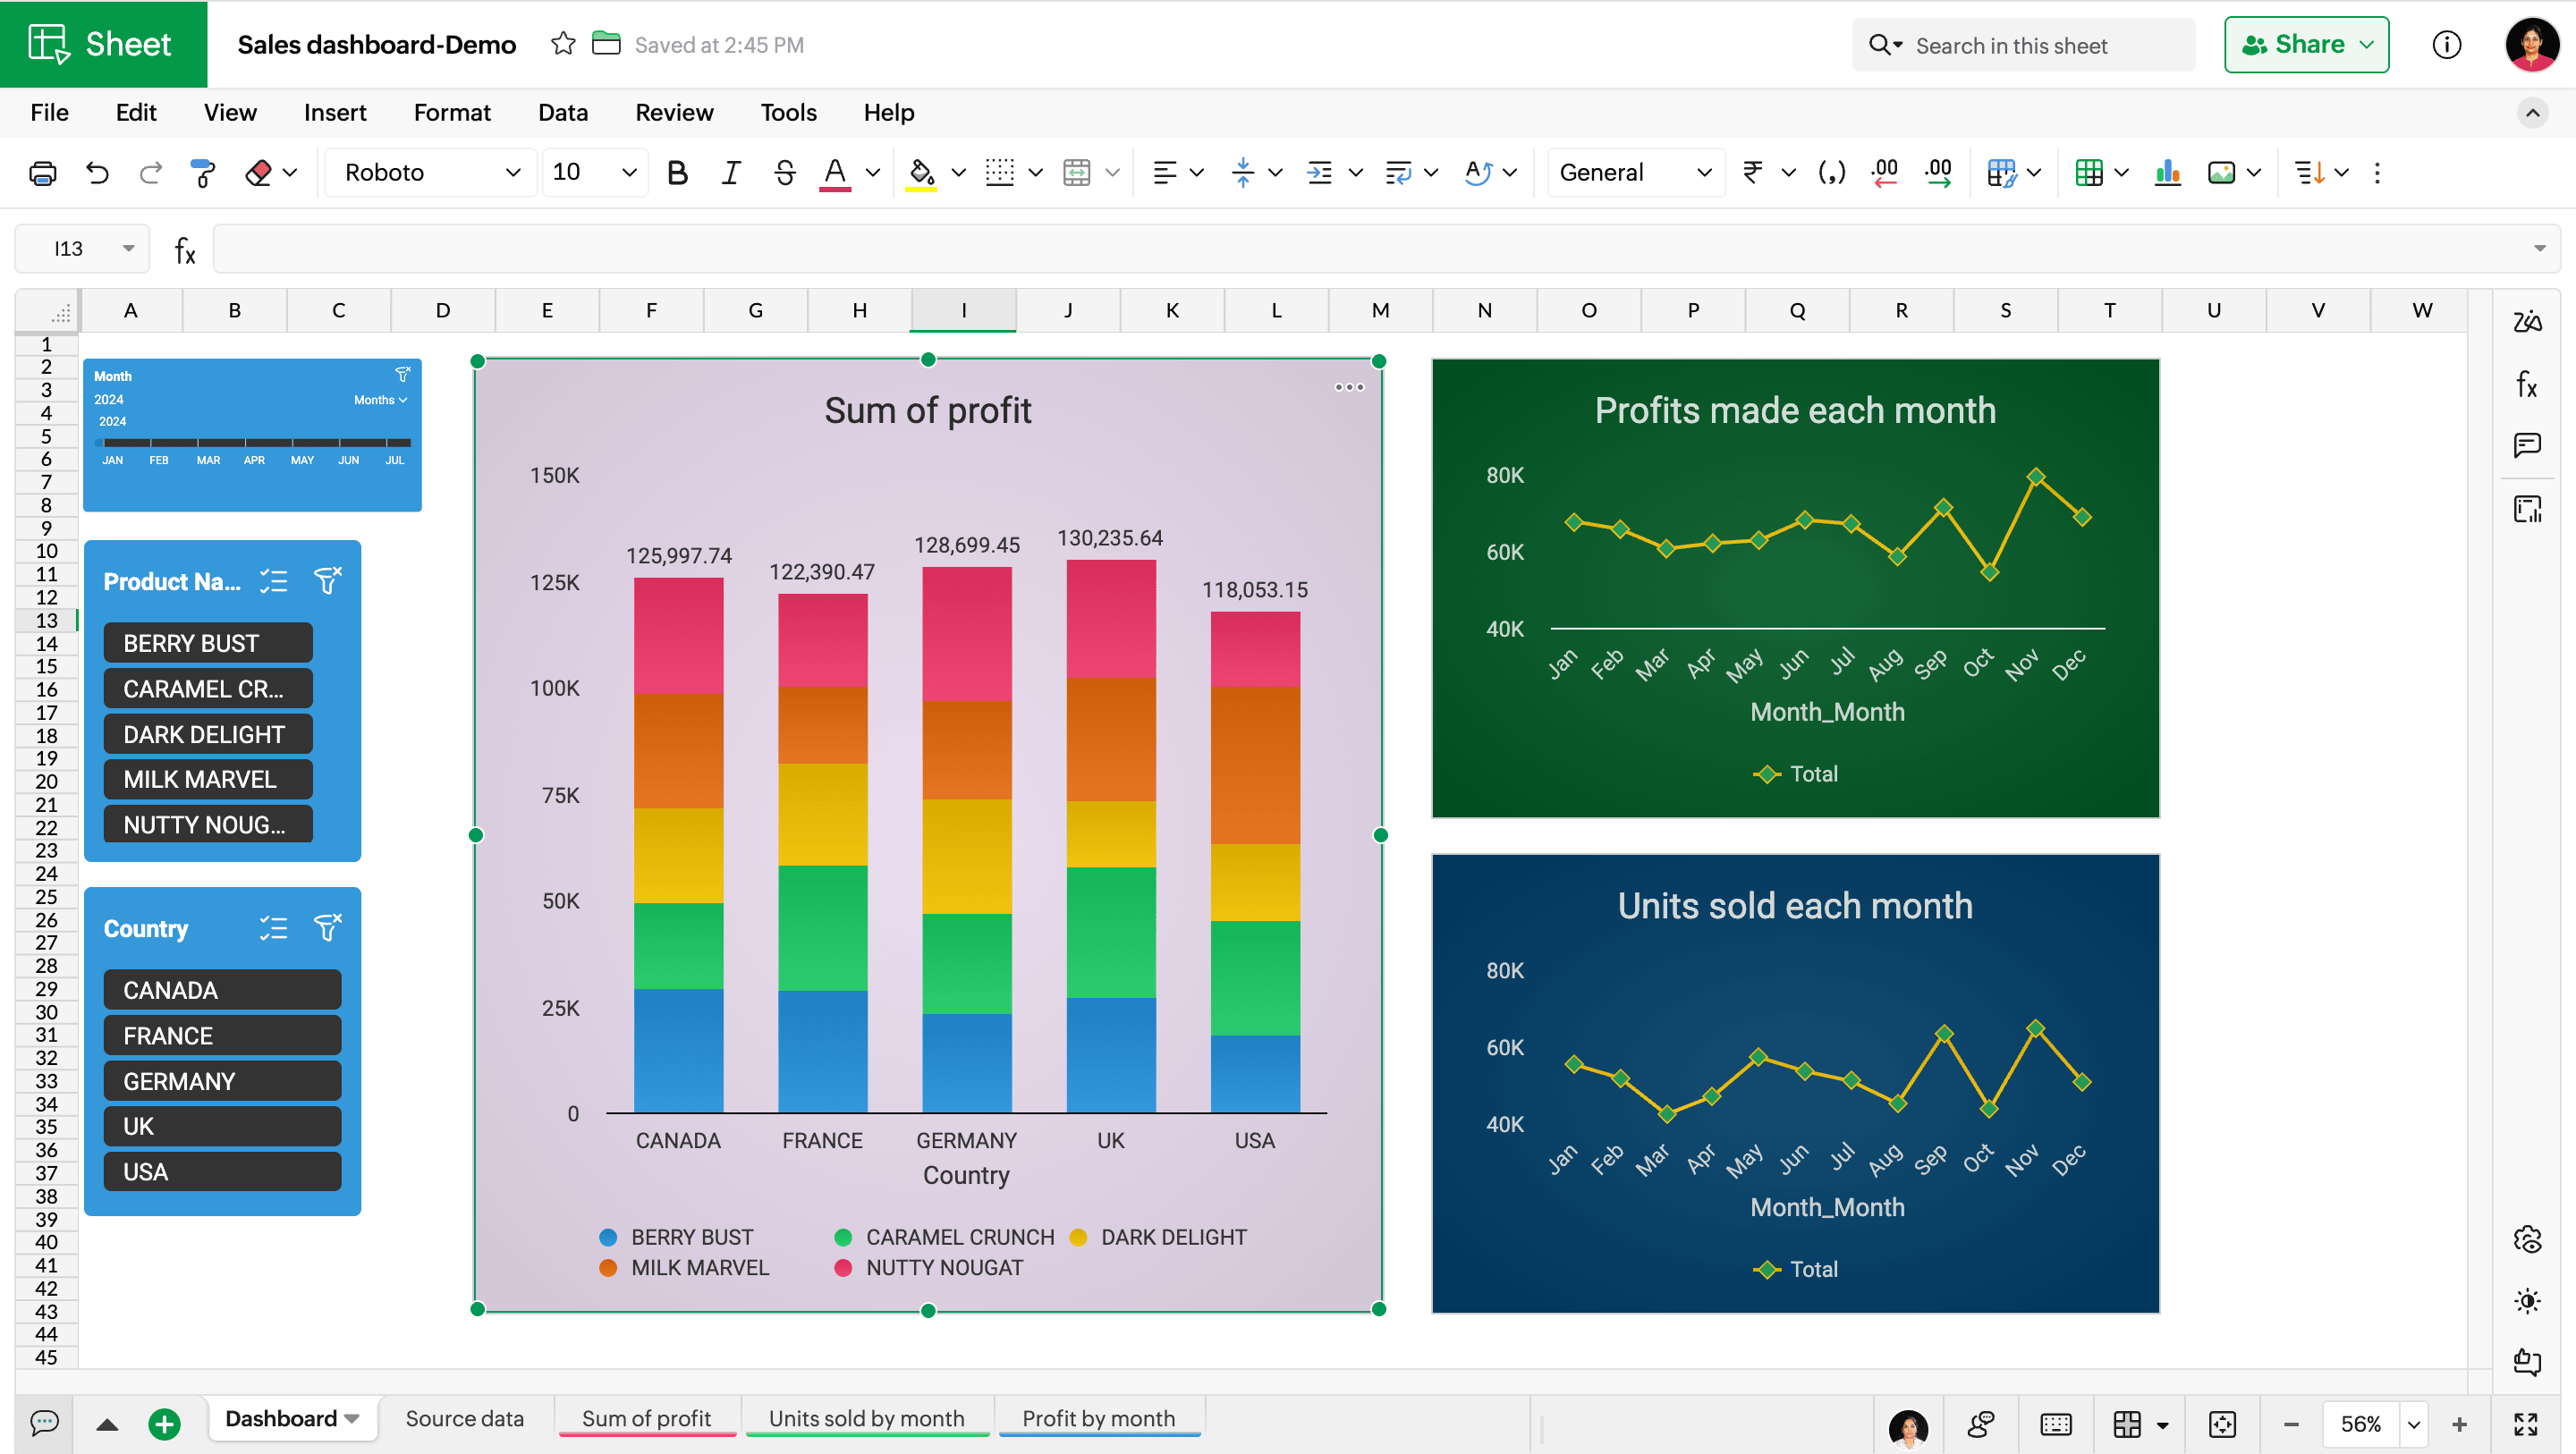
Dashboard: This is a dedicated sheet for the visualizing and analyzing the overall sales performance with tools like charts, slicers, and timelines.
Tip: You can color-code each sheet for easier and quicker navigation.
Building the dashboard
The dashboard is the place where you'll organize all your visuals. By building this sales dashboard, I'm looking to highlight the key metrics, observe patterns, and overall analyze the sales performance.
The sales dashboard I'm creating will have the following elements:
Stacked column charts: Charts represent a quick snapshot of the overall sales performance. I have created stacked column charts to analyze the profit made from each chocolate type across each country.
Line chart: I have created two line charts—one to view and analyze the profit made each month and another to view and analyze the number of units sold each month.
Tip: Choose the right chart type based on how you wish to interpret the data. Bar and column charts are useful to compare data across categories; line charts are ideal for observing trends in data over time; pie charts are useful to represent the percentages or parts of a whole. Not sure about the right chart for your data? AI-powered chart recommendations suggest the suitable charts based on the selected data.
Slicers: Slicers help you filter out and analyze a specific dataset in an interactive way. I have added a couple of slicers to analyze the sales performance based on the country and the chocolate type.
Timeline: Timeline helps you filter and analyze data based on specific time range.
You can enhance the visualization of data in your dashboard by customizing the color, style, alignment, and placement of the elements.
 Subashree Ramamurthy
Subashree is as a product marketer that drives product launches, updates, and focuses keenly on sales enablement. She also actively contributes in demand generation and user education.Outside work, she's somewhere stuck between curating kids-friendly recipes and testing sipper bottle cleaning hacks.